Cracking a skill-specific interview, like one for Background in Instrumentation and Analytical Techniques, requires understanding the nuances of the role. In this blog, we present the questions you’re most likely to encounter, along with insights into how to answer them effectively. Let’s ensure you’re ready to make a strong impression.
Questions Asked in Background in Instrumentation and Analytical Techniques Interview
Q 1. Explain the principles of Gas Chromatography-Mass Spectrometry (GC-MS).
Gas Chromatography-Mass Spectrometry (GC-MS) is a powerful analytical technique used to separate and identify volatile and semi-volatile compounds in a mixture. It combines the separating power of gas chromatography (GC) with the identification capabilities of mass spectrometry (MS).
In GC, the sample is vaporized and injected into a column packed with a stationary phase. Different compounds interact differently with the stationary phase, leading to separation as they travel through the column at varying speeds. This separation is based on their boiling points and polarity. The separated compounds then elute from the column and enter the mass spectrometer.
The mass spectrometer ionizes the molecules, fragments them, and separates the resulting ions based on their mass-to-charge ratio (m/z). This produces a mass spectrum, a unique fingerprint for each compound, allowing for its identification. The combination of retention time from the GC and the mass spectrum from the MS provides unequivocal identification and quantification of the components in a complex mixture.
For example, GC-MS is commonly used in environmental monitoring to detect pollutants in water or air samples, in forensic science for identifying drugs or explosives, and in food safety for detecting contaminants or adulterants. Imagine trying to find a specific spice in a complex curry – GC-MS acts like a super-powered spice detector, separating and identifying each component individually.
Q 2. Describe the different types of HPLC detectors and their applications.
High-Performance Liquid Chromatography (HPLC) utilizes various detectors to analyze the separated components. The choice of detector depends on the properties of the analytes.
UV-Vis Detectors: These are the most common and detect compounds that absorb ultraviolet or visible light. They are versatile and relatively inexpensive. Applications include analyzing pharmaceuticals, environmental pollutants, and food additives.
Fluorescence Detectors: These detectors measure the emitted light from fluorescent compounds. They offer higher sensitivity than UV-Vis detectors for fluorescent compounds. Applications include analyzing pharmaceuticals, biological molecules, and environmental pollutants.
Refractive Index Detectors: These measure changes in the refractive index of the mobile phase. They are less sensitive than UV-Vis or fluorescence detectors but are universal, meaning they can detect almost any compound. Applications include analyzing carbohydrates and polymers.
Electrochemical Detectors: These measure the current produced by the oxidation or reduction of electrochemically active compounds. They are highly sensitive and selective for certain compounds. Applications include analyzing neurotransmitters, pharmaceuticals, and environmental pollutants.
Mass Spectrometer Detectors: HPLC coupled with mass spectrometry (HPLC-MS) provides both separation and identification of compounds. This is a very powerful technique with high sensitivity and specificity. Applications span a wide range, similar to GC-MS, but including less volatile compounds.
The selection of the detector is crucial for successful HPLC analysis. For instance, if you’re analyzing a colorless compound that doesn’t fluoresce, a UV-Vis or refractive index detector would be suitable, while a fluorescent compound would benefit from a fluorescence detector.
Q 3. How would you troubleshoot a malfunctioning UV-Vis spectrophotometer?
Troubleshooting a malfunctioning UV-Vis spectrophotometer requires a systematic approach. First, I’d check the most common issues:
Verify the power supply: Ensure the instrument is properly plugged in and the power switch is on.
Check the lamp: UV-Vis spectrophotometers use deuterium and tungsten lamps. A malfunctioning lamp will cause poor readings. The lamp’s age and usage should be checked.
Examine the cuvette: Ensure the cuvette is clean, free of scratches, and correctly oriented in the sample holder. Fingerprints or smudges can drastically affect readings.
Check the baseline: Run a blank (solvent only) to establish a baseline. A drifting or noisy baseline indicates potential problems with the instrument or the environment (e.g., vibrations).
Test with a known standard: Measure the absorbance of a solution with a known concentration and compare it to the expected value. Significant deviation suggests issues with the instrument’s calibration or wavelength accuracy.
Check the software: Ensure the correct parameters are set (wavelength range, scan speed, etc.). Software glitches can also cause errors.
If the problem persists after these checks, consult the instrument’s manual or contact a service technician. Remember to always document each step taken during troubleshooting.
For example, during a routine quality control check, I once encountered an issue where the UV-Vis spectrophotometer was giving inconsistent readings. By systematically checking each component, I discovered a loose connection in the power supply, which was easily fixed.
Q 4. What are the limitations of atomic absorption spectroscopy (AAS)?
Atomic Absorption Spectroscopy (AAS) is a sensitive technique for determining the concentration of elements in a sample, but it does have limitations:
Limited to elements: AAS is primarily used for elemental analysis and cannot directly analyze molecules or compounds.
Matrix effects: The presence of other elements in the sample (matrix) can interfere with the absorption of the analyte, affecting accuracy. Matrix modification techniques can sometimes mitigate this.
Sensitivity varies: The sensitivity of AAS varies significantly depending on the element being analyzed. Some elements are easily detected, while others require higher concentrations.
Spectral interference: Overlapping absorption lines from different elements can lead to inaccurate results. This can be minimized by using background correction techniques.
Sample preparation: AAS often requires extensive sample preparation, including digestion or extraction, which can be time-consuming and introduce errors.
For instance, analyzing trace amounts of lead in a complex environmental sample can be challenging due to matrix effects. Other elements present might interfere with lead’s absorption signal, making it difficult to obtain accurate measurements.
Q 5. Explain the difference between precision and accuracy in analytical measurements.
Precision and accuracy are both crucial aspects of analytical measurements, but they represent different qualities.
Accuracy refers to how close a measurement is to the true or accepted value. Imagine hitting the bullseye on a dartboard – that’s accuracy.
Precision refers to how close repeated measurements are to each other. Imagine hitting the same spot repeatedly on the dartboard, even if that spot isn’t the bullseye – that’s precision.
You can have high precision but low accuracy (repeatedly hitting the same spot, but far from the target), high accuracy but low precision (hitting the bullseye but inconsistently), or ideally, both high precision and high accuracy (repeatedly hitting the bullseye).
For example, in a quality control laboratory, a precise method would consistently produce similar results when testing the same sample repeatedly, but it must also be accurate, meaning the results should closely align with the reference standard. A high level of both precision and accuracy are essential to ensure the reliability and validity of the results.
Q 6. How do you calibrate and validate analytical instruments?
Calibration and validation are essential steps for ensuring the reliability of analytical instruments. Calibration establishes the relationship between the instrument’s response and the concentration of the analyte, while validation confirms that the method is suitable for its intended purpose.
Calibration typically involves using standards of known concentrations to generate a calibration curve. This curve is then used to determine the concentration of unknowns from their measured responses. Calibration frequency depends on the instrument and the application but is often done daily or weekly. For example, a spectrophotometer is calibrated using standards of known absorbance.
Validation involves a series of tests to confirm the accuracy, precision, linearity, limit of detection (LOD), limit of quantitation (LOQ), and robustness of an analytical method. These tests are performed according to regulatory guidelines (e.g., GLP, GMP). Validation ensures that the results generated by the method are reliable and accurate.
Imagine you’re using a scale to weigh ingredients for baking a cake. Calibration ensures the scale provides consistent and accurate weights using standard weights. Validation confirms the scale’s ability to consistently measure different ingredients accurately within a specific range, crucial to ensuring the cake is baked correctly.
Q 7. Describe your experience with method development and validation in analytical chemistry.
Throughout my career, I’ve extensively participated in method development and validation, primarily focusing on environmental and pharmaceutical analysis. My experience encompasses various techniques, including HPLC, GC-MS, and AAS.
Method development involves optimizing parameters such as mobile phase composition, column selection, and detection wavelength to achieve the desired separation and sensitivity. I’ve often utilized design of experiments (DoE) approaches to efficiently explore the parameter space and identify optimal conditions. For example, developing an HPLC method for analyzing a mixture of pharmaceutical compounds required extensive optimization of the mobile phase pH and gradient to achieve baseline separation of all components.
Method validation follows rigorous protocols to demonstrate the method’s reliability and accuracy. This includes assessing parameters like linearity, precision (repeatability and intermediate precision), accuracy, limit of detection, limit of quantification, and robustness. I am proficient in preparing the necessary documentation and following regulatory guidelines (e.g., ICH guidelines for pharmaceutical analysis). During a project involving the analysis of pesticides in fruits, rigorous validation was crucial to ensure the accuracy of the results and meet regulatory requirements for food safety. This experience highlighted the importance of meticulous attention to detail in this aspect.
Q 8. Explain the principles of inductively coupled plasma mass spectrometry (ICP-MS).
Inductively Coupled Plasma Mass Spectrometry (ICP-MS) is a powerful analytical technique used to detect and quantify trace elements in various samples. It combines the robustness of Inductively Coupled Plasma (ICP) with the sensitivity and specificity of mass spectrometry. The process begins with introducing a liquid sample into an argon plasma, a super-hot, electrically conductive gas, generating ions of the elements present.
The plasma is generated by passing argon gas through a radio-frequency field, creating temperatures exceeding 7000 K. This high temperature atomizes and ionizes the sample. These ions are then extracted, focused, and separated in a mass spectrometer based on their mass-to-charge ratio (m/z). A detector measures the abundance of each ion, providing a quantitative measure of the elements in the original sample. Imagine it like a super-powered sorting machine for atoms, capable of identifying individual elements with astonishing precision.
For instance, ICP-MS is commonly used in environmental monitoring to analyze heavy metals in water, soil, or air. In the pharmaceutical industry, it helps to determine trace metal impurities in drug formulations. The high sensitivity of ICP-MS allows for the detection of elements at parts-per-billion (ppb) or even parts-per-trillion (ppt) levels.
Q 9. What are the key factors affecting the resolution in chromatography?
Resolution in chromatography refers to the ability to separate two closely eluting peaks. High resolution means better separation, allowing for accurate quantification of individual components in a mixture. Several key factors influence chromatographic resolution:
- Column Efficiency (N): A longer, more efficient column with smaller particle size packing material provides more theoretical plates, leading to better separation. Think of a longer, smoother road for your molecules to travel down, allowing them to separate more effectively.
- Selectivity (α): This describes how well the stationary phase distinguishes between different analytes. A higher selectivity factor leads to better separation. It’s like having a specialized filter that attracts one type of molecule more strongly than another.
- Retention Factor (k’): This represents the interaction between the analyte and the stationary phase. Optimal retention factors, neither too high nor too low, are crucial for good separation. Think of this as finding the ‘sweet spot’ for the interaction time.
In practice, improving resolution often involves optimizing these factors. For example, switching to a different column with higher efficiency or better selectivity, changing the mobile phase composition to adjust retention factors, or adjusting temperature for improved efficiency can all enhance resolution.
Q 10. How would you handle outliers in your analytical data?
Handling outliers in analytical data is critical for maintaining data integrity and drawing accurate conclusions. Outliers are data points that significantly deviate from the overall trend. Before discarding any data, a thorough investigation is crucial.
First, I would visually inspect the data using scatter plots or box plots to identify potential outliers. Then, I would investigate the potential causes: Was there a mistake in sample preparation, instrument malfunction, or a genuine anomaly? If a clear cause is identified (e.g., a known instrumental spike), the outlier can be removed. However, if no obvious reason is found, statistical methods like Grubbs’ test or Dixon’s Q-test can help determine if the outlier is statistically significant and warrants removal.
Alternatively, robust statistical methods that are less sensitive to outliers, like median instead of mean, can be employed for data analysis. Detailed documentation of the outlier identification and handling process is crucial for transparency and reproducibility.
Q 11. Describe your experience with data analysis software (e.g., Empower, Chromeleon).
I have extensive experience with both Empower and Chromeleon, two leading chromatography data systems (CDS). Empower, developed by Waters, is known for its user-friendly interface and extensive data management capabilities, while Chromeleon, from Thermo Fisher Scientific, offers robust features for complex workflows and regulatory compliance.
In my previous role, I used Empower to process and analyze HPLC data for pharmaceutical quality control. My tasks included creating and validating analytical methods, processing samples, generating reports, and ensuring data integrity. I have also utilized Chromeleon extensively for UPLC and GC data analysis, including the development of custom reports and integration with LIMS (Laboratory Information Management System) for efficient data management and tracking. I am proficient in data processing, peak integration, system suitability tests, and generating compliance-ready reports.
Q 12. Explain the concept of linearity and its importance in analytical methods.
Linearity in analytical methods refers to the ability of the instrument or method to produce a response that is directly proportional to the concentration of the analyte over a specific range. It is crucial for quantitative analysis as it ensures accurate and reliable results.
In simpler terms, if you double the concentration of a substance, you should ideally double the signal response. A linear calibration curve, typically obtained by plotting the response (e.g., peak area) against concentration, demonstrates linearity. Deviation from linearity can indicate issues like matrix effects, instrument limitations, or degradation of the analyte.
The importance of linearity stems from its direct impact on accuracy and precision. Non-linearity introduces errors in quantification, making it difficult to obtain reliable results. Therefore, establishing and verifying linearity over the intended concentration range is a critical step in method validation for any quantitative analytical technique. A non-linear calibration curve would require more complex calculations and may reduce the accuracy of the analysis.
Q 13. How do you ensure the quality control of your analytical results?
Ensuring the quality control (QC) of analytical results is paramount. This involves implementing a robust system to verify the accuracy, precision, and reliability of the data. Key aspects of my QC procedures include:
- Regular instrument calibration and maintenance: This ensures the instrument is functioning optimally and producing reliable results.
- Use of certified reference materials (CRMs): CRMs provide a known concentration of the analytes, enabling the evaluation of accuracy and precision. Regular CRM analysis allows for identification of any drifts or potential issues.
- Use of control samples: Control samples, similar to the test samples but with known concentrations, are included in each batch of samples. These samples monitor the overall performance of the method throughout the analysis.
- Statistical process control (SPC): SPC charts help track performance over time and detect any systematic issues or trends. Control charts with upper and lower control limits help to monitor precision and ensure that the measurements are within the acceptable range.
- Proper documentation and chain of custody: Maintaining detailed records of all procedures and data is essential for traceability and compliance.
By following these procedures, I can build confidence in the quality and reliability of my analytical results.
Q 14. What are the different types of sampling techniques and their applications?
Sampling techniques are crucial for obtaining representative samples that accurately reflect the characteristics of the entire population being studied. The choice of technique depends largely on the nature of the sample and the analytical goals.
Some common techniques include:
- Simple Random Sampling: Each member of the population has an equal chance of being selected. This is suitable for homogeneous populations.
- Stratified Sampling: The population is divided into subgroups (strata), and samples are randomly selected from each stratum. Useful when the population has known sub-groups with varying characteristics.
- Systematic Sampling: Samples are selected at regular intervals. Easy to implement but can be biased if there’s a pattern in the population.
- Composite Sampling: Multiple individual samples are combined into one composite sample. Cost-effective for large sample numbers, but information on individual samples is lost.
- Grab Sampling: A single sample is collected at a specific point in time and location. Quick and easy but may not be representative.
The application depends on the context. For example, in environmental monitoring, grab samples might be used for assessing immediate pollution levels, whereas composite sampling could be used for routine monitoring of wastewater.
Q 15. Describe your experience with different sample preparation techniques.
Sample preparation is crucial before any analytical technique. The goal is to transform a complex, real-world sample into a form suitable for analysis. This often involves separating the analyte (the substance of interest) from the matrix (everything else). My experience spans various techniques, including:
- Liquid-Liquid Extraction (LLE): Separating compounds based on their solubility in different solvents. For example, extracting caffeine from coffee beans using dichloromethane.
- Solid-Phase Extraction (SPE): Using a solid sorbent to selectively retain the analyte, then eluting it with a suitable solvent. This is highly useful in cleaning up environmental samples prior to analysis by techniques such as GC or LC-MS.
- Solid-Phase Microextraction (SPME): A miniaturized version of SPE, often used for volatile compound analysis. Think of extracting aroma compounds from wine before GC-MS analysis.
- Microwave-Assisted Extraction (MAE): Using microwave energy to accelerate the extraction process, reducing extraction time and solvent consumption. This is particularly useful for extracting compounds from plant matrices.
- Ultrasound-Assisted Extraction (UAE): Using ultrasonic waves to enhance the extraction of analytes from a sample matrix. Useful for extracting natural products from plant material.
The choice of technique depends heavily on the nature of the sample, the analyte, and the analytical technique to be used. I always consider factors like analyte stability, matrix complexity, and the desired level of purification.
Career Expert Tips:
- Ace those interviews! Prepare effectively by reviewing the Top 50 Most Common Interview Questions on ResumeGemini.
- Navigate your job search with confidence! Explore a wide range of Career Tips on ResumeGemini. Learn about common challenges and recommendations to overcome them.
- Craft the perfect resume! Master the Art of Resume Writing with ResumeGemini’s guide. Showcase your unique qualifications and achievements effectively.
- Don’t miss out on holiday savings! Build your dream resume with ResumeGemini’s ATS optimized templates.
Q 16. Explain the principles of NMR spectroscopy.
Nuclear Magnetic Resonance (NMR) spectroscopy is a powerful technique that exploits the magnetic properties of atomic nuclei to determine the structure and dynamics of molecules. It relies on the fact that certain atomic nuclei (like 1H and 13C) possess a property called spin, making them behave like tiny magnets.
When placed in a strong magnetic field, these nuclei align either with or against the field. A radiofrequency pulse is then applied, causing the nuclei to absorb energy and flip their spins. After the pulse, the nuclei relax back to their original alignment, emitting a signal that is detected. This signal is processed to generate an NMR spectrum.
The spectrum shows peaks corresponding to different nuclei in the molecule. The chemical shift (position of the peak) is influenced by the electronic environment surrounding the nucleus, providing information about the functional groups and bonding. Coupling constants (splitting patterns of the peaks) provide information on the connectivity between nuclei. In essence, NMR provides a detailed fingerprint of the molecule’s structure and its dynamic behavior.
Q 17. What are the different types of mass analyzers used in mass spectrometry?
Mass analyzers are the heart of a mass spectrometer, separating ions based on their mass-to-charge ratio (m/z). Several types exist, each with its strengths and weaknesses:
- Quadrupole: Uses oscillating electric fields to filter ions based on their m/z. Relatively inexpensive and robust, but lower resolution than other analyzers.
- Time-of-Flight (TOF): Measures the time it takes for ions to travel a known distance. Can achieve high mass accuracy and resolution, especially with improved techniques such as MALDI-TOF.
- Orbitrap: Traps ions in an orbit around a central electrode, offering very high resolution and mass accuracy. Often used in proteomics for precise mass measurements of proteins.
- Ion Trap: Traps ions in an electric or magnetic field and then releases them sequentially for mass analysis. Can perform tandem mass spectrometry (MS/MS) experiments for structural elucidation.
- Magnetic Sector: Uses a magnetic field to bend the path of ions, separating them based on their m/z. Offers high mass resolution but is generally larger and more expensive than other analyzers.
The choice of mass analyzer depends on the specific application. For instance, high-throughput screening might utilize a quadrupole for speed, while detailed protein characterization would prefer the high resolution of an Orbitrap.
Q 18. How would you interpret a chromatogram?
Interpreting a chromatogram involves identifying and quantifying the different components present in a sample. A chromatogram is a graph plotting signal intensity (usually representing the analyte concentration) versus retention time (the time it takes for a compound to elute from the column). Each peak corresponds to a different compound.
Key aspects of interpretation include:
- Peak identification: Comparing retention times to those of known standards. Using spectral data (e.g., from MS or NMR) for confirmation.
- Peak quantification: Measuring peak area or height to determine the relative or absolute amount of each compound. Calibration curves are often used for quantitative analysis.
- Resolution: Evaluating the separation of peaks; good resolution means peaks are well-separated, preventing overlapping and ensuring accurate quantification.
- Peak purity: Assessing whether a peak represents a single compound or a mixture. Techniques like diode array detection in HPLC can help determine peak purity.
For example, a gas chromatogram of essential oils might show several distinct peaks, each corresponding to a different volatile compound, which can be identified and quantified to determine the composition of the oil. Any unusual peaks or changes in the chromatogram compared to a standard might indicate contamination or degradation.
Q 19. What are the advantages and disadvantages of different analytical techniques?
Different analytical techniques offer unique advantages and disadvantages:
| Technique | Advantages | Disadvantages |
|---|---|---|
| Gas Chromatography (GC) | High sensitivity, good resolution, widely applicable to volatile compounds | Requires volatile and thermally stable samples, limited applicability to non-volatile compounds |
| High-Performance Liquid Chromatography (HPLC) | Widely applicable to a broad range of compounds, including non-volatile and thermally labile ones, high resolution | Lower sensitivity than some other techniques, more complex instrumentation |
| Mass Spectrometry (MS) | High sensitivity, high mass accuracy, provides structural information | Can be expensive, sample preparation can be challenging |
| Nuclear Magnetic Resonance (NMR) | Provides detailed structural information, non-destructive | Lower sensitivity than some other techniques, requires specialized equipment |
| UV-Vis Spectroscopy | Simple, fast, inexpensive | Limited structural information, less sensitive than other techniques |
The ‘best’ technique depends entirely on the specific analytical problem, the nature of the sample, the desired information, and available resources. For example, GC-MS is a powerful combination well-suited for analyzing volatile organic compounds in environmental samples, whereas HPLC is better for analyzing non-volatile compounds in pharmaceuticals.
Q 20. Explain the concept of limit of detection (LOD) and limit of quantitation (LOQ).
The limit of detection (LOD) and limit of quantitation (LOQ) are crucial parameters that define the analytical sensitivity of a method.
LOD: The lowest concentration of an analyte that can be reliably detected, although not necessarily quantified accurately. It’s often defined as the concentration that produces a signal three times the standard deviation of the blank (a measurement without the analyte).
LOQ: The lowest concentration of an analyte that can be quantified with acceptable accuracy and precision. It is generally set at 10 times the standard deviation of the blank or at a signal-to-noise ratio of 10:1.
Think of it like this: Imagine trying to spot a faint star in the night sky. The LOD represents the faintest star you can barely see. The LOQ represents the faintest star whose brightness you can measure reliably.
In a real-world example, determining the LOD and LOQ of a pesticide residue in food is critical to ensuring the method is sensitive enough to detect potentially harmful levels, ensuring food safety and regulatory compliance.
Q 21. How do you assess the uncertainty associated with analytical measurements?
Assessing uncertainty in analytical measurements is crucial for ensuring the reliability and validity of results. Uncertainty arises from various sources, including:
- Sampling error: Variations in the composition of the sample itself.
- Method error: Inherent limitations and variations in the analytical method.
- Instrumental error: Variations and limitations of the instruments used.
- Human error: Errors made during sample handling, data analysis, etc.
Uncertainty is typically expressed as a confidence interval or standard deviation. Several approaches are employed to assess uncertainty:
- Calibration curves: Analyzing the uncertainty in the slope and intercept of the calibration curve.
- Repeatability and reproducibility studies: Measuring the variability in the results obtained under different conditions (e.g., different days, different analysts).
- Standard addition method: Adding known amounts of analyte to the sample to account for matrix effects.
- Statistical methods: Using statistical tools like ANOVA and regression analysis to evaluate variability and uncertainty.
Proper uncertainty assessment is critical for ensuring the quality and reliability of analytical data and helps in making informed decisions. For example, in clinical chemistry, understanding the uncertainty associated with blood glucose measurements is vital for making accurate diagnoses and treatment plans.
Q 22. Describe your experience with statistical analysis of analytical data.
Statistical analysis is fundamental to interpreting analytical data and ensuring the reliability of our findings. It allows us to move beyond simply recording numbers to understanding trends, variations, and uncertainties inherent in the measurement process. My experience encompasses a wide range of techniques, including descriptive statistics (mean, standard deviation, variance), hypothesis testing (t-tests, ANOVA), regression analysis, and more advanced methods like principal component analysis (PCA) and chemometrics.
For instance, in a recent project analyzing pesticide residues in agricultural samples, I used ANOVA to compare the effectiveness of different extraction methods. The ANOVA results clearly indicated one method yielded significantly lower standard deviations and therefore provided more reliable results. In another project involving chromatographic data, I employed PCA to reduce the dimensionality of complex datasets, effectively identifying key factors influencing the separation of different compounds.
Beyond specific techniques, a crucial aspect is understanding the underlying assumptions of each statistical method and ensuring the data meets those assumptions. Data transformations are often necessary to achieve normality or homoscedasticity, for example. Ultimately, the goal is to draw valid conclusions and make informed decisions based on the data, acknowledging inherent uncertainties.
Q 23. How do you ensure data integrity in analytical laboratories?
Data integrity is paramount in analytical laboratories. It’s not just about getting the right answer; it’s about proving you got the right answer. My approach to ensuring data integrity involves a multifaceted strategy:
- Strict adherence to SOPs (Standard Operating Procedures): SOPs are the backbone of a reliable system. They ensure consistency and traceability in all procedures, from sample handling to data analysis.
- Chain of Custody: Maintaining a meticulous chain of custody, documenting every step of the sample’s journey from collection to disposal, prevents sample mix-ups or contamination.
- Calibration and Verification: Regular calibration and verification of instruments are critical to ensure accuracy and precision. Detailed records of these procedures must be maintained.
- Quality Control (QC) and Quality Assurance (QA): Incorporating QC samples (blanks, standards, duplicates) throughout the analytical process allows for continuous monitoring of accuracy, precision and potential contamination issues.
- Electronic Data Management Systems (EDMS): Using validated EDMS to track, store, and manage data electronically minimizes the risk of manual errors and ensures data security and traceability. Data should be secured with proper access control and audit trails.
- Regular Audits and Training: Internal and external audits provide an independent assessment of laboratory practices. Regular training keeps personnel up-to-date on best practices and emerging technologies.
Failing to maintain data integrity can lead to inaccurate results, compromised studies, and in the worst-case scenario, legal ramifications. It’s a culture of meticulousness and transparency.
Q 24. Explain the importance of Standard Operating Procedures (SOPs) in analytical laboratories.
Standard Operating Procedures (SOPs) are the lifeblood of any well-run analytical laboratory. They are detailed, step-by-step instructions for performing specific tasks and analyses. Think of them as the laboratory’s recipe book, ensuring consistency and reproducibility in results.
The importance of SOPs stems from several factors:
- Reproducibility: SOPs guarantee that different analysts performing the same test will obtain consistent results, regardless of their experience level.
- Accuracy and Precision: Well-written SOPs minimize errors by outlining best practices and highlighting potential pitfalls.
- Traceability: Detailed records generated following SOPs enable tracing the origin of any error or deviation.
- Compliance: SOPs are crucial for complying with regulatory requirements, such as those mandated by the FDA or ISO.
- Training: SOPs are essential tools for training new personnel, ensuring they understand the proper procedures and techniques.
Without SOPs, a laboratory risks producing unreliable data, compromising quality control, and potentially facing regulatory sanctions. They are the foundation for a trustworthy and efficient analytical process.
Q 25. Describe your experience with troubleshooting complex instrumentation problems.
Troubleshooting complex instrumentation is a significant part of my role. My approach involves a systematic, logical process, starting with the most basic checks and progressing to more complex diagnostics. I’ve encountered numerous challenges, from minor software glitches to major hardware failures.
A typical troubleshooting process begins with:
- Reviewing instrument logs and error messages: This provides crucial clues regarding the nature of the problem.
- Checking basic parameters: Verifying gas flows, voltages, temperatures, and other parameters relevant to the instrument’s operation.
- Visual inspection: A careful examination of connections, tubing, and other components often reveals obvious issues like leaks or loose connections.
- Testing with known standards: Running standards allows the determination of the source of error (sample preparation, instrument malfunction etc.).
- Consulting manuals and documentation: Instrument manuals offer valuable troubleshooting guidance.
- Contacting vendor support: When necessary, I escalate problems to vendor support engineers, leveraging their expertise and resources.
For instance, I once resolved a persistent issue with a GC-MS by identifying a faulty column connection leading to improper flow rates. Another time, I diagnosed a malfunctioning detector in a HPLC by systematically checking its power supply and signal connections. Systematic troubleshooting, combined with a strong understanding of the instrument’s operational principles, is key to resolving these issues efficiently.
Q 26. How would you approach the validation of a new analytical method?
Validating a new analytical method is a rigorous process to demonstrate its suitability for its intended purpose. This involves systematically evaluating its accuracy, precision, linearity, range, specificity, limit of detection (LOD), limit of quantitation (LOQ), robustness, and ruggedness.
The validation process typically involves these steps:
- Specificity: Demonstrating that the method accurately measures the analyte of interest without interference from other components in the sample matrix.
- Linearity: Establishing a linear relationship between the analyte concentration and the measured signal over a defined concentration range.
- Accuracy: Determining the closeness of the measured values to the true value, often using certified reference materials.
- Precision: Assessing the reproducibility of measurements under the same conditions (repeatability) and across different days or analysts (reproducibility).
- Range: Defining the concentration range over which the method provides accurate and precise results.
- LOD and LOQ: Determining the lowest concentration of analyte that can be reliably detected and quantified, respectively.
- Robustness and Ruggedness: Evaluating the method’s resistance to small variations in experimental parameters (robustness) and its performance under different conditions or laboratories (ruggedness).
Each step requires careful documentation and statistical analysis to demonstrate the method meets pre-defined acceptance criteria. Thorough validation ensures confidence in the results generated by the method and minimizes the risk of errors.
Q 27. What are your preferred methods for identifying and resolving instrument drift?
Instrument drift, the gradual change in an instrument’s response over time, is a common challenge. My preferred methods for identification and resolution involve a combination of preventative and corrective measures:
- Regular Calibration: Frequent calibration using certified standards is fundamental. The frequency depends on the instrument and application but could range from daily to weekly.
- Quality Control Samples: Regular analysis of QC samples (e.g., blanks, standards, duplicates) allows for early detection of drift. Trends in QC data indicate potential problems.
- Internal Standards: Incorporating internal standards, substances added to the sample prior to analysis, helps correct for variations in the instrument’s response over time. This is especially helpful for quantitative analysis.
- Regular Maintenance: Proper maintenance, including cleaning and preventative checks according to the manufacturer’s recommendations, minimizes the likelihood of drift.
- Environmental Controls: Maintaining stable environmental conditions, such as temperature and humidity, is crucial for minimizing drift, especially for sensitive instruments.
- Software Corrections: Some instruments offer software correction algorithms to compensate for drift. These should be used according to the manufacturer’s instructions.
If drift is detected, the underlying cause needs to be addressed before continuing with further analysis. A faulty component may need to be repaired or replaced. By combining these strategies, I effectively minimize instrument drift and maintain data quality.
Q 28. Explain the principles of Fourier Transform Infrared Spectroscopy (FTIR).
Fourier Transform Infrared Spectroscopy (FTIR) is a powerful analytical technique used to identify and quantify various molecules based on their interaction with infrared light. It exploits the fact that different molecules absorb infrared radiation at characteristic frequencies, creating a unique ‘fingerprint’ spectrum.
Here’s a breakdown of the principles:
- Infrared Radiation: FTIR uses infrared light, a type of electromagnetic radiation with lower energy than visible light. When infrared light interacts with a molecule, it causes vibrational changes (stretching, bending, etc.) in its chemical bonds.
- Absorption of Infrared Light: Molecules absorb infrared radiation at specific frequencies corresponding to their vibrational modes. These absorption frequencies are unique to each molecule, creating a distinct spectral fingerprint.
- Fourier Transform: Unlike older dispersive infrared spectrometers, FTIR instruments utilize an interferometer to simultaneously measure the absorption of all infrared frequencies. The resulting interferogram is then mathematically transformed (using a Fourier transform) into a spectrum showing absorbance vs. wavenumber (cm-1).
- Spectral Interpretation: The resulting spectrum shows peaks at specific wavenumbers, corresponding to the characteristic vibrational modes of the molecules present in the sample. By comparing the obtained spectrum to reference spectra, we can identify the components in a sample.
FTIR is widely used in various fields, including chemistry, materials science, and environmental monitoring, for identifying unknown substances, quantifying components in mixtures, and studying molecular structures. Its versatility and non-destructive nature make it an indispensable tool in many analytical labs.
Key Topics to Learn for Background in Instrumentation and Analytical Techniques Interview
- Spectroscopic Techniques: Understand the principles behind UV-Vis, IR, NMR, and Mass Spectrometry. Be prepared to discuss their applications in qualitative and quantitative analysis, including sample preparation and data interpretation.
- Chromatographic Techniques: Master the fundamentals of HPLC, GC, and TLC. Focus on separation mechanisms, detector types, and method optimization for different analytes. Practice explaining troubleshooting common issues encountered in these techniques.
- Electroanalytical Techniques: Familiarize yourself with potentiometry, voltammetry, and amperometry. Be able to discuss the principles of these techniques and their applications in various analytical scenarios.
- Data Analysis and Interpretation: Develop strong skills in interpreting analytical data, including error analysis, statistical methods, and the use of software packages for data processing and visualization. Practice explaining trends and drawing conclusions from experimental results.
- Instrumentation Maintenance and Troubleshooting: Demonstrate a practical understanding of instrument maintenance procedures, common malfunctions, and troubleshooting strategies. This includes calibration, validation, and preventative maintenance.
- Method Validation and Quality Control: Understand the principles of method validation (accuracy, precision, linearity, etc.) and quality control procedures relevant to analytical testing. Be prepared to discuss regulatory requirements and compliance.
- Laboratory Safety and Good Laboratory Practices (GLP): Showcase your knowledge of safe laboratory practices and adherence to GLP principles, highlighting your understanding of safety regulations and handling of hazardous materials.
Next Steps
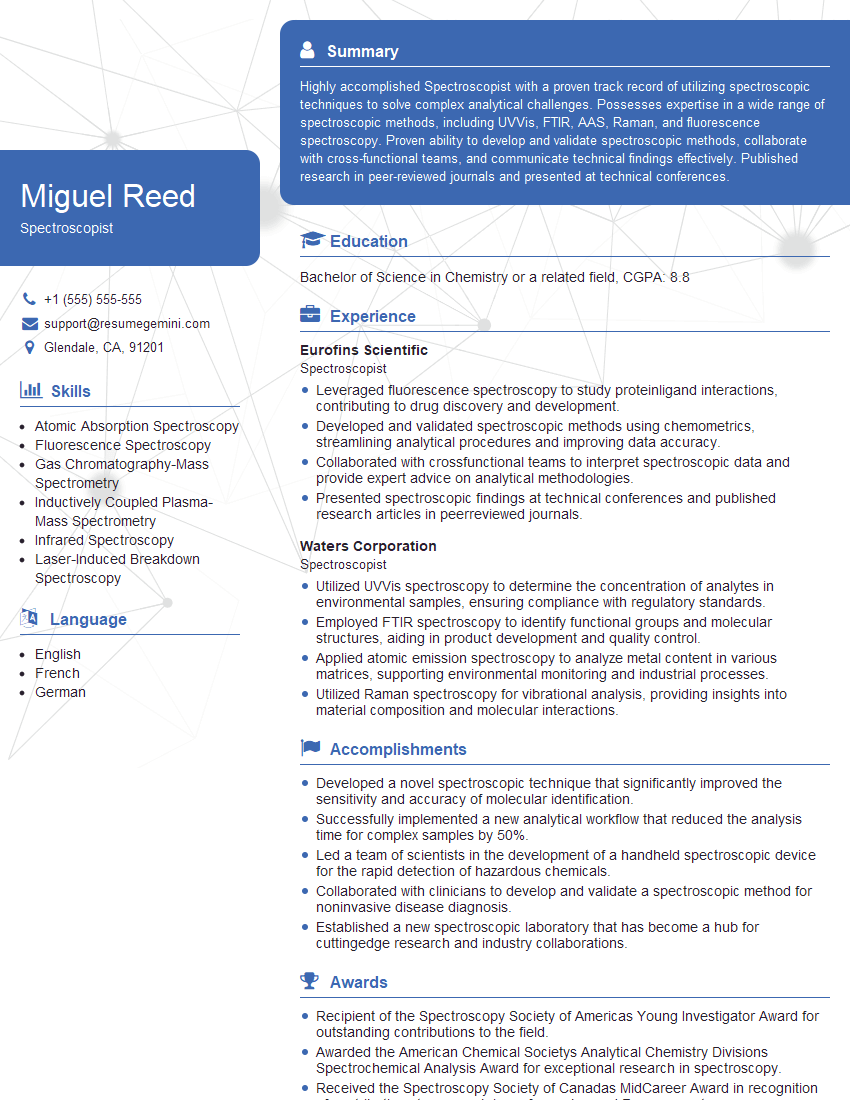
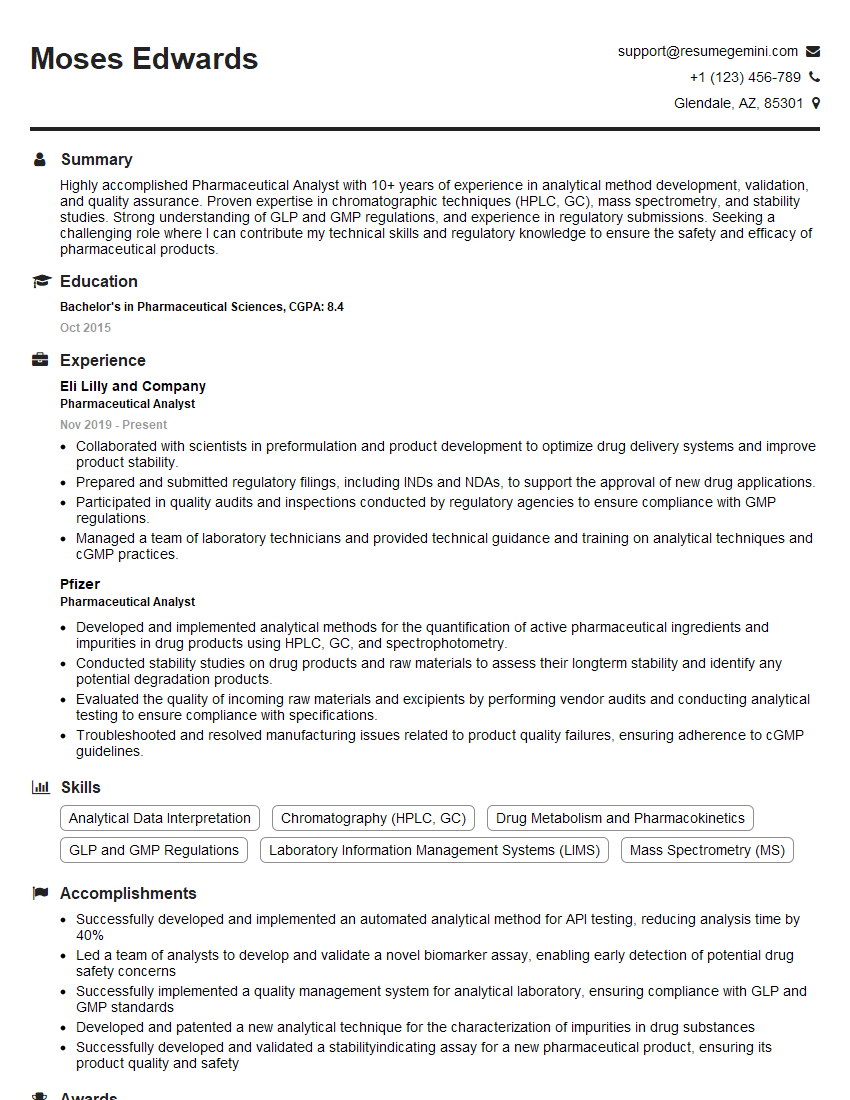
Mastering Background in Instrumentation and Analytical Techniques is crucial for career advancement in scientific fields. A strong understanding of these techniques positions you for roles with greater responsibility and higher earning potential. To maximize your job prospects, invest time in crafting a professional and ATS-friendly resume that effectively showcases your skills and experience. ResumeGemini is a trusted resource to help you build a compelling resume that highlights your expertise. Examples of resumes tailored to Background in Instrumentation and Analytical Techniques are available to help guide you.
Explore more articles
Users Rating of Our Blogs
Share Your Experience
We value your feedback! Please rate our content and share your thoughts (optional).
What Readers Say About Our Blog
good
