Unlock your full potential by mastering the most common Laboratory Analysis and Interpretation interview questions. This blog offers a deep dive into the critical topics, ensuring you’re not only prepared to answer but to excel. With these insights, you’ll approach your interview with clarity and confidence.
Questions Asked in Laboratory Analysis and Interpretation Interview
Q 1. Explain the principle behind spectrophotometry.
Spectrophotometry is a powerful analytical technique used to measure the absorbance or transmission of light through a solution. It’s based on the principle that the concentration of a substance is directly proportional to the amount of light it absorbs at a specific wavelength. This relationship is described by the Beer-Lambert Law: A = εbc, where A is absorbance, ε is the molar absorptivity (a constant specific to the substance and wavelength), b is the path length of the light through the sample (usually the width of the cuvette), and c is the concentration of the analyte.
Imagine shining a flashlight through a colored liquid. The darker the liquid, the less light gets through. Spectrophotometry quantifies this: we measure how much light is absorbed, and using the Beer-Lambert Law, we can calculate the concentration of the colored substance. Different substances absorb light at different wavelengths, allowing us to selectively measure specific components in a mixture.
In practice, a spectrophotometer shines a beam of light of a specific wavelength through a sample, and a detector measures the amount of light that passes through. The absorbance is then calculated and used to determine the concentration of the analyte. This technique finds widespread use in various applications, such as clinical diagnostics (measuring glucose levels), environmental monitoring (detecting pollutants), and quality control in the pharmaceutical industry (analyzing drug purity).
Q 2. Describe the process of validating a new analytical method.
Validating a new analytical method is crucial for ensuring its reliability and accuracy before it’s used for routine analysis. This process typically involves several key steps:
- Specificity: Demonstrating that the method only measures the target analyte and not other substances that might be present in the sample. This often involves using various standards and interfering substances.
- Linearity: Showing a linear relationship between the concentration of the analyte and the measured signal over a relevant concentration range. This involves preparing a series of standard solutions and plotting a calibration curve.
- Range: Determining the concentration range over which the method provides accurate and precise results.
- Accuracy: Assessing how close the measured values are to the true values. This can involve using certified reference materials or comparing results with a different, established method.
- Precision: Evaluating the reproducibility of the method. This is often assessed by calculating the standard deviation or relative standard deviation of replicate measurements.
- Limit of Detection (LOD) and Limit of Quantification (LOQ): Determining the lowest concentration of the analyte that can be reliably detected and quantified, respectively.
- Robustness: Assessing the influence of small variations in the method parameters (e.g., temperature, reagent concentration) on the results.
For example, when validating a new HPLC method for analyzing a drug in a pharmaceutical formulation, we would prepare a series of standard solutions, analyze them, and construct a calibration curve to check for linearity. We would also use reference materials to assess accuracy and perform replicate analyses to determine precision. Throughout the entire validation process meticulous record keeping and documentation is crucial.
Q 3. How do you ensure the accuracy and precision of your laboratory results?
Ensuring the accuracy and precision of laboratory results requires a multi-faceted approach involving meticulous attention to detail at every stage of the analysis:
- Proper Calibration and Maintenance of Instruments: Regular calibration using certified standards is essential to maintain instrument accuracy. Instruments should also be regularly maintained according to the manufacturer’s instructions.
- Use of Certified Reference Materials (CRMs): CRMs provide known concentrations of analytes and are used to verify the accuracy of the analytical method.
- Quality Control (QC) Samples: QC samples (e.g., blanks, duplicates, and spiked samples) are run with the unknown samples to monitor the performance of the analytical method and detect potential errors.
- Proper Sample Handling and Preparation: Avoiding contamination, ensuring proper mixing, and using appropriate storage conditions are critical to maintaining sample integrity.
- Trained Personnel: Well-trained personnel are essential for performing the analyses correctly and interpreting the results accurately.
- Statistical Analysis: Statistical methods (e.g., calculating means, standard deviations, and confidence intervals) are used to assess the accuracy and precision of the results. Control charts are routinely used to monitor the performance of the methods over time.
For instance, in a clinical laboratory, regular QC checks of blood glucose analyzers using control sera with known glucose concentrations ensure that the results reported to patients are accurate and reliable. Similarly, a food safety laboratory would use CRM’s to verify the accuracy of pesticide residue analysis.
Q 4. What are the common sources of error in laboratory analysis, and how can they be minimized?
Common sources of error in laboratory analysis can be broadly classified as:
- Random Errors: These are unpredictable variations that occur due to factors like instrument noise, fluctuations in temperature or reagent concentrations. They can be minimized by using appropriate statistical methods (e.g., performing multiple measurements and calculating averages) and by controlling environmental conditions.
- Systematic Errors: These are consistent, repeatable errors due to flaws in the method or instrument. Examples include miscalibration of instruments, impure reagents, or inaccurate pipetting. These errors can be minimized through careful calibration, use of high-quality reagents, proper training, and regular maintenance of instruments.
- Human Errors: These include mistakes in sample handling, data entry, or calculation. They can be reduced by proper training, careful attention to detail, and using checklists.
Minimizing Errors: Implementing a robust quality assurance program is key. This involves regular calibration and maintenance of equipment, use of appropriate statistical methods for data analysis, proper training of personnel, and adherence to standard operating procedures (SOPs). Regularly reviewing the entire analytical process for potential weaknesses and implementing corrective actions proactively is extremely beneficial.
For instance, a systematic error might arise from a consistently inaccurate pipette, leading to incorrect sample dilutions and inaccurate results. Careful calibration and regular maintenance of this pipette would solve the issue. A human error could be made during data entry, which can be minimized using quality control checks and double data entry procedures.
Q 5. Explain the difference between qualitative and quantitative analysis.
Qualitative analysis identifies the components present in a sample, while quantitative analysis determines the amount or concentration of each component.
Think of it like this: qualitative analysis is like identifying the ingredients in a cake (flour, sugar, eggs, etc.), whereas quantitative analysis is like determining exactly how much of each ingredient is used (e.g., 2 cups of flour, 1 cup of sugar).
Qualitative analysis often employs techniques such as thin-layer chromatography (TLC) or mass spectrometry (MS) to identify substances based on their physical or chemical properties. For example, TLC can separate different pigments in a plant extract, allowing their identification by comparing their retention factors to known standards.
Quantitative analysis relies on techniques that measure the amount of a substance, such as spectrophotometry, titrations, or chromatography with detectors. For example, using HPLC with a UV detector, we can quantify the amount of caffeine in a coffee sample by measuring the peak area and comparing it to a calibration curve.
Q 6. Describe your experience with different chromatographic techniques (e.g., HPLC, GC).
I have extensive experience with various chromatographic techniques, including High-Performance Liquid Chromatography (HPLC) and Gas Chromatography (GC).
HPLC is my preferred method for analyzing thermally labile, non-volatile compounds. I’m proficient in different HPLC modes, such as reversed-phase, normal-phase, ion-exchange, and size-exclusion chromatography. I’ve used HPLC for a wide array of applications, from analyzing pharmaceutical formulations and environmental samples to characterizing proteins and peptides. My experience includes method development, optimization, and validation, along with troubleshooting instrument issues.
GC is particularly useful for separating and analyzing volatile and semi-volatile compounds. My experience includes the use of different detectors such as Flame Ionization Detectors (FID), Electron Capture Detectors (ECD), and Mass Spectrometers (MS). I’ve applied GC to analyze various samples, such as essential oils, pesticides in food, and volatile organic compounds (VOCs) in air. Similar to my HPLC experience, I am comfortable developing, optimizing, validating, and troubleshooting GC methods.
I’ve also worked with other techniques like Thin Layer Chromatography (TLC) for qualitative analysis and Ion Chromatography (IC) for the analysis of ions in different matrices.
Q 7. How do you interpret a standard curve?
A standard curve is a graph that plots the response of an analytical instrument (e.g., absorbance in spectrophotometry, peak area in chromatography) against the known concentrations of a series of standards. It is used to determine the concentration of an unknown sample by comparing its response to the standard curve.
To interpret a standard curve, you first check for linearity. A good standard curve shows a linear relationship between concentration and response within the working range. If the curve is not linear, you may need to adjust the analytical method or use a different range of concentrations. Once linearity is confirmed, the concentration of the unknown sample is determined by finding the corresponding concentration on the x-axis (concentration) that matches the measured response (y-axis) of the unknown sample.
The equation of the line (obtained through linear regression) can also be used to calculate the unknown concentration. For example, if the equation is y = mx + c, where y is the response, x is the concentration, m is the slope, and c is the y-intercept, we can solve for x given the measured value of y for the unknown sample. It’s critical to always work within the range of linearity of the standard curve for accurate results.
It’s also important to consider the R-squared value, which indicates the goodness of fit of the linear regression model. A higher R-squared value (closer to 1) indicates a better fit and higher confidence in the results.
Q 8. What are the regulatory requirements for laboratory analysis in your field?
Regulatory requirements for laboratory analysis are crucial for ensuring data accuracy, reliability, and the overall integrity of the results. These requirements vary depending on the specific field (e.g., environmental testing, food safety, pharmaceuticals) and the geographical location. However, common threads include adherence to national and international standards like ISO/IEC 17025 (General requirements for the competence of testing and calibration laboratories) and GLP (Good Laboratory Practice) guidelines. ISO 17025, for example, mandates a quality management system, documented procedures for all analytical methods, traceability of measurements, and regular proficiency testing to demonstrate competency. Specific regulations might also involve accreditation by a recognized body, participation in interlaboratory comparison studies, and maintaining detailed records of analyses, including instrument calibration and maintenance logs. In the environmental field, for instance, the EPA (Environmental Protection Agency) in the US dictates stringent regulations for specific analytes and methods used in water or soil testing, demanding strict adherence to specific protocols to ensure legally defensible results.
For example, a laboratory analyzing water samples for heavy metals must follow EPA Method 200.8, which specifies the exact instrumentation, sample preparation procedures, and quality control measures required. Failure to comply can result in sanctions, legal challenges, and reputational damage.
Q 9. Explain the importance of quality control in laboratory analysis.
Quality control (QC) is the backbone of reliable laboratory analysis. It’s a systematic process to ensure accuracy, precision, and reliability of results by detecting and correcting errors at every step. Imagine baking a cake – you wouldn’t just throw ingredients together and hope for the best. You’d measure carefully, follow the recipe precisely, and check the oven temperature. QC in a lab is similar. It involves implementing several key measures:
- Calibration and maintenance of instruments: Regular calibration verifies the accuracy of instruments against known standards. Maintenance ensures proper functionality.
- Use of controls and blanks: Controls (samples with known concentrations) are run alongside unknowns to monitor method performance. Blanks (samples without the analyte of interest) detect contamination.
- Duplicate analysis: Running the same sample multiple times verifies precision (how close replicate measurements are).
- Spiked samples: Adding known amounts of analyte to a sample checks recovery efficiency.
- Internal quality control charts: These visually track QC data over time, allowing for early detection of trends or shifts indicating potential problems.
Without robust QC, analytical errors can lead to incorrect conclusions, affecting decisions in various areas – from environmental remediation to medical diagnoses. For instance, an undetected instrument malfunction could lead to consistently low results in a pharmaceutical quality control setting, potentially releasing substandard drugs.
Q 10. How do you troubleshoot instrument malfunctions?
Troubleshooting instrument malfunctions requires a systematic approach. First, I’d consult the instrument’s manual for troubleshooting guides and error codes. Next, I’d perform basic checks, such as power supply, connections, and reagent levels. Then, I would systematically investigate potential issues:
- Check for obvious problems: Are there any error messages? Are there any physical blockages or leaks?
- Verify calibration: Is the instrument calibrated correctly? Calibration verification is often the first step in solving many instrumental problems.
- Inspect reagents and consumables: Are reagents fresh and properly stored? Are consumables like columns or filters clogged or degraded?
- Check the data acquisition system: Is the data being recorded correctly? Are there any issues with the software or data transfer?
- If the problem persists, contact instrument vendor or service technician: They possess specialized knowledge and may be needed to repair the equipment.
For example, if a high-performance liquid chromatography (HPLC) system shows unusually high baseline noise, I might first check the mobile phase for air bubbles, then examine the column for pressure issues, and finally ensure proper instrument temperature control. If these steps don’t resolve the issue, contacting a service technician is necessary.
Q 11. Describe your experience with data analysis software (e.g., LIMS, Excel).
I have extensive experience with both LIMS (Laboratory Information Management Systems) and spreadsheet software like Excel for data analysis. LIMS are comprehensive software packages specifically designed for managing laboratory data. They handle sample tracking, instrument integration, data processing, quality control, and reporting. My experience includes using LIMS for managing thousands of samples, automating workflows, and generating comprehensive reports. This significantly streamlines data management and minimizes errors. I am proficient in using Excel for data manipulation, statistical analysis, and creating visualizations (charts and graphs). I’ve used Excel extensively to perform calculations, identify trends in data, and create reports for clients. For example, I’ve used Excel to build customized macros to automate repetitive tasks and perform complex statistical analyses, improving efficiency and reducing potential manual errors.
One specific example involved using a LIMS to track sample analysis for a large environmental remediation project. The LIMS enabled efficient sample tracking, streamlined data entry, and automated the generation of compliant reports, significantly reducing the time and resources required for this project.
Q 12. How do you handle outliers in your data?
Outliers in data represent values significantly different from the rest. Handling outliers requires careful consideration, as they can indicate genuine anomalies or errors. A systematic approach is crucial:
- Identify potential causes: Check for transcription errors, instrument malfunctions, or sample contamination. Investigate the outlier to understand its origin.
- Assess the impact: Determine the influence of the outlier on statistical analysis. Does it significantly skew the results?
- Apply appropriate statistical tests: Tests like Grubbs’ test or Dixon’s Q test can help assess if an outlier is statistically significant.
- Consider data transformation: Log transformation or other data transformations might reduce the influence of outliers.
- Document decisions: Clearly document the reasons for including or excluding outliers and the methods used.
Simply removing outliers without investigation is risky. For example, if an outlier represents a genuine event – a sudden pollution spike in a water sample, for instance – discarding it could lead to inaccurate conclusions about environmental contamination. Therefore, careful investigation and a documented rationale are vital.
Q 13. What are the different types of sampling techniques used in laboratory analysis?
Sampling techniques are crucial because the accuracy of laboratory analysis directly depends on the representativeness of the sample. Different techniques are used depending on the material being analyzed and the research question. Some common techniques include:
- Random sampling: Each element in the population has an equal chance of being selected. This is useful when there is no prior knowledge of the population’s variability.
- Systematic sampling: Samples are collected at fixed intervals. It is efficient but can be biased if the population has a cyclical pattern.
- Stratified sampling: The population is divided into strata (subgroups) based on relevant characteristics, and samples are taken from each stratum. This ensures representation from all subgroups.
- Composite sampling: Multiple samples are combined into one composite sample. This reduces analysis costs, but it masks individual variations.
- Grab sampling: A single sample is collected at a specific time and location. It is quick but might not reflect the overall population’s characteristics.
For example, in environmental soil testing, stratified sampling might be used to obtain representative samples from different soil layers, ensuring that the analysis accounts for variations in soil composition at different depths. In contrast, grab sampling might be suitable for a rapid assessment of water quality at a specific location.
Q 14. Explain your understanding of method validation parameters (e.g., linearity, accuracy, precision).
Method validation is a critical process to demonstrate that an analytical method is fit for its intended purpose. Key parameters include:
- Linearity: Assesses the ability of the method to produce results directly proportional to the analyte concentration within a specific range. It’s usually evaluated by constructing a calibration curve and assessing its linearity (e.g., using regression analysis).
- Accuracy: Measures how close the measured values are to the true value. It is often determined by analyzing samples with known concentrations (reference materials) and comparing the measured values to the true values.
- Precision: Reflects the reproducibility of the method; how close the replicate measurements are to each other. It is expressed as standard deviation or relative standard deviation (RSD). Precision can be assessed within-run (repeatability) and between-run (intermediate precision).
- Limit of detection (LOD) and limit of quantification (LOQ): These indicate the lowest concentration that can be reliably detected and quantified, respectively. These are crucial for determining the method’s sensitivity.
- Specificity/Selectivity: The ability of the method to measure the analyte of interest without interference from other substances.
These parameters are essential for ensuring the reliability and accuracy of analytical results. For instance, a method with poor linearity will produce unreliable results at higher or lower concentrations, while low accuracy indicates systematic errors requiring method improvement. These parameters are meticulously documented during method validation to demonstrate compliance with regulatory requirements and ensure the validity of the analytical data generated.
Q 15. How do you ensure the proper disposal of laboratory waste?
Proper laboratory waste disposal is paramount for environmental protection and personnel safety. It involves a multi-step process, beginning with segregation. We categorize waste into different streams: sharps (needles, broken glass), chemical waste (acids, bases, organic solvents), biological waste (infectious materials, cultures), and general waste (paper, plastics). Each stream requires specific handling.
- Sharps: Placed in puncture-resistant containers for autoclaving or incineration.
- Chemical waste: Separated according to compatibility and reactivity, often neutralized before disposal according to regulatory guidelines. Incompatible chemicals, like acids and bases, are never mixed.
- Biological waste: Autoclaved to decontaminate before disposal in designated biohazard bags.
- General waste: Appropriately disposed of according to institutional policies and local regulations.
Detailed records are maintained for all waste disposal events, including the type and quantity of waste, date of disposal, and the disposal method. This ensures compliance with environmental regulations and allows for traceability in case of incidents. Failure to adhere to these procedures can result in serious environmental damage or health risks.
Career Expert Tips:
- Ace those interviews! Prepare effectively by reviewing the Top 50 Most Common Interview Questions on ResumeGemini.
- Navigate your job search with confidence! Explore a wide range of Career Tips on ResumeGemini. Learn about common challenges and recommendations to overcome them.
- Craft the perfect resume! Master the Art of Resume Writing with ResumeGemini’s guide. Showcase your unique qualifications and achievements effectively.
- Don’t miss out on holiday savings! Build your dream resume with ResumeGemini’s ATS optimized templates.
Q 16. Describe your experience with different types of laboratory equipment.
My experience encompasses a wide range of laboratory equipment, from basic to advanced instrumentation. I’m proficient in using:
- Basic equipment: Balances (analytical and top-loading), centrifuges, autoclaves, spectrophotometers (UV-Vis, NIR), pH meters, incubators, ovens, microscopes (light and fluorescence).
- Advanced equipment: HPLC (High-Performance Liquid Chromatography), GC-MS (Gas Chromatography-Mass Spectrometry), ICP-OES (Inductively Coupled Plasma Optical Emission Spectrometry), and various types of electrophoresis systems (capillary, gel).
I have extensive hands-on experience operating, maintaining, and troubleshooting these instruments. For example, during a recent project involving pesticide residue analysis, I utilized GC-MS to identify and quantify various pesticides in soil samples. Understanding the capabilities and limitations of each instrument is crucial for selecting the most appropriate method for a specific analysis and ensuring accurate results. Regular calibration and maintenance are integral to ensure the reliability and accuracy of the data generated.
Q 17. Explain your understanding of statistical analysis in the context of laboratory data.
Statistical analysis is fundamental to interpreting laboratory data. It allows us to move beyond simply reporting individual measurements to understanding the underlying trends and variability within our data. We use various statistical tools to:
- Assess the precision and accuracy of our measurements: Calculating standard deviation, coefficient of variation, and confidence intervals helps determine the reliability of our results.
- Detect outliers: Identifying and managing outliers prevents skewed data from affecting the overall interpretation.
- Compare different groups or treatments: Methods like t-tests, ANOVA (Analysis of Variance) are essential for comparing means and variances between different samples.
- Establish correlations and regressions: Determining relationships between variables allows for prediction and modeling.
- Develop calibration curves: Essential for quantitative analysis, particularly in instrumental techniques.
For example, in a recent study examining the effects of a new fertilizer on crop yield, we used ANOVA to compare the mean yields of plants treated with the new fertilizer versus a control group. The statistical analysis provided compelling evidence regarding the fertilizer’s efficacy.
Q 18. How do you prepare samples for analysis?
Sample preparation is a crucial step, often representing a significant portion of the analytical process and directly influencing the accuracy of results. The method depends heavily on the sample matrix (e.g., soil, water, biological tissue) and the analyte of interest. Common techniques include:
- Weighing and measuring: Accurate mass measurement is essential for quantitative analysis.
- Dilution and concentration: Adjusting the concentration of the analyte to fall within the instrument’s detection range.
- Extraction: Isolating the analyte from the sample matrix using methods like solid-phase extraction (SPE), liquid-liquid extraction (LLE), or microwave-assisted extraction.
- Filtration: Removing particulate matter that could interfere with the analysis.
- Digestion: Breaking down organic matter to release the analyte, often using strong acids.
For instance, in analyzing heavy metals in water samples, I would first filter the sample to remove suspended solids. Then, I might use acid digestion to dissolve the metals before analysis by ICP-OES. Proper sample preparation ensures that the analyte is in a suitable form for the chosen analytical method.
Q 19. What are the limitations of your chosen analytical method?
The limitations of any analytical method are important considerations. For example, let’s consider HPLC. While it offers excellent separation and quantification capabilities, several limitations exist:
- Matrix effects: The presence of other components in the sample can interfere with analyte detection and quantification.
- Sensitivity limitations: HPLC may not be suitable for detecting analytes present at very low concentrations.
- Instrument limitations: The column type, flow rate, and detector choice affect the analysis’s sensitivity and selectivity.
- Sample preparation issues: Inefficient sample preparation can introduce errors.
- Cost and maintenance: HPLC systems can be expensive to purchase and maintain.
Understanding these limitations is crucial for method validation. For example, before using HPLC for pesticide residue analysis in food samples, we carefully consider the sensitivity requirements and potential matrix effects. Method validation experiments, employing techniques such as recovery studies and standard addition methods, are critical to quantify these limitations and ensure reliable results.
Q 20. How do you maintain laboratory safety protocols?
Maintaining laboratory safety is non-negotiable. We adhere to a strict set of protocols, including:
- Personal Protective Equipment (PPE): Appropriate PPE, such as lab coats, gloves, eye protection, and safety glasses, is always worn.
- Chemical safety: Proper handling and storage of chemicals, including using fume hoods for volatile substances and appropriate labeling and storage containers.
- Biological safety: Following proper procedures for handling biological materials, including autoclaving and appropriate waste disposal.
- Sharps safety: Using appropriate containers for sharps and disposing of them following established procedures.
- Emergency procedures: All personnel are trained in emergency procedures, including fire safety, chemical spills, and first aid.
- Regular safety training: Regular training and refresher courses ensure that all personnel are aware of and comply with safety guidelines.
We also maintain detailed safety records and perform regular safety inspections to identify and address potential hazards. A culture of safety is fostered through constant vigilance and proactive risk assessment.
Q 21. Describe a situation where you had to troubleshoot a complex analytical problem.
During a water quality analysis project, we encountered unexpectedly high levels of a specific heavy metal in several samples. Initial results seemed erroneous, prompting a thorough investigation. We systematically investigated several potential sources of error:
- Sample contamination: We checked for contamination at all stages, from sampling to analysis. We found no evidence of contamination during the sampling or laboratory procedures.
- Method validation: We re-validated the analytical method, ensuring the accuracy of our ICP-OES measurements. All calibrations and quality controls were within acceptable limits.
- Interference: We examined the possibility of spectral interferences in the ICP-OES readings. Through careful analysis, we discovered a specific matrix component in the water samples that was causing spectral interference, leading to artificially high readings for the heavy metal.
By employing a different analytical technique (atomic absorption spectroscopy) that was less susceptible to the specific interference, we obtained accurate results, significantly lower than the initial values obtained using ICP-OES. This experience highlighted the importance of thorough method validation, considering potential interferences, and utilizing multiple analytical techniques for confirmation, especially when unexpected results arise.
Q 22. Explain your understanding of Good Laboratory Practices (GLP).
Good Laboratory Practices (GLP) are a set of principles that ensure the uniformity, consistency, reliability, reproducibility, quality, and integrity of non-clinical laboratory studies. Think of it as a recipe for producing reliable scientific results. It’s not just about following a protocol; it’s about meticulously documenting every step to ensure that someone else could repeat the experiment and get the same results. This is crucial for regulatory compliance and the validity of research findings.
Key aspects of GLP include:
- Properly qualified personnel: Scientists involved must have the appropriate training and experience.
- Standard operating procedures (SOPs): Detailed, written procedures for all aspects of the study must be followed.
- Equipment calibration and maintenance: All instruments need regular calibration and maintenance logs to ensure accuracy.
- Sample handling and storage: Samples must be properly identified, handled, and stored to prevent contamination or degradation.
- Data integrity: Raw data must be accurately recorded, reviewed, and stored to prevent alteration or loss.
- Quality assurance: An independent quality assurance unit oversees the study to ensure compliance with GLP.
For example, in a pharmaceutical setting, adherence to GLP is mandatory for studies used to support drug registration. Failure to comply can lead to the rejection of the study and potentially, the delay or failure of drug approval.
Q 23. How do you document your laboratory procedures and results?
Laboratory documentation is paramount for reproducibility, traceability, and regulatory compliance. I use a combination of electronic and paper-based systems. All procedures are documented in detailed SOPs, often in a LIMS (Laboratory Information Management System). These SOPs include step-by-step instructions, safety precautions, and expected results. I always record raw data directly into laboratory notebooks or electronic data capture (EDC) systems. This is crucial to maintain a complete and accurate record of every step taken during an experiment.
For example, in a titration experiment, I would meticulously note the initial and final burette readings, the exact concentration of the titrant, the sample weight, and the temperature of the solution. Any observations, deviations from the SOP, or unexpected results are meticulously documented. Data are then transferred to spreadsheets or dedicated data analysis software for further processing. The raw data and processed data are kept separately, along with audit trails demonstrating any modifications made.
Q 24. Describe your experience with various laboratory techniques (e.g., titration, spectroscopy).
My experience spans a wide range of laboratory techniques, including both wet chemistry methods and instrumental techniques. I’m proficient in:
- Titration: Acid-base titrations, redox titrations, complexometric titrations. I’ve used titrations for determining the concentration of various substances, such as acids, bases, and metal ions. For instance, I used acid-base titration to determine the acidity of a soil sample.
- Spectroscopy: UV-Vis, IR, and Atomic Absorption Spectroscopy (AAS). I’ve used these methods for quantitative and qualitative analysis of various compounds. For example, I’ve employed UV-Vis spectroscopy to determine the concentration of a particular dye in a solution and IR spectroscopy to identify functional groups in an unknown organic compound.
- Chromatography: HPLC and GC. I have extensive experience with these separation techniques. For example, using HPLC for separating and quantifying components of a pharmaceutical mixture.
- Electrochemistry: Potentiometry, voltammetry. For example, measuring pH or analyzing electrochemical properties of materials.
I am comfortable adapting my skills to new techniques as needed and am always eager to learn.
Q 25. How do you ensure the integrity of your data?
Data integrity is the cornerstone of reliable scientific results. My approach is multi-faceted:
- Accurate recording: Raw data are recorded directly into notebooks or electronic systems, avoiding any shortcuts. I always double check my recordings.
- Chain of custody: Samples are meticulously tracked from collection to disposal, with clear documentation of handling at each stage. Any deviation from SOPs is duly noted.
- Data validation: Data are carefully reviewed for errors and inconsistencies. Statistical tests are applied where appropriate to assess accuracy and precision.
- Version control: Electronic data are saved using version control systems so that modifications are tracked.
- Audit trails: Any changes made to the data are documented with the date, time, and reason for the change.
- Data backup: Regular backups of both electronic and paper-based data are performed to prevent loss.
Imagine a scenario where a small error in a sample’s weight leads to inaccurate results. Through diligent attention to detail at every step, I aim to eliminate such possibilities.
Q 26. What software are you proficient in for data analysis and reporting?
I’m proficient in several software packages for data analysis and reporting, including:
- Microsoft Excel: For basic data organization, calculations, and graphing.
- GraphPad Prism: For advanced statistical analysis, curve fitting, and creating publication-quality graphs.
- LIMS (Laboratory Information Management System): For sample tracking, data management, and instrument integration.
- ChemStation/OpenLab CDS (Chromatography Data Systems): For processing chromatographic data from HPLC and GC.
- Specialized software for spectroscopy and electrochemistry: Depending on the specific instrument used, I am comfortable with relevant software packages for data acquisition and analysis.
My ability to utilize these software packages allows me to efficiently manage and analyze large datasets, generating comprehensive and easily interpretable reports.
Q 27. How do you stay up-to-date with the latest advancements in laboratory analysis techniques?
Keeping abreast of advancements in laboratory analysis is crucial to remaining competitive and ensuring the highest quality of work. I actively engage in several strategies:
- Scientific literature: I regularly read peer-reviewed journals, such as Analytical Chemistry and The Analyst, to stay updated on the latest techniques and methodologies.
- Conferences and workshops: Attending conferences and workshops allows me to network with other professionals and learn about new technologies firsthand.
- Online resources: I utilize online platforms like PubMed and Google Scholar to access research papers and review articles.
- Professional memberships: Membership in professional organizations, such as the American Chemical Society, provides access to webinars, publications, and networking opportunities.
- Vendor training: Participating in training sessions provided by instrument manufacturers keeps me updated on the newest features and applications of laboratory equipment.
For instance, recently I learned about a new mass spectrometry technique from a conference presentation, which I’m already considering for applications in my current projects.
Q 28. Explain the importance of proper calibration and maintenance of laboratory equipment.
Proper calibration and maintenance of laboratory equipment are absolutely essential for accurate and reliable results. Think of it like regularly tuning a musical instrument – you can’t expect it to produce beautiful music if it’s out of tune. Uncalibrated equipment leads to inaccurate measurements, potentially affecting entire studies. Regular maintenance prolongs the lifespan of equipment and prevents unexpected failures during critical experiments.
Calibration involves verifying the accuracy of an instrument against known standards. This often involves using certified reference materials (CRMs) and documenting the calibration results. Maintenance involves routine checks, cleaning, and repairs to ensure the instrument’s proper functioning. All calibration and maintenance activities are meticulously documented. For example, balances are calibrated using standard weights, spectrophotometers are calibrated using certified standards, and chromatography instruments are checked for leaks, column performance, and detector sensitivity. Detailed records, including dates, results, and any corrective actions, are always kept.
Key Topics to Learn for Laboratory Analysis and Interpretation Interview
- Analytical Techniques: Understand the principles and applications of various analytical methods like chromatography (HPLC, GC), spectroscopy (UV-Vis, IR, Mass Spec), and electrophoresis. Consider the strengths and limitations of each technique.
- Data Analysis and Interpretation: Practice interpreting complex datasets, identifying trends, and drawing meaningful conclusions. Develop skills in statistical analysis and error handling.
- Quality Control and Assurance: Familiarize yourself with GLP (Good Laboratory Practice) principles, quality control procedures, and the importance of accuracy and precision in laboratory analysis. Be prepared to discuss calibration and validation methods.
- Instrumentation and Maintenance: Demonstrate understanding of common laboratory instruments, their operation, troubleshooting, and routine maintenance. This includes preventative maintenance and calibration schedules.
- Laboratory Safety and Regulations: Review relevant safety protocols, handling of hazardous materials, and compliance with regulatory standards (e.g., OSHA, ISO).
- Specific Analytical Applications: Depending on the job description, focus on applications relevant to the field, such as clinical chemistry, environmental analysis, food safety, or pharmaceutical analysis.
- Problem-Solving and Critical Thinking: Be ready to discuss your approach to troubleshooting analytical problems, identifying sources of error, and developing solutions. Use examples from your experience to illustrate your skills.
- Communication and Reporting: Practice clearly communicating complex technical information, both verbally and in writing. Understand how to present results effectively through reports and presentations.
Next Steps
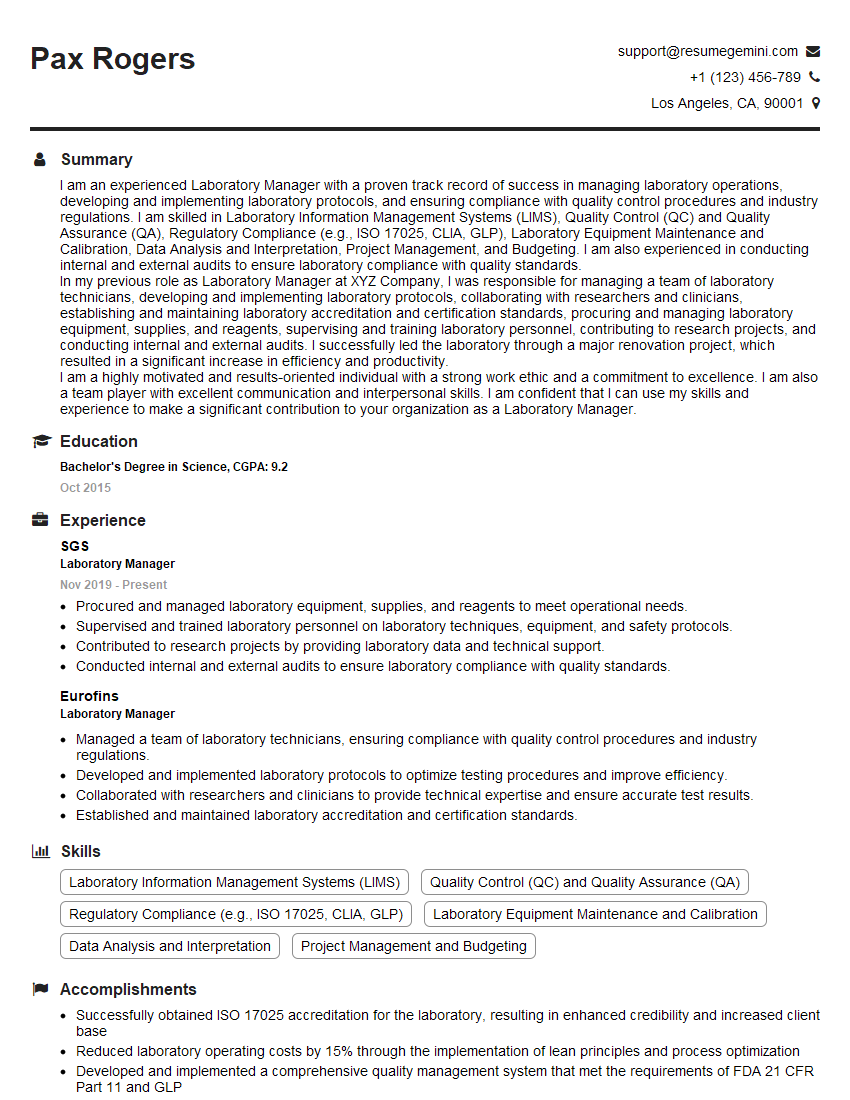
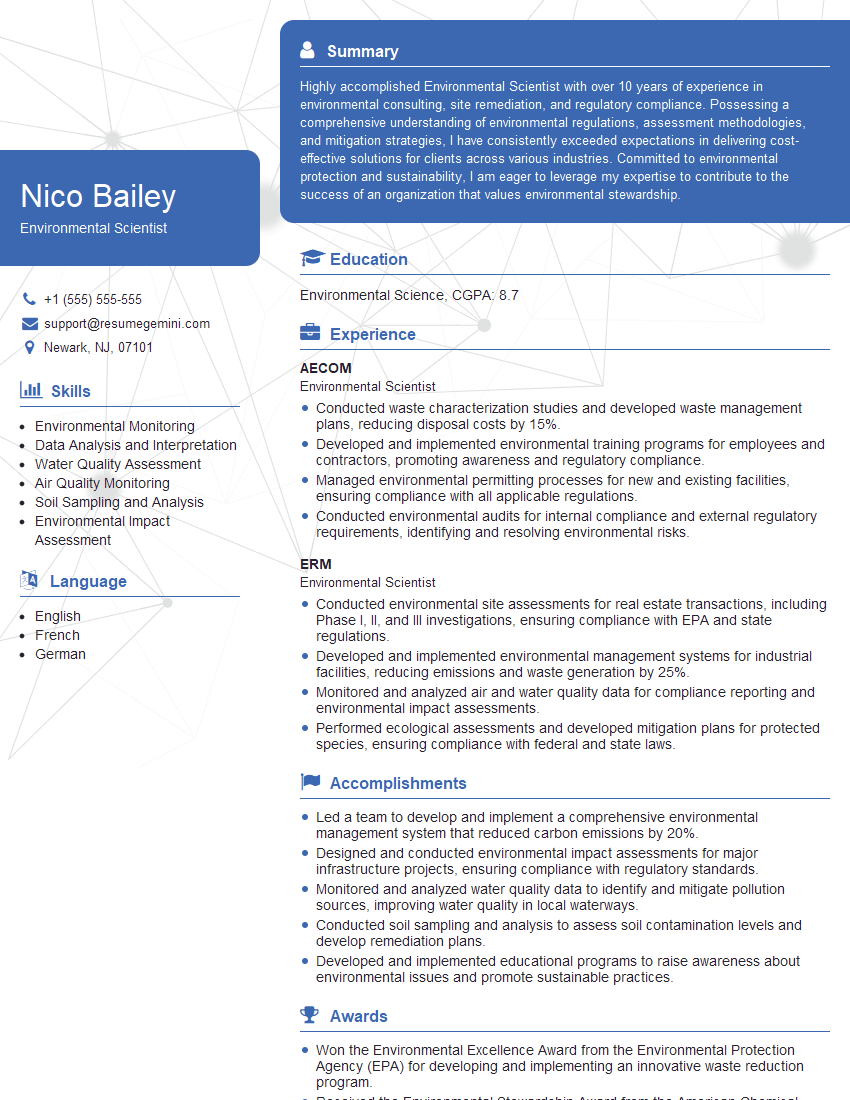
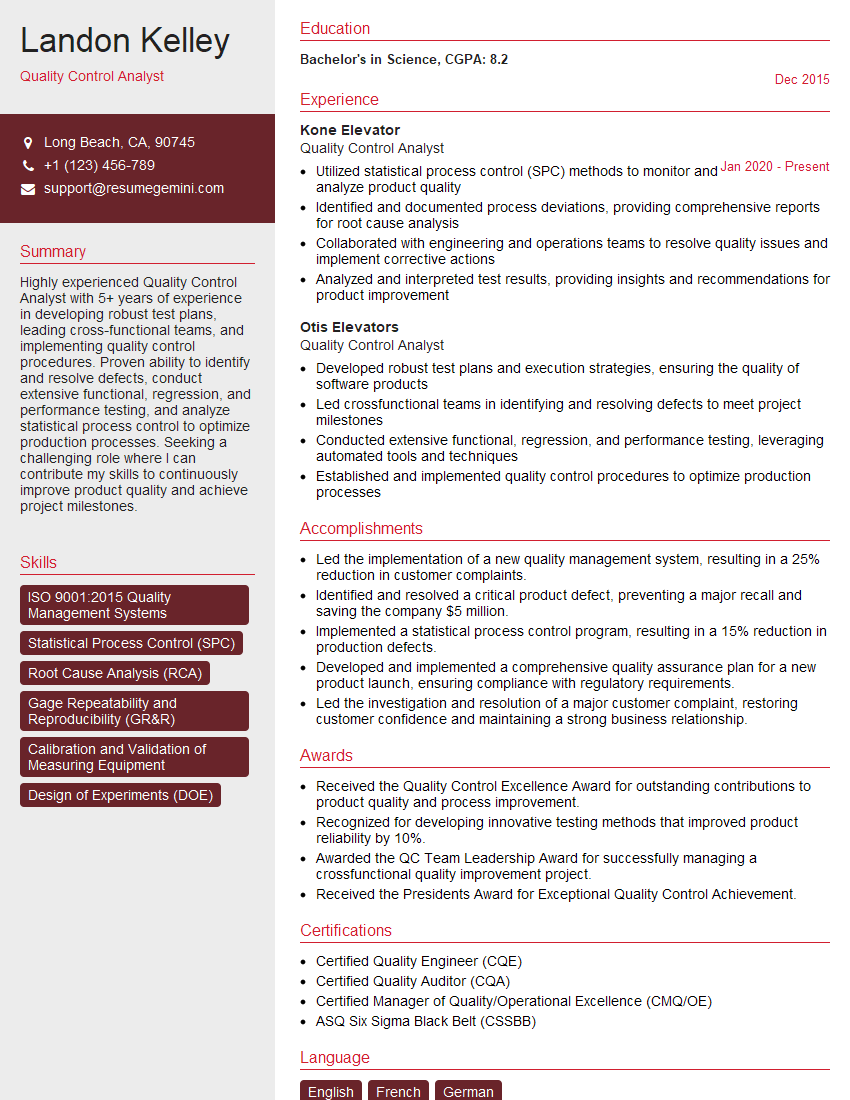
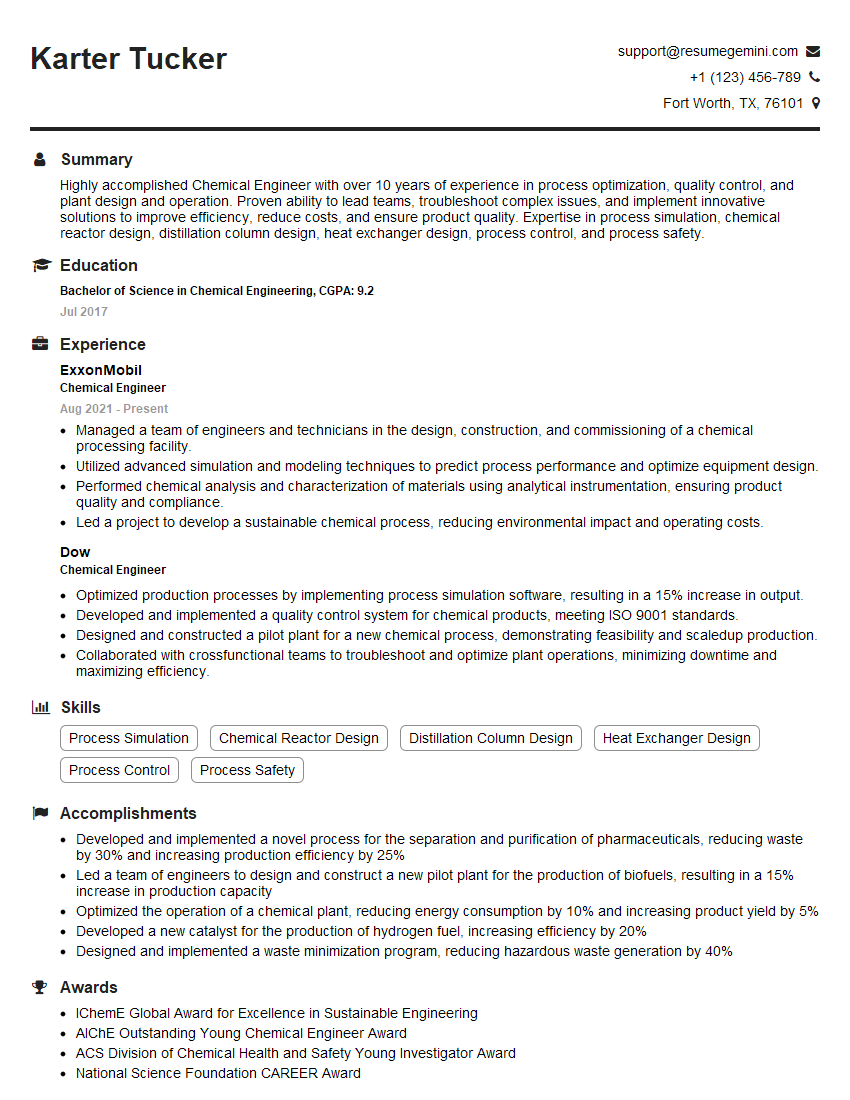
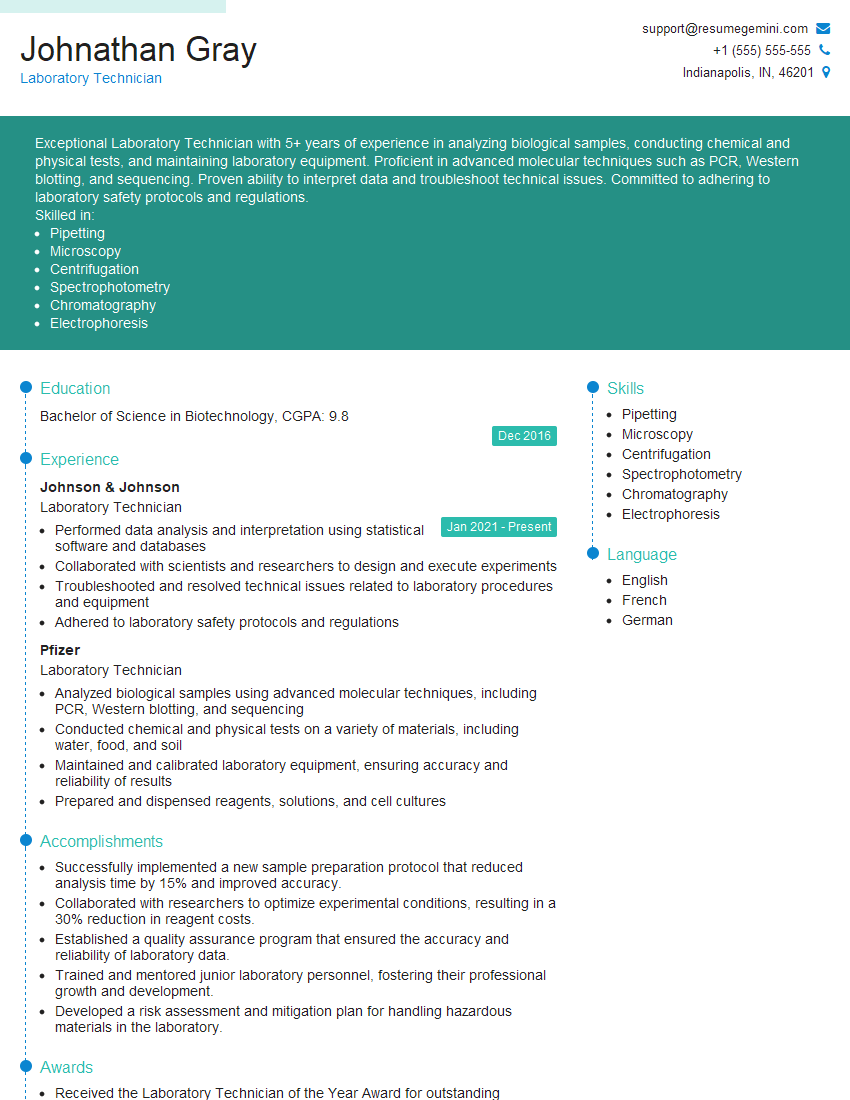
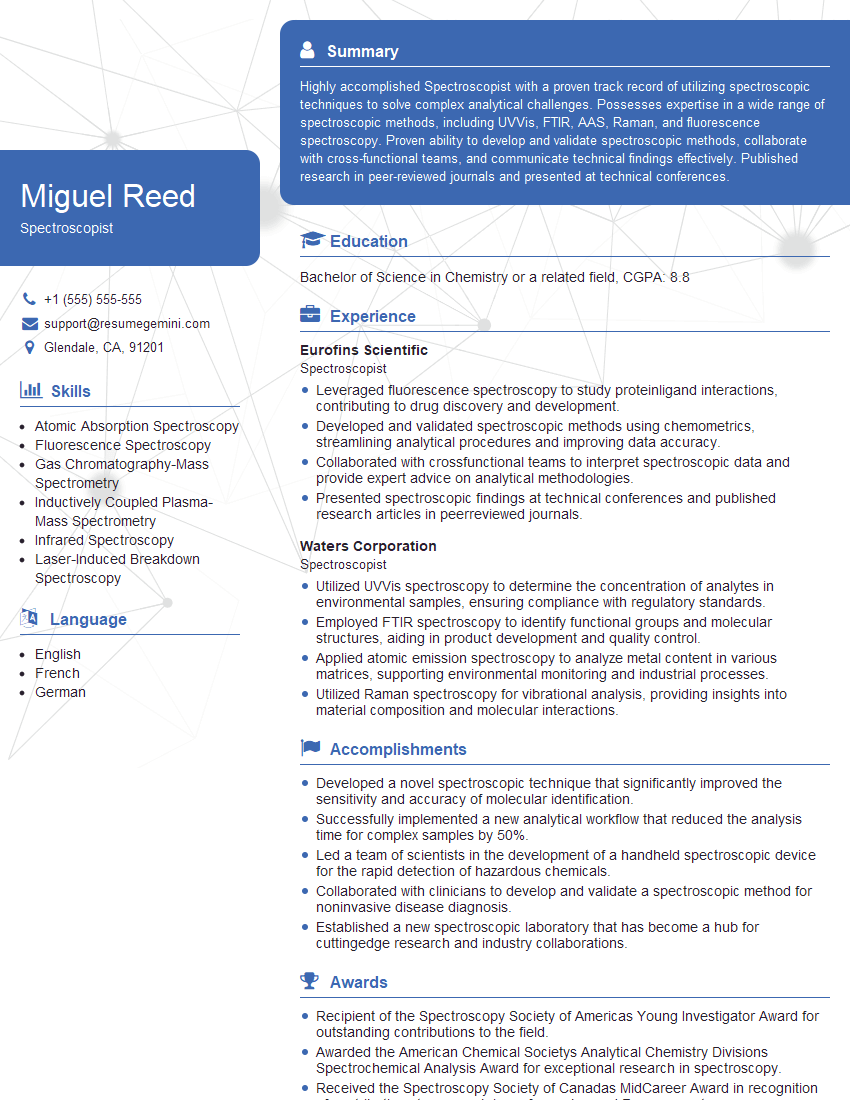
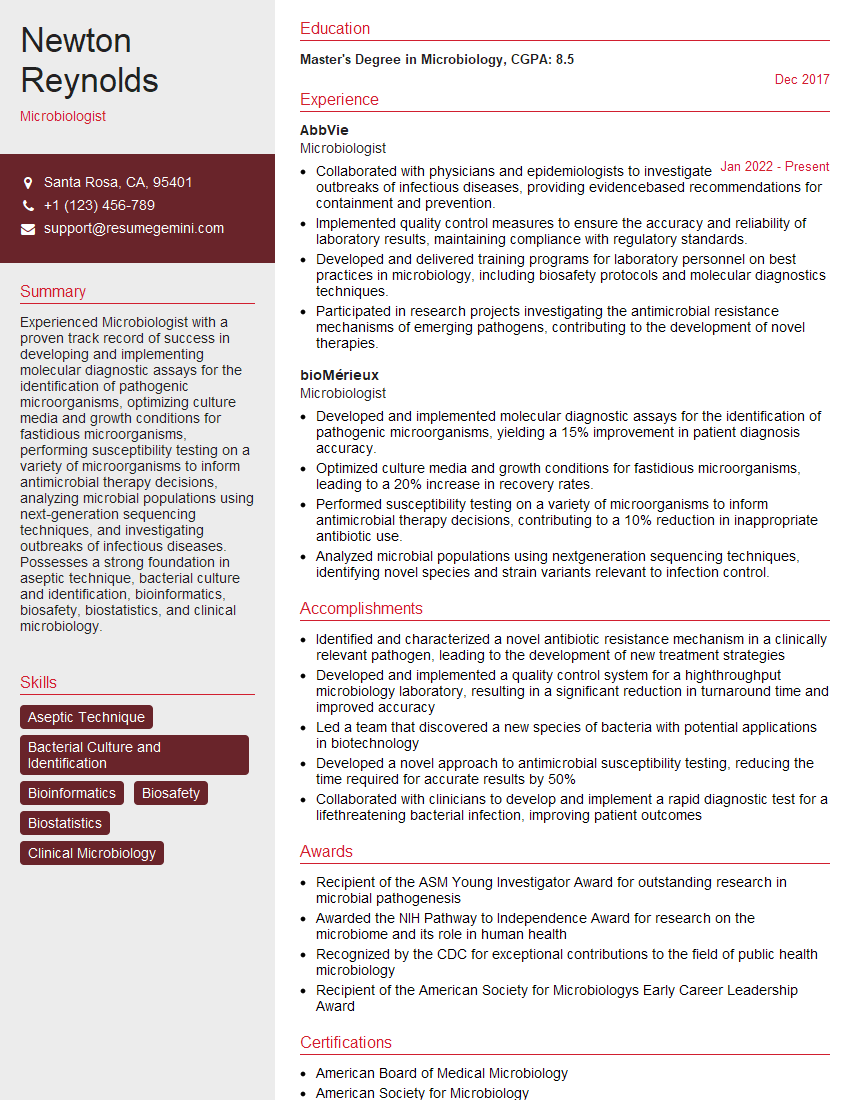
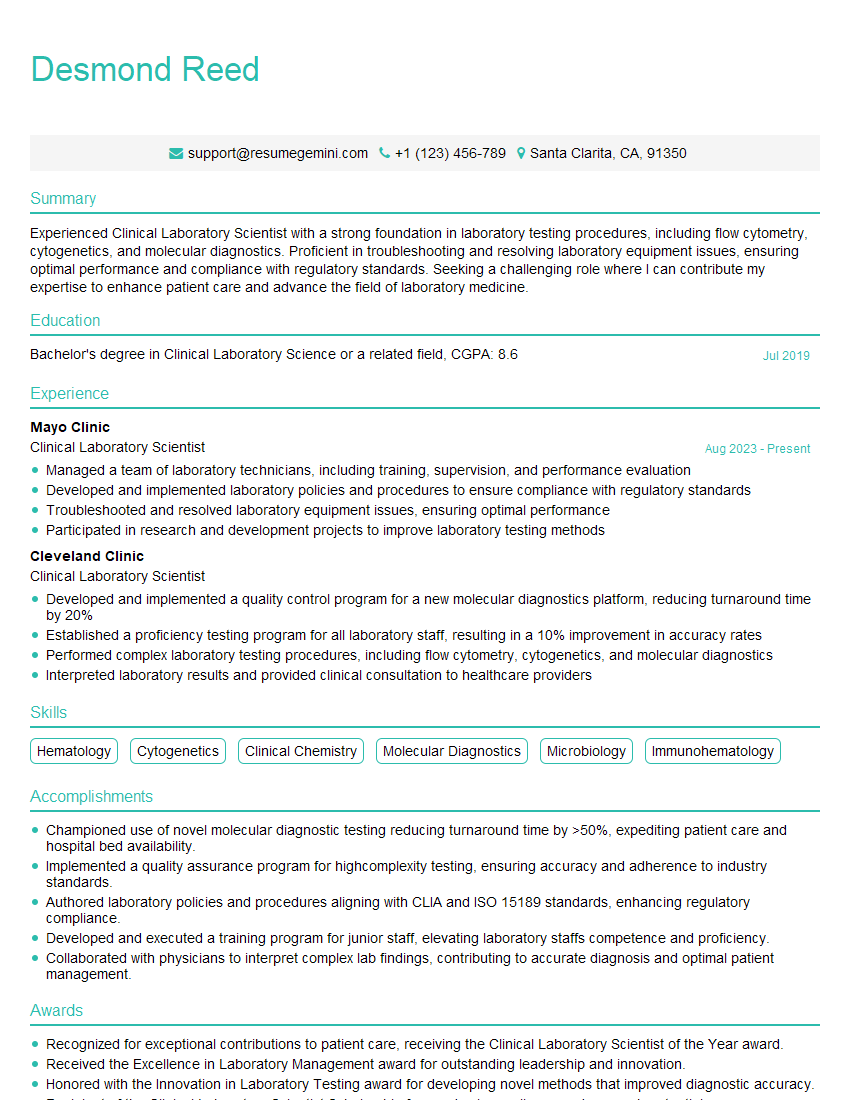
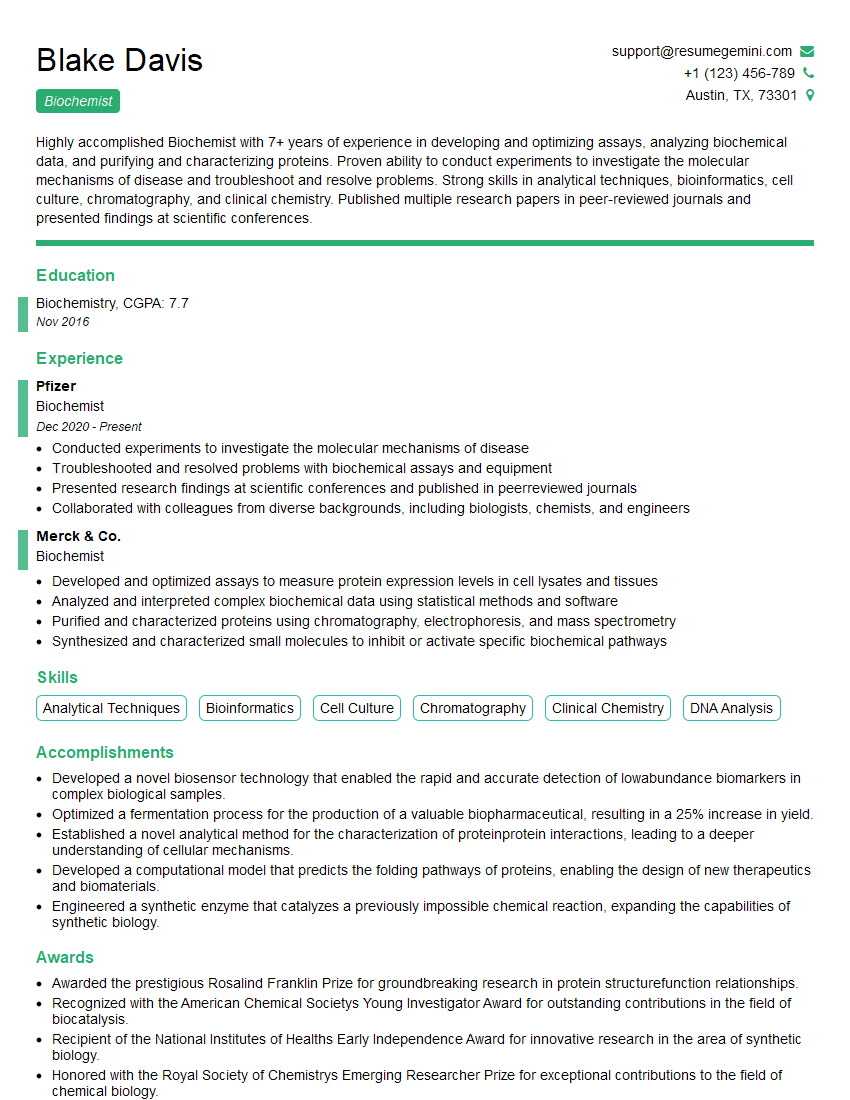
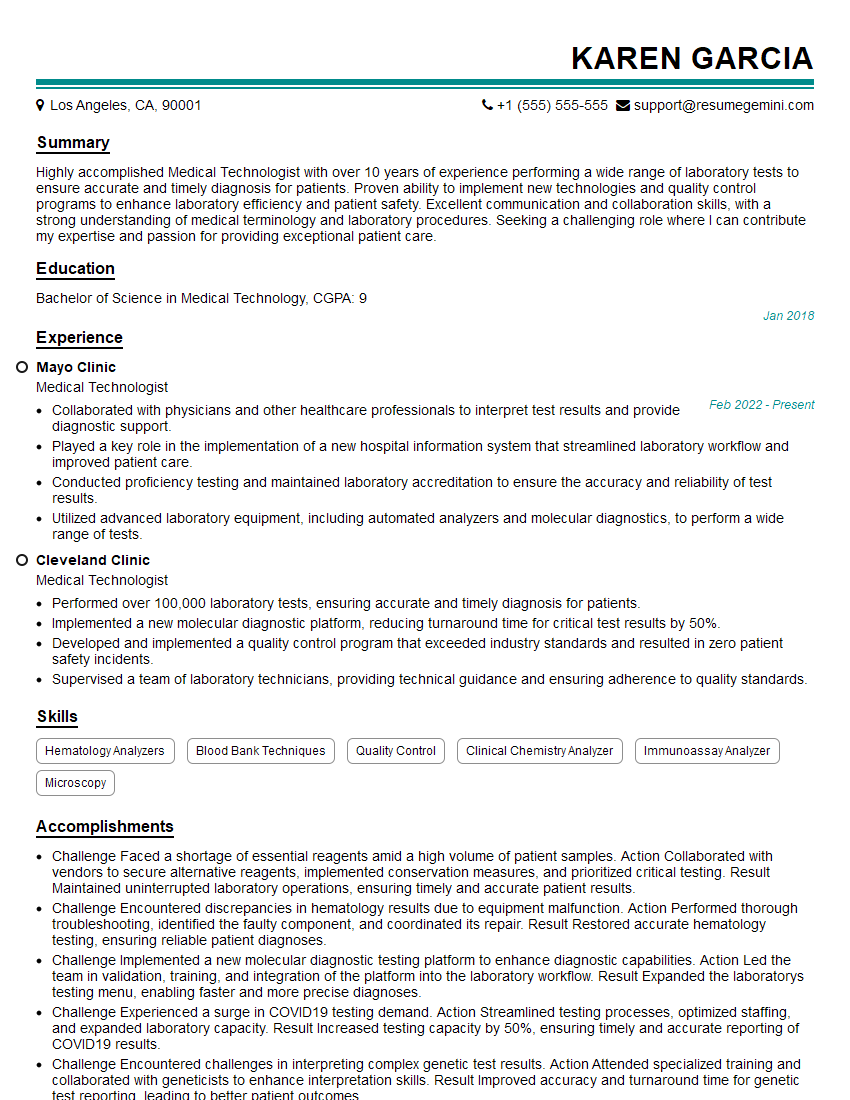
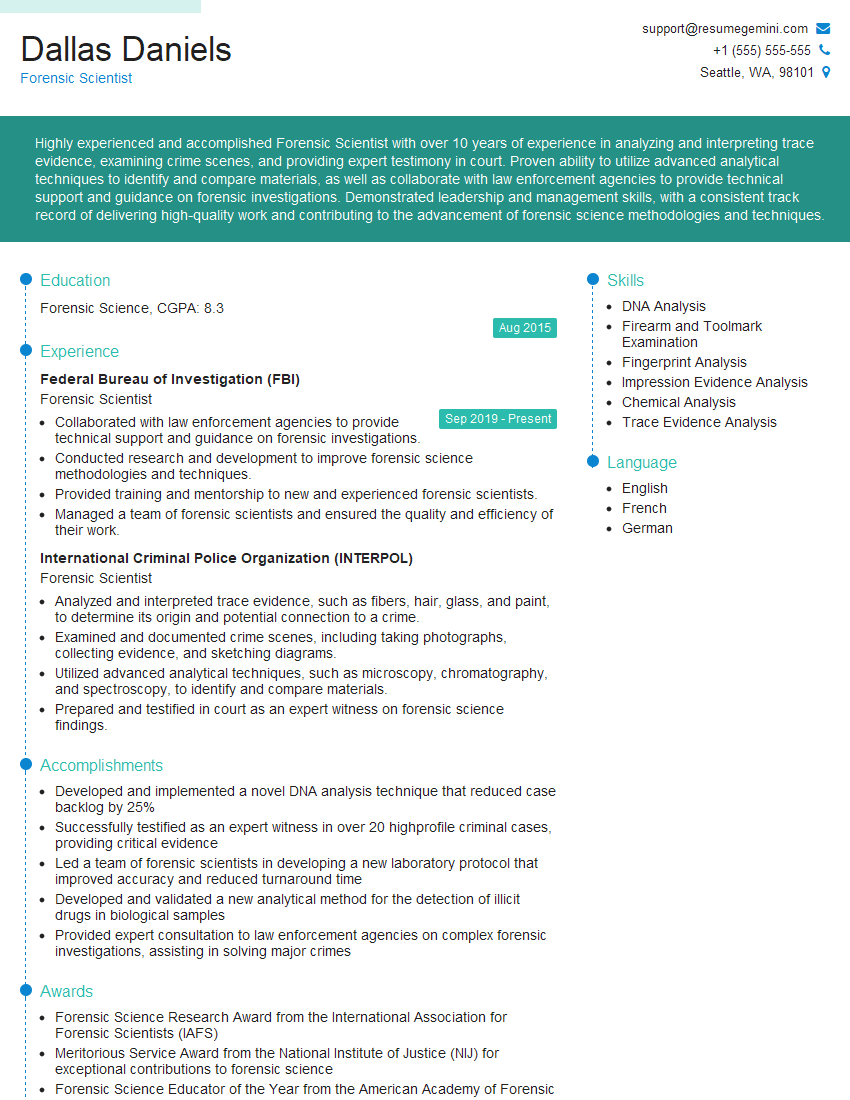
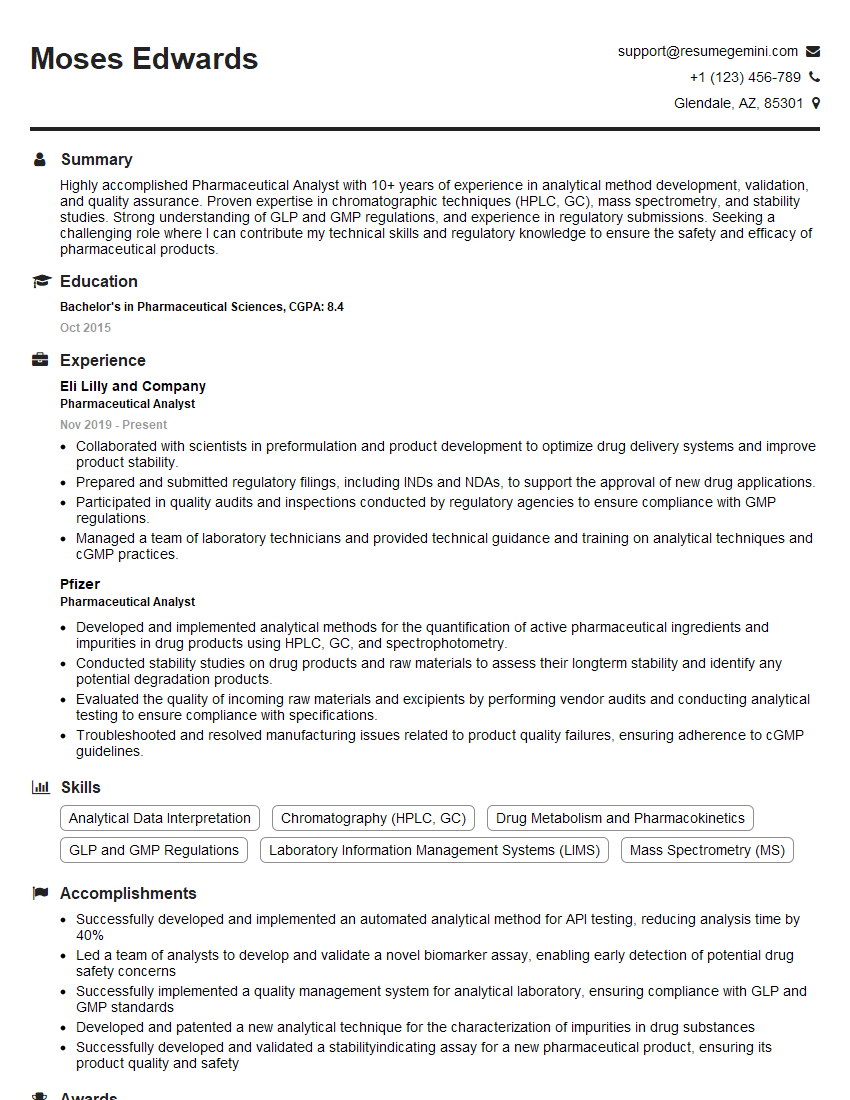
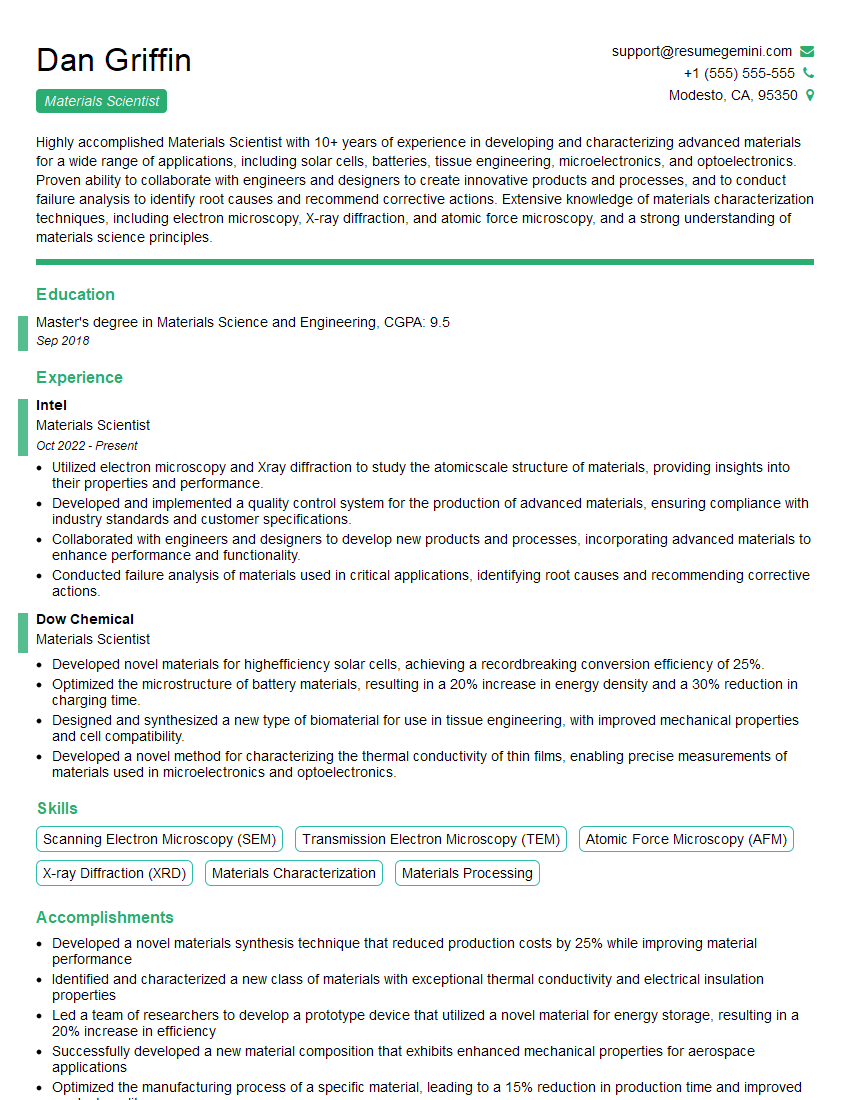
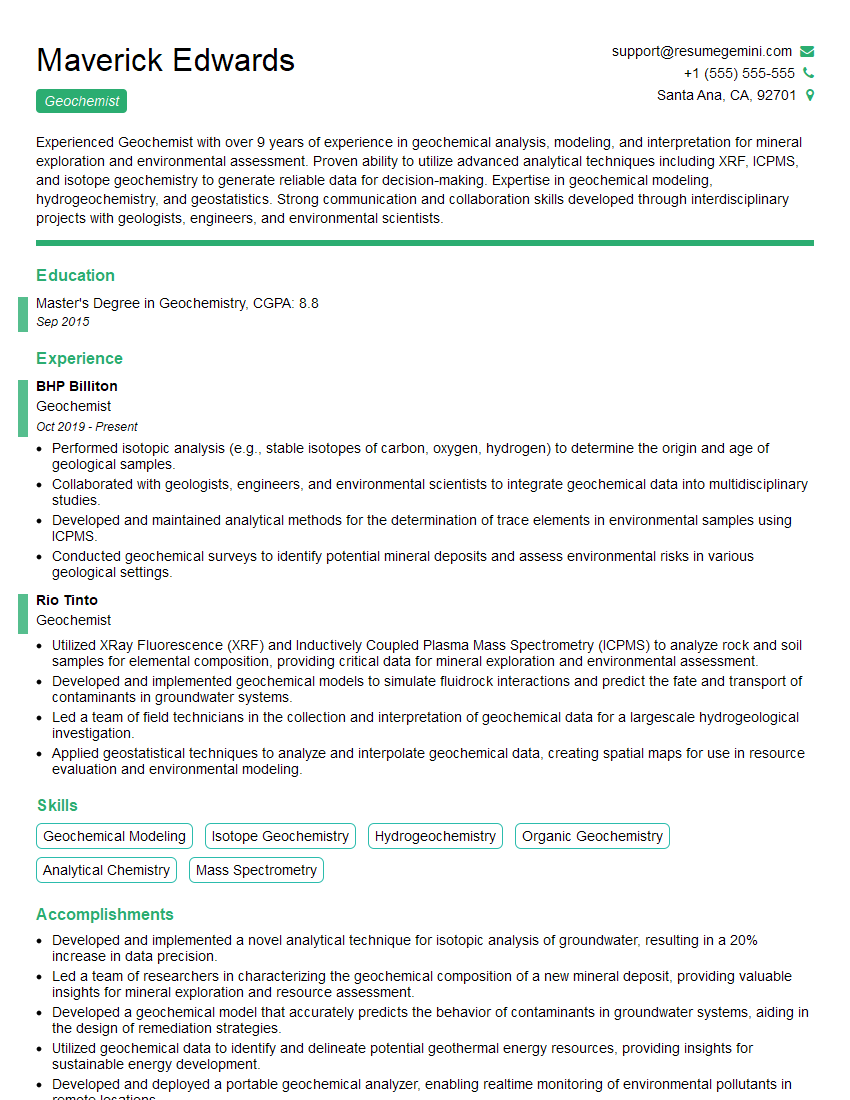
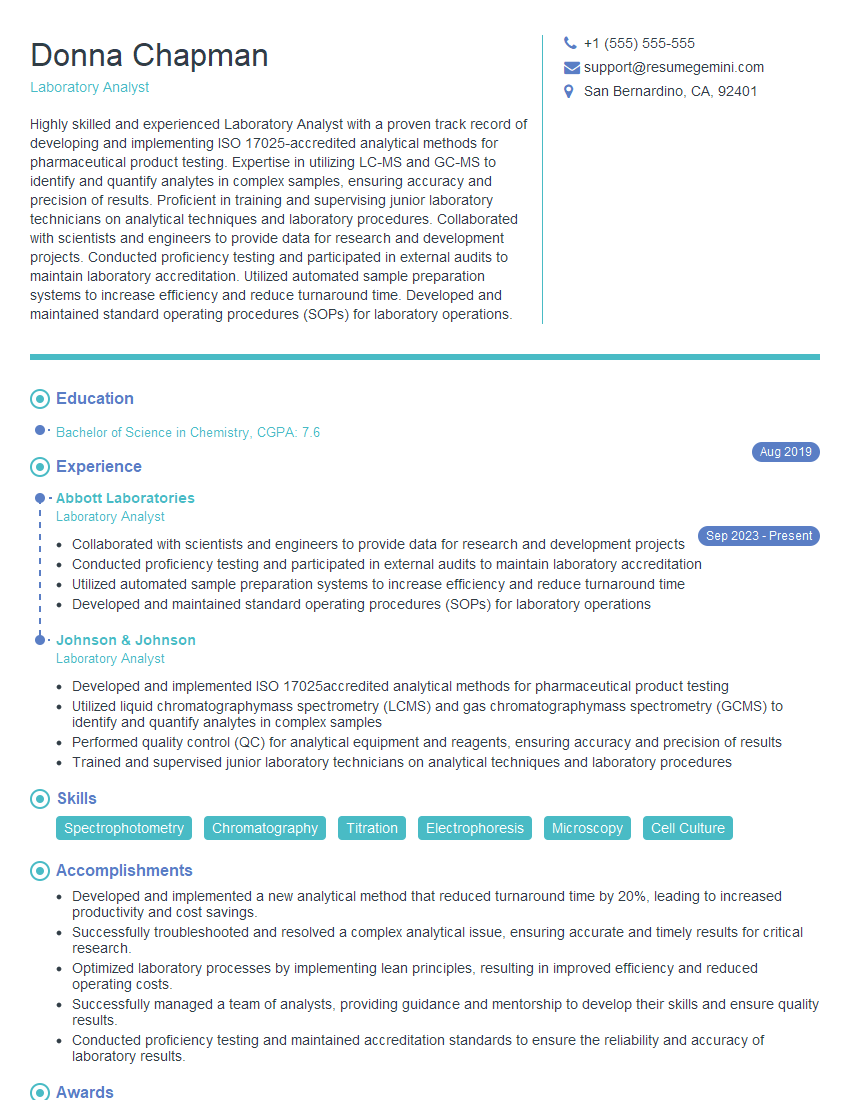
Mastering Laboratory Analysis and Interpretation is crucial for advancing your career in a highly technical and in-demand field. Strong analytical skills, coupled with a deep understanding of laboratory procedures, open doors to exciting opportunities and greater responsibility. To maximize your job prospects, create an ATS-friendly resume that highlights your qualifications effectively. ResumeGemini is a trusted resource to help you build a professional and impactful resume. Examples of resumes tailored to Laboratory Analysis and Interpretation are available to guide you. Invest time in crafting a compelling resume – it’s your first impression on potential employers.
Explore more articles
Users Rating of Our Blogs
Share Your Experience
We value your feedback! Please rate our content and share your thoughts (optional).
What Readers Say About Our Blog
Hello,
We found issues with your domain’s email setup that may be sending your messages to spam or blocking them completely. InboxShield Mini shows you how to fix it in minutes — no tech skills required.
Scan your domain now for details: https://inboxshield-mini.com/
— Adam @ InboxShield Mini
Reply STOP to unsubscribe
Hi, are you owner of interviewgemini.com? What if I told you I could help you find extra time in your schedule, reconnect with leads you didn’t even realize you missed, and bring in more “I want to work with you” conversations, without increasing your ad spend or hiring a full-time employee?
All with a flexible, budget-friendly service that could easily pay for itself. Sounds good?
Would it be nice to jump on a quick 10-minute call so I can show you exactly how we make this work?
Best,
Hapei
Marketing Director
Hey, I know you’re the owner of interviewgemini.com. I’ll be quick.
Fundraising for your business is tough and time-consuming. We make it easier by guaranteeing two private investor meetings each month, for six months. No demos, no pitch events – just direct introductions to active investors matched to your startup.
If youR17;re raising, this could help you build real momentum. Want me to send more info?
Hi, I represent an SEO company that specialises in getting you AI citations and higher rankings on Google. I’d like to offer you a 100% free SEO audit for your website. Would you be interested?
Hi, I represent an SEO company that specialises in getting you AI citations and higher rankings on Google. I’d like to offer you a 100% free SEO audit for your website. Would you be interested?
good
