The thought of an interview can be nerve-wracking, but the right preparation can make all the difference. Explore this comprehensive guide to Transportation Impact Studies interview questions and gain the confidence you need to showcase your abilities and secure the role.
Questions Asked in Transportation Impact Studies Interview
Q 1. Explain the difference between a Level of Service (LOS) analysis and a Transportation Impact Study (TIS).
While both Level of Service (LOS) analysis and Transportation Impact Studies (TIS) assess the performance of transportation networks, they differ significantly in scope and purpose. LOS analysis focuses on a specific roadway segment or intersection, evaluating its operational efficiency based on metrics like speed, density, and delay at a given time. Think of it like checking the ‘health’ of a single road. It provides a snapshot of current conditions and often uses standards set by agencies like the Highway Capacity Manual (HCM).
A TIS, on the other hand, takes a much broader perspective. It evaluates the overall impact of a development project (or multiple projects) on the surrounding transportation network. This involves analyzing changes in traffic volumes, travel times, delays, and other performance measures across a larger geographic area, potentially encompassing multiple roadway segments, intersections, and even different modes of transportation. It’s like taking an X-ray of the entire transportation system to see how the new development might affect it.
For example, an LOS analysis might show that an intersection is operating at a Level of Service F (unacceptable) during the peak hour. A TIS would go further, examining how a new shopping mall near that intersection would worsen existing congestion, potentially impacting surrounding roads and necessitating mitigation strategies.
Q 2. Describe the various methodologies used in Transportation Impact Studies.
Transportation Impact Studies employ various methodologies, often tailored to the specific project and available data. Common approaches include:
- Trip Generation Models: These models estimate the number of trips generated by a new development, considering factors like land use, population density, and employment. They often utilize regression analysis based on historical data.
- Trip Distribution Models: These models predict the distribution of trips generated from the development to various destinations within the study area, considering factors like distance, travel time, and land use characteristics. Gravity models and intervening opportunities models are frequently used.
- Modal Split Models: These models estimate the proportion of trips made by different modes of transportation (car, transit, bicycle, walking), taking into account factors like mode availability, travel time, and cost.
- Traffic Assignment Models: These models assign the predicted trips to the transportation network, determining the resulting traffic flows on each link and the resulting congestion levels. All-or-nothing assignment, incremental assignment, and user equilibrium assignment are common methods.
- Microsimulation Modeling: Software like VISSIM or Aimsun simulates individual vehicle movements, providing detailed information on traffic flow, queue lengths, and delays. This offers a more realistic representation of traffic behavior than macroscopic models.
The choice of methodology depends on factors such as project size, available data, budget, and desired level of detail.
Q 3. How do you assess the cumulative impact of multiple development projects on a transportation network?
Assessing the cumulative impact of multiple development projects requires a holistic approach. A simple sum of individual project impacts is often inadequate because interactions between projects can significantly alter the overall impact. Imagine two small developments, each having a negligible impact on traffic individually, but together causing major congestion. Therefore, a cumulative impact assessment should:
- Consider all projects simultaneously: Instead of analyzing projects individually, the TIS should model all projects simultaneously within a single model, reflecting their combined effect on traffic.
- Utilize a regional model: A larger-scale transportation model encompassing the entire area is generally necessary to accurately capture the interactions and ripple effects.
- Employ scenario planning: Different scenarios, considering various project phasing and mitigation measures, should be modeled to assess the range of potential impacts and guide decision-making.
- Account for induced demand: Increased capacity can lead to increased travel demand. This effect (induced demand) should be incorporated into the analysis.
For instance, if several housing developments are planned for an area simultaneously, a cumulative TIS is crucial to predict congestion levels, and to potentially identify the need for road widening or transit improvements to mitigate future traffic problems.
Q 4. What are the key performance indicators (KPIs) used to evaluate the effectiveness of transportation improvements?
Key Performance Indicators (KPIs) in evaluating transportation improvements vary depending on project goals, but commonly include:
- Vehicle-Miles Traveled (VMT): Changes in total distance traveled by vehicles, which reflects efficiency and environmental impacts.
- Travel Time: Reduction in average travel times, indicating improved mobility and accessibility.
- Vehicle Hours of Delay: Reduction in total time spent idling in traffic, showing improvement in traffic flow.
- Level of Service (LOS): Improvement in LOS ratings on critical roadway segments and intersections.
- Transit Ridership: Increase in public transit usage, reflecting the success of transit-oriented development or improvements.
- Crash Rates: Reduction in accident frequency and severity, reflecting enhanced safety.
- Emissions: Reduction in greenhouse gas emissions, particularly CO2, showcasing environmental benefits.
- Accessibility: Improvements in accessibility for vulnerable populations, such as pedestrians, bicyclists, and transit users.
These KPIs are used to measure the effectiveness of transportation improvements and demonstrate the return on investment.
Q 5. Explain the significance of trip generation, distribution, and assignment models in TIS.
Trip generation, distribution, and assignment models are fundamental components of TIS. They form the core of traffic forecasting and prediction.
- Trip Generation: This step estimates the number of trips originating from and destined for the development. Models use characteristics of the development (land use, employment, population) and potentially socioeconomic data to estimate trip generation rates. For example, a large shopping mall will generate significantly more trips than a residential area.
- Trip Distribution: This determines where trips originating from the development are going. Gravity models often simulate this, using distance and attractiveness of destinations to determine probabilities of travel. For example, trips from the shopping mall are more likely to go to surrounding residential areas and less likely to go to distant locations.
- Trip Assignment: This step routes the trips on the network. Algorithms assign trips to specific roads and links based on factors like shortest path or user equilibrium (drivers choosing routes to minimize their individual travel time). This allows for estimating traffic volumes and congestion levels on each road segment.
The interplay of these three steps provides a comprehensive prediction of traffic flow changes due to a development.
Q 6. How do you incorporate public transit and alternative transportation modes into your TIS analysis?
Incorporating public transit and alternative transportation modes is crucial for a comprehensive TIS. Ignoring these modes leads to inaccurate and incomplete analysis. Several methods exist to account for these:
- Transit Network Modeling: Integrate transit networks into the overall transportation model. This allows assessing transit ridership changes and the impact of the development on transit service.
- Multimodal Assignment: Use multimodal assignment algorithms that consider various travel modes, including walking, cycling, and transit, along with driving. This provides a more realistic picture of how people will travel.
- Accessibility Analysis: Assess accessibility to various destinations by different modes of transportation, accounting for walk times, transit transfers, and wait times.
- Demand Management Strategies: Evaluate the impact of demand management strategies, such as transit incentives or bicycle infrastructure improvements, on modal split and overall traffic.
For example, a TIS for a new transit station would need to model the increased ridership and the impact on surrounding roads and parking lots. Similarly, incorporating bicycle infrastructure into a TIS for a new residential area would evaluate its potential to reduce car trips and improve sustainability.
Q 7. Describe your experience with different transportation modeling software (e.g., VISSIM, TransCAD).
I have extensive experience with various transportation modeling software packages, including VISSIM, TransCAD, and Cube Voyager. My experience spans both microscopic and macroscopic modeling approaches, depending on project requirements.
VISSIM: I’ve used VISSIM for detailed microsimulation modeling, particularly for intersection analysis and evaluating the effectiveness of traffic signal timing optimization. For example, I’ve used VISSIM to simulate pedestrian and bicycle interactions with vehicles in complex urban environments. Its strengths lie in its ability to provide very detailed outputs on traffic flow, queue lengths, delays and safety metrics.
TransCAD: TransCAD has been instrumental in my work for large-scale network modeling, trip distribution, and assignment. Its strengths are in its capabilities for handling large datasets and complex transportation networks. I’ve used TransCAD to model regional transportation networks, forecasting traffic under various scenarios, and assessing the cumulative impacts of multiple development projects.
Cube Voyager: This software has been used for visualizing and analyzing traffic data. It’s especially useful for data preprocessing, exploratory analysis, and creating compelling visualizations for presentation to clients and stakeholders.
My proficiency in these software packages allows me to select the most appropriate tool for the task at hand, ensuring accurate and reliable results.
Q 8. How do you handle uncertainty and variability in transportation demand forecasting?
Uncertainty and variability are inherent in transportation demand forecasting. We can’t predict the future with perfect accuracy, but we can employ techniques to manage and quantify the risks associated with these uncertainties. This involves using probabilistic models rather than relying on single-point estimates.
Scenario Planning: We develop multiple future scenarios – optimistic, pessimistic, and most likely – to explore the range of potential outcomes. For example, we might model different levels of economic growth or changes in fuel prices and their impact on travel demand.
Monte Carlo Simulation: This powerful technique uses random sampling to simulate the variability in input parameters (like population growth, trip generation rates, or mode share). By running thousands of simulations, we obtain a probability distribution of forecast outcomes, rather than a single prediction. This gives us a better understanding of the range of possible future demands and the associated level of uncertainty.
Bayesian Methods: These methods allow us to incorporate prior knowledge and expert judgment into the forecasting process. This is particularly useful when historical data is limited or unreliable. For example, if we are forecasting demand for a new transit line, we can incorporate data from similar projects in other cities.
Sensitivity Analysis: This helps us identify which input parameters have the greatest influence on the forecast. By focusing on these key variables, we can improve data quality and reduce forecast uncertainty. For example, a sensitivity analysis might reveal that land use changes are the most significant driver of traffic volume, so we’d prioritize obtaining accurate projections of future land use.
By combining these approaches, we produce more robust and informative forecasts that acknowledge and quantify inherent uncertainty, which is crucial for informed decision-making in transportation planning.
Q 9. Explain the process of conducting a traffic capacity analysis as part of a TIS.
Traffic capacity analysis is a critical component of a Transportation Impact Study (TIS). It determines the ability of a road network or intersection to handle a given traffic volume while maintaining acceptable levels of service (LOS). The process typically involves these steps:
Defining the Study Area and Scope: This includes identifying the specific roadways and intersections to be analyzed and defining the analysis period (e.g., peak hour, design hour).
Traffic Data Collection and Processing: This involves gathering traffic data through various methods like traffic counts, turning movement counts, and origin-destination studies. The data is then processed and used to develop traffic models.
Traffic Modeling: We use traffic simulation software (e.g., VISSIM, CORSIM) or analytical models to simulate traffic flow under different conditions, including existing and projected traffic volumes. These models consider factors like vehicle types, driver behavior, and signal timing.
Level of Service (LOS) Analysis: Based on the simulation results, we evaluate the LOS at each segment of the roadway and intersection. LOS is a qualitative measure of the operational effectiveness of a roadway, typically ranging from A (free-flow conditions) to F (extremely congested conditions). The Highway Capacity Manual (HCM) provides guidelines and methodologies for LOS evaluation.
Capacity Improvement Recommendations: If the analysis reveals capacity deficiencies (LOS F or E), we recommend improvements such as adding lanes, improving signal timing, implementing traffic management strategies, or constructing new roads. These recommendations are based on balancing cost-effectiveness and performance improvements.
Imagine a new shopping mall opening near a busy intersection. A traffic capacity analysis would predict the increase in traffic volume and determine whether the existing intersection can handle the extra traffic without causing significant delays. If not, the analysis would provide recommendations, such as adding turning lanes or installing a new traffic signal to ensure an acceptable LOS.
Q 10. How do you incorporate environmental considerations into your Transportation Impact Studies?
Environmental considerations are paramount in modern TIS. We integrate them by assessing the potential impacts of transportation projects on air and noise pollution, greenhouse gas emissions, water quality, and habitat disruption. This involves:
Air Quality Modeling: We use specialized software to predict changes in air pollutant concentrations (e.g., NOx, PM2.5, CO) resulting from increased traffic or changes in vehicle emissions. This considers factors like vehicle fleet composition and traffic speed.
Greenhouse Gas Emissions Assessment: We quantify the project’s contribution to greenhouse gas emissions using established methodologies, considering both direct emissions from vehicles and indirect emissions from construction. This often involves using carbon accounting frameworks.
Noise Impact Assessment: We use noise prediction models to estimate changes in noise levels near roadways and residential areas. This helps identify areas where noise barriers or other mitigation measures are needed to minimize impacts on communities.
Water Quality Assessment: This evaluates potential impacts of construction activities or stormwater runoff on nearby water bodies. This might involve evaluating the potential for sediment pollution or erosion.
Habitat Assessment: For projects that involve land clearing or habitat fragmentation, we conduct ecological surveys and assess potential impacts on biodiversity. Mitigation strategies like habitat restoration or wildlife crossing structures are often proposed.
For instance, a highway expansion might reduce travel times but increase air pollution and noise levels. A robust TIS would quantify these trade-offs and explore mitigation strategies such as adding bike lanes to promote cycling, using quieter pavement, or planting trees to buffer noise.
Q 11. How do you address potential biases in data collection for TIS?
Data collection for TIS is prone to various biases that can affect the reliability and validity of findings. Addressing these biases requires a rigorous approach:
Sampling Bias: If the data isn’t representative of the entire population, it leads to inaccurate conclusions. For instance, relying solely on weekday traffic counts would underestimate weekend traffic. Addressing this involves using statistically sound sampling techniques and ensuring a sufficient sample size.
Measurement Bias: Inaccurate data collection methods can lead to systematic errors. For instance, improperly calibrated traffic counters or inconsistent data recording protocols can produce flawed results. We use quality control procedures and validation steps to minimize measurement error.
Selection Bias: Selecting data based on pre-conceived notions can skew the results. For example, choosing only data from specific locations that support a particular outcome should be avoided. We use objective criteria for data selection and ensure transparency in our methodology.
Confirmation Bias: Interpreting data to confirm pre-existing beliefs is another potential pitfall. We use rigorous statistical analysis to avoid this bias, employing objective measures and presenting a balanced view of the findings.
To minimize bias, we employ multiple data sources (traffic counts, surveys, GPS data), validate the data against independent sources, and use statistical methods to control for confounding factors.
Q 12. Describe your experience working with stakeholders and presenting TIS findings.
Effective stakeholder engagement is crucial for the success of a TIS. My experience includes:
Early and Frequent Communication: I proactively engage with stakeholders throughout the TIS process, providing regular updates on progress and soliciting feedback.
Transparent and Accessible Communication: I use clear and concise language to explain complex technical information, ensuring accessibility for a wide range of audiences. I utilize various communication channels such as public meetings, workshops, and online platforms.
Incorporating Stakeholder Input: I actively seek input from stakeholders and incorporate their concerns and perspectives into the study design and analysis. This ensures the TIS reflects the community’s needs and priorities.
Presenting Findings Effectively: I present findings using visually appealing and easy-to-understand formats, such as maps, charts, and infographics. I also tailor my presentations to specific stakeholder groups to ensure effective communication.
Addressing Concerns and Questions: I address stakeholder concerns and questions openly and honestly, providing clear and well-supported answers. I build trust by acknowledging limitations and uncertainties in the study.
For example, during a recent TIS for a new highway project, I facilitated several public forums, conducted targeted surveys, and presented findings to local residents, businesses, and government officials. This collaborative approach ensured the project’s design reflected the community’s concerns and priorities.
Q 13. What are some common mitigation measures proposed to address negative transportation impacts?
Mitigation measures aim to reduce or eliminate negative transportation impacts. Common strategies include:
Improved Public Transportation: Increasing frequency, expanding service areas, and improving the quality of public transit can reduce reliance on private vehicles and alleviate congestion.
Active Transportation Infrastructure: Building bike lanes, pedestrian walkways, and creating safe cycling and walking environments encourages non-motorized transport and improves public health.
Traffic Management Strategies: Measures like adaptive traffic signals, ramp metering, and traffic calming can optimize traffic flow and improve safety.
Transit-Oriented Development (TOD): Locating housing, employment, and services near transit stations reduces the need for car travel.
Congestion Pricing: Charging fees for driving in congested areas can incentivize people to use alternative modes of transport or travel during off-peak hours.
Roadway Design Improvements: Adding lanes, improving intersections, and constructing new roads can increase capacity and reduce congestion.
Noise Barriers and Mitigation: Constructing noise barriers, using quieter pavement surfaces, and implementing speed limits can minimize noise pollution from roadways.
Air Quality Mitigation: Implementing cleaner fuel standards, promoting electric vehicles, and adopting traffic management strategies that reduce idling times can help improve air quality.
The choice of mitigation measures depends on the specific context of the project and the nature of the negative impacts. A holistic approach that integrates multiple strategies is often most effective.
Q 14. How do you quantify the economic impacts of transportation improvements or changes?
Quantifying the economic impacts of transportation improvements or changes involves a multifaceted approach. We use various techniques to capture both direct and indirect effects:
Cost-Benefit Analysis (CBA): This widely used method compares the total costs of a project (construction, maintenance, operation) with its total benefits (reduced travel time, improved safety, increased economic activity). Benefits are often expressed in monetary terms (e.g., valuing time savings, accident reductions). The benefit-cost ratio (BCR) is a key output of CBA.
Economic Impact Analysis: This assesses the broader economic effects of a transportation project, considering factors like job creation, changes in business activity, and induced economic growth. Input-output models or computable general equilibrium models are often employed.
Travel Time Savings: Reduced travel times translate into significant economic benefits, as they improve productivity and reduce transportation costs for individuals and businesses. We estimate these savings using travel time estimates from traffic models and assigning a value to time.
Accident Reduction Benefits: Fewer accidents lead to lower healthcare costs, reduced property damage, and fewer lost workdays. We estimate these benefits using accident reduction rates and assigning a monetary value to accident costs.
Property Value Impacts: Transportation improvements can affect property values in adjacent areas. For example, improved accessibility can increase property values, while increased noise or pollution can decrease them. Hedonic pricing models are used to assess these impacts.
For example, a new highway might cost millions to build, but reduce congestion, saving commuters time and money. An economic impact analysis would quantify the combined monetary benefits of reduced travel time, accident reductions, and economic growth stimulated by improved accessibility. This information can be crucial in justifying the project’s investment.
Q 15. Describe your experience with Geographic Information Systems (GIS) in the context of TIS.
Geographic Information Systems (GIS) are indispensable tools in Transportation Impact Studies (TIS). They allow us to visualize, analyze, and manage geographically referenced data, providing a crucial foundation for understanding the spatial implications of transportation projects. My experience encompasses using GIS software like ArcGIS and QGIS to perform a variety of tasks within TIS.
- Network Analysis: I use GIS to model transportation networks, identifying optimal routes, assessing network capacity, and analyzing travel times. For instance, in a recent project assessing the impact of a new highway, GIS helped us model traffic flow and identify potential congestion points.
- Spatial Data Integration: I routinely integrate various datasets, including road networks, land use maps, demographics, and accident data, into a GIS environment. This allows for comprehensive analysis of how transportation projects interact with the surrounding environment and population.
- Visualization and Mapping: GIS enables the creation of compelling maps and visualizations to effectively communicate complex TIS findings to stakeholders. This includes creating maps showing changes in travel times, accessibility improvements, or areas impacted by increased traffic.
- Spatial Statistics: I leverage GIS capabilities for spatial statistical analysis to identify patterns and relationships between transportation infrastructure and other spatial phenomena, such as crime rates or property values near major roadways.
For example, in one study, we used GIS to overlay proposed light rail lines with census data to identify areas with increased accessibility to jobs and services following the rail line’s completion. The visual representation significantly improved stakeholder understanding and project acceptance.
Career Expert Tips:
- Ace those interviews! Prepare effectively by reviewing the Top 50 Most Common Interview Questions on ResumeGemini.
- Navigate your job search with confidence! Explore a wide range of Career Tips on ResumeGemini. Learn about common challenges and recommendations to overcome them.
- Craft the perfect resume! Master the Art of Resume Writing with ResumeGemini’s guide. Showcase your unique qualifications and achievements effectively.
- Don’t miss out on holiday savings! Build your dream resume with ResumeGemini’s ATS optimized templates.
Q 16. How do you evaluate the safety impacts of transportation projects or developments?
Evaluating the safety impacts of transportation projects requires a multi-faceted approach. We don’t just look at raw accident numbers; we delve into the underlying causes and potential for future incidents. My approach typically includes:
- Accident Data Analysis: We analyze historical accident data from sources like state Departments of Transportation (DOTs) to identify accident hotspots and trends. This often involves using GIS to spatially represent accident locations and pinpoint areas requiring attention.
- Safety Performance Functions (SPFs): We employ SPFs, statistical models that predict accident frequencies based on roadway geometric design and traffic characteristics. This helps anticipate potential safety impacts before a project is implemented. We can use these models to compare the predicted safety performance of the existing and proposed road systems.
- Microsimulation Modeling: Advanced simulation software can model individual vehicle movements, allowing us to assess safety impacts at a highly detailed level. For example, we can simulate pedestrian and bicycle movements to assess potential conflicts with vehicles at intersections.
- Traffic Calming Measures: We often evaluate the effectiveness of planned safety improvements like speed humps, roundabouts, or improved pedestrian crossings. The models we employ can accurately predict the potential accident reduction resulting from these traffic calming measures.
Imagine a highway widening project. While it might improve traffic flow, it could also increase speeds and lead to more severe accidents if safety measures aren’t implemented concurrently. We use our safety assessment methods to identify and mitigate such potential downsides.
Q 17. Explain the concept of accessibility and its relevance to TIS.
Accessibility in TIS refers to the ease with which individuals can reach desired destinations using available transportation modes. It’s a crucial aspect of evaluating a project’s overall societal impact, going beyond just travel times.
Relevance to TIS:
- Equity: Accessibility assessments reveal whether transportation improvements benefit all segments of the population equally. For example, a new highway might improve access for car owners but worsen accessibility for those relying on public transit or walking.
- Economic Development: Improved accessibility to jobs, education, and healthcare facilities stimulates economic growth and social well-being. A TIS might evaluate how a new transit line increases access to employment opportunities for residents in underserved areas.
- Social Inclusion: Accessibility is vital for fostering social inclusion and reducing social isolation. A study might investigate how improvements to pedestrian infrastructure enhance accessibility for the elderly or individuals with disabilities.
- Land Use Planning: Accessibility considerations guide land use decisions, ensuring that development patterns support efficient and equitable transportation systems.
Measuring accessibility involves using various indicators like travel times, distances, transit connectivity, and walking distances to key destinations. GIS plays a major role in calculating and visualizing these measures.
Q 18. How do you ensure the accuracy and reliability of data used in your TIS?
Data accuracy and reliability are paramount in TIS. Errors can lead to flawed conclusions and potentially costly mistakes in project design and implementation. My approach to ensuring data quality involves:
- Data Source Evaluation: We critically assess the reliability and credibility of all data sources, considering their methodology, accuracy, and potential biases. For instance, we would prefer traffic count data collected by professional agencies over citizen-reported data.
- Data Validation and Cleaning: Before analysis, we rigorously validate and clean the data to identify and correct errors, inconsistencies, and outliers. This might involve automated checks and manual review of data records.
- Data Consistency Checks: We compare data from multiple sources to ensure consistency and identify discrepancies that need investigation. For example, we might compare traffic volume data from different sensors or counting locations to ensure consistency.
- Sensitivity Analysis: We perform sensitivity analysis to assess how variations in input data affect the results of our models. This helps understand the uncertainty associated with our findings and increases confidence in their robustness.
A simple example: Using outdated road network data would lead to inaccurate travel time estimates in a TIS. By meticulously verifying our data sources and conducting thorough validation checks, we minimize these risks.
Q 19. What are the limitations of traditional transportation modeling techniques?
Traditional transportation modeling techniques, while valuable, have limitations:
- Simplified Representations of Reality: Traditional models often rely on aggregate data and simplified assumptions about driver behavior, leading to less accurate predictions compared to newer, more detailed models.
- Limited Consideration of Behavioral Factors: These models often lack the capability to fully incorporate the complex behavioral aspects of travel choices, such as route choice under uncertainty or the influence of real-time information.
- Difficulty Handling Large-Scale Networks: Traditional methods can become computationally expensive and slow for large and complex transportation networks.
- Static Nature: Many traditional models represent a snapshot in time and don’t capture the dynamic nature of traffic flow, changing demand, and real-time events.
For example, a four-step model might struggle to accurately predict travel patterns under an unexpected traffic incident, while microsimulation can model the congestion in much greater detail. We must acknowledge these limitations and choose the most appropriate modeling approach depending on the project scope and available resources.
Q 20. How do you incorporate land use data into your transportation models?
Land use data is crucial for accurate transportation modeling because it dictates where people live, work, and engage in other activities, directly influencing travel demand. I incorporate land use data in several ways:
- Trip Generation Models: Land use data, such as employment density and residential population, are key inputs to trip generation models. These models estimate the number of trips originating from and destined for different zones based on land use characteristics.
- Trip Distribution Models: Land use data helps determine the spatial distribution of trips. Models utilize factors like distance, travel time, and land use attractiveness to estimate the distribution of trips between zones.
- Mode Choice Models: Land use affects mode choice. Accessibility to public transit, proximity to employment centers, and parking availability, all derived from land use data, influence an individual’s decision to use a car, transit, or other modes.
- Calibration and Validation: Land use data plays a significant role in calibrating and validating transportation models. Comparing model outputs with observed trip patterns, often spatially represented in a GIS, helps fine-tune the model for accuracy.
Imagine a new shopping mall being built. We’d use land use data to estimate the additional traffic generated by the mall, its impact on surrounding roads, and the potential changes in travel patterns in the area. This data is essential for effectively predicting and mitigating potential transportation challenges.
Q 21. Explain your experience with different traffic simulation software.
My experience includes working with various traffic simulation software packages, each with its strengths and weaknesses:
- VISSIM: A microscopic traffic simulation software that allows for detailed modeling of individual vehicle movements, offering high accuracy for complex scenarios. I’ve used VISSIM to analyze traffic flow in dense urban environments and assess the impact of signal timing changes.
- SUMO (Simulation of Urban Mobility): An open-source microscopic traffic simulation software known for its flexibility and capabilities in handling large networks. I’ve applied SUMO to regional-scale transportation modeling projects.
- PARAMICS: A macroscopic simulation software package, ideal for large-scale network analysis. PARAMICS provides a good balance between computational efficiency and detailed modeling, making it suitable for regional transportation planning scenarios.
- TRANSYT: A widely used macroscopic traffic simulation software that is particularly effective in optimizing traffic signal timings. I’ve used TRANSYT to design efficient signal timing plans for intersections to reduce delays and improve traffic flow.
The choice of software depends on the specific project requirements. For example, for a detailed intersection analysis, VISSIM is often preferred, whereas for a regional-scale model, PARAMICS or SUMO might be more suitable due to computational efficiency considerations.
Q 22. Describe a time you had to overcome a challenge in a TIS project.
One of the biggest challenges I faced was in a TIS for a proposed highway expansion near a sensitive wetland ecosystem. The initial traffic modeling predicted significant increases in traffic congestion in surrounding areas, conflicting with environmental protection goals. The challenge wasn’t just about the technical aspects of the modeling, but in balancing the needs of improved transportation with the preservation of the environment.
To overcome this, we employed a multi-faceted approach. First, we refined the traffic model, incorporating more detailed data on land use and incorporating alternative transportation options, such as improved public transit and cycling infrastructure. We also conducted a more in-depth environmental impact assessment. This involved detailed analysis of potential impacts to wildlife, water quality, and air quality. This allowed us to identify mitigation strategies, such as constructing wildlife crossings and implementing stricter emission controls. Finally, we facilitated a series of stakeholder workshops, bringing together transportation engineers, environmental scientists, community representatives, and government agencies to collaboratively develop a solution that addressed both transportation needs and environmental concerns.
The result was a revised project plan incorporating mitigation measures and alternative transportation options that significantly reduced the negative environmental impacts while still delivering improved traffic flow. This successful resolution underscored the importance of considering all factors in a TIS and the effectiveness of collaborative problem-solving.
Q 23. How do you handle conflicting stakeholder priorities in a TIS?
Handling conflicting stakeholder priorities is a common challenge in TIS. Different groups—residents, businesses, environmental groups, and government agencies—often have differing priorities and perspectives. For example, businesses may prioritize faster commutes for their employees, while residents may prioritize reducing noise and air pollution.
My approach involves a structured process focused on transparency and communication. I begin by clearly identifying all stakeholders and their key concerns through surveys, interviews, and public meetings. This is crucial for understanding the breadth of viewpoints. I then use a multi-criteria decision analysis (MCDA) framework. MCDA allows for the systematic evaluation of different alternatives based on various criteria, assigning weights to each criterion reflecting the relative importance assigned by stakeholders. This process can involve participatory workshops to ensure stakeholder input is incorporated.
For instance, in a project involving highway construction, we might use MCDA to weigh factors such as reduced commute times, environmental impact, construction costs, and community disruption. This quantitative approach ensures that all stakeholder priorities are considered objectively and transparently. The results are then presented and discussed openly, fostering constructive dialogue and ultimately leading to a more balanced and acceptable solution.
Q 24. What are the key steps involved in a Transportation Impact Study?
A comprehensive Transportation Impact Study involves several key steps, which are generally iterative and require continuous feedback loops. The process is not strictly linear.
- Project Definition & Scoping: Clearly define the project goals, study area, and relevant transportation networks. Identify key stakeholders and their concerns.
- Data Collection & Analysis: Gather data on existing traffic conditions, land use, demographics, and transportation networks. This includes traffic counts, accident data, transit ridership, and socioeconomic data.
- Model Development & Calibration: Develop a transportation model (e.g., traffic assignment model, transit model) to simulate the existing and future transportation system. Calibrate the model using existing data to ensure accuracy.
- Scenario Development & Simulation: Develop various scenarios representing different project alternatives. Simulate the impact of each scenario on the transportation system using the calibrated model.
- Impact Assessment: Analyze the results of the simulations, evaluating impacts on traffic flow, congestion, travel times, emissions, accidents, and accessibility. This often involves considering multiple performance measures.
- Mitigation Strategies: Based on the impact assessment, develop and evaluate mitigation strategies to reduce negative impacts and enhance positive impacts.
- Report Preparation & Presentation: Document the findings of the study in a clear and concise report. Present the findings to stakeholders and decision-makers.
This systematic approach ensures a robust and comprehensive assessment of transportation impacts.
Q 25. How do you validate the results of your Transportation Impact Study?
Validating the results of a TIS is critical for ensuring its credibility and usefulness. This involves several strategies:
- Data Validation: Verify the accuracy and completeness of the input data used in the model. This includes checking traffic counts, land use data, and other relevant information.
- Model Validation: Compare the model’s predictions for the existing transportation system with observed data. This involves statistical comparison to confirm the model’s ability to accurately reproduce the current conditions.
- Sensitivity Analysis: Test the model’s sensitivity to changes in input parameters. This helps to understand the uncertainty associated with the model’s predictions.
- Peer Review: Have independent experts review the study’s methodology, data, and results. This ensures objectivity and identifies potential biases or errors.
- Ground Truthing: Where possible, collect additional data after project implementation to compare with predicted results. This post-implementation validation is especially valuable.
By employing these validation techniques, we can build confidence in the accuracy and reliability of our TIS results, making them more valuable to decision-makers.
Q 26. What are the ethical considerations involved in conducting TIS?
Ethical considerations are paramount in conducting TIS. These include:
- Transparency and Objectivity: Maintain transparency in all aspects of the study, ensuring that data and methods are clearly presented and that any potential biases are disclosed.
- Data Privacy: Protect the privacy of individuals whose data are used in the study. Anonymize data where necessary and comply with relevant data protection regulations.
- Stakeholder Engagement: Engage stakeholders fairly and equitably, providing opportunities for input and feedback throughout the study process.
- Conflict of Interest: Avoid or disclose any conflicts of interest that could compromise the objectivity of the study.
- Social Equity: Consider the potential impacts of transportation projects on different social groups, ensuring that projects do not disproportionately benefit or harm certain communities. This often includes evaluating accessibility for vulnerable populations.
Addressing these ethical considerations ensures that TIS results are fair, reliable, and contribute to equitable transportation solutions.
Q 27. How do you stay updated on the latest advancements in transportation planning and modeling?
Staying updated in the dynamic field of transportation planning and modeling requires a multi-pronged approach:
- Professional Organizations: Active membership in organizations like the Institute of Transportation Engineers (ITE) and the Transportation Research Board (TRB) provides access to conferences, publications, and networking opportunities.
- Conferences and Workshops: Attending relevant conferences and workshops allows for direct interaction with experts and exposure to the latest research and technologies.
- Publications: Regularly reading peer-reviewed journals and technical reports keeps me abreast of new methodologies and research findings. This includes publications from universities and government agencies.
- Online Resources: Utilizing online resources such as databases of transportation research, professional blogs, and webinars supplements my knowledge base.
- Software and Tools: Staying current with advancements in transportation modeling software is crucial. This involves attending training sessions and keeping updated with new features in packages such as VISUM, TransCAD, and Cube.
By actively engaging in these avenues, I ensure that my work remains at the cutting edge of the field and incorporates the latest best practices.
Key Topics to Learn for Transportation Impact Studies Interview
- Data Collection & Analysis: Understanding various data sources (traffic counts, surveys, GPS data), data cleaning techniques, and statistical analysis methods used to quantify transportation impacts.
- Modeling Techniques: Proficiency in using transportation modeling software (e.g., TransCAD, VISSIM) to simulate traffic flow, predict travel times, and assess the impact of transportation projects or policies.
- Impact Assessment Methodologies: Familiarity with different methodologies for assessing environmental, social, and economic impacts, including air quality analysis, noise impact assessment, and cost-benefit analysis.
- Trip Generation & Distribution: Understanding the factors that influence trip generation and distribution, and applying appropriate models to predict changes in travel patterns resulting from transportation interventions.
- Traffic Assignment & Network Modeling: Knowledge of traffic assignment models (e.g., user equilibrium, system optimum) and their application in analyzing network performance and identifying potential bottlenecks.
- Mitigation Measures & Strategies: Ability to identify and evaluate potential mitigation measures to lessen the negative impacts of transportation projects, such as traffic calming, transit-oriented development, and infrastructure improvements.
- Report Writing & Presentation: Experience in preparing clear, concise, and well-supported reports and presenting findings to technical and non-technical audiences.
- Case Studies & Best Practices: Understanding real-world examples of successful transportation impact studies and best practices for conducting thorough and effective assessments.
Next Steps
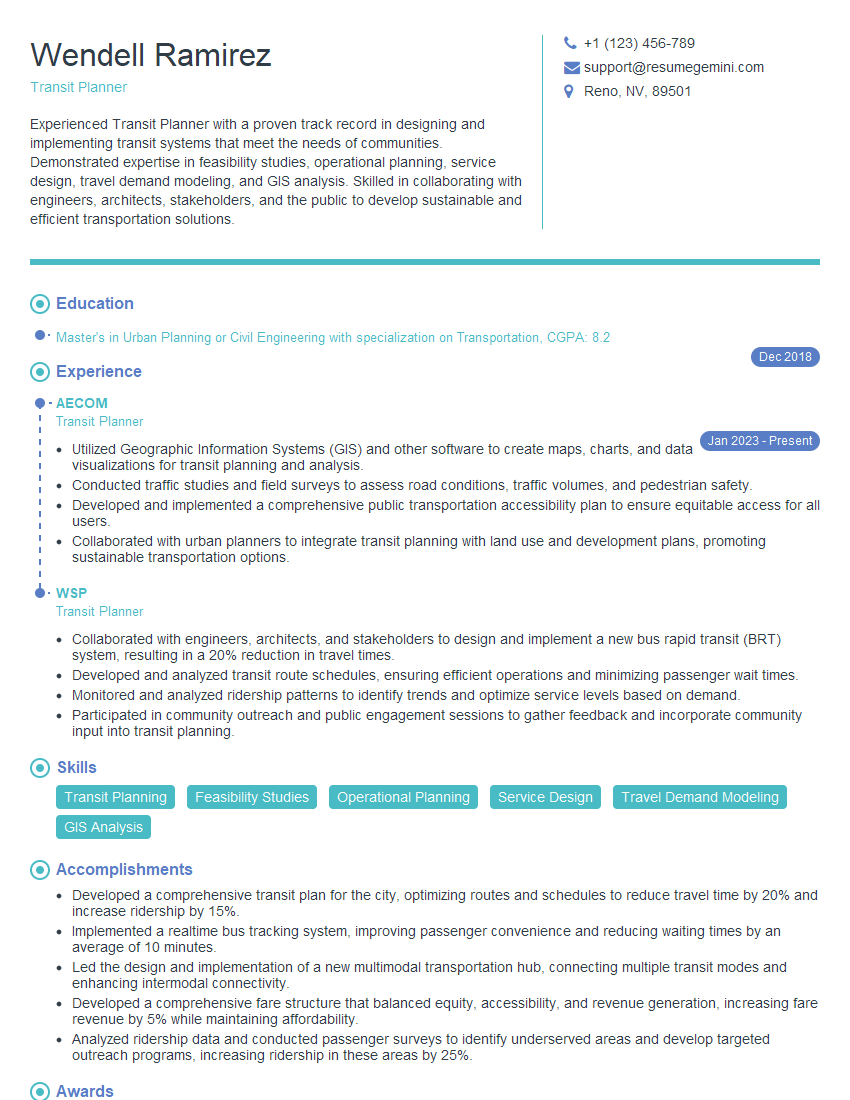
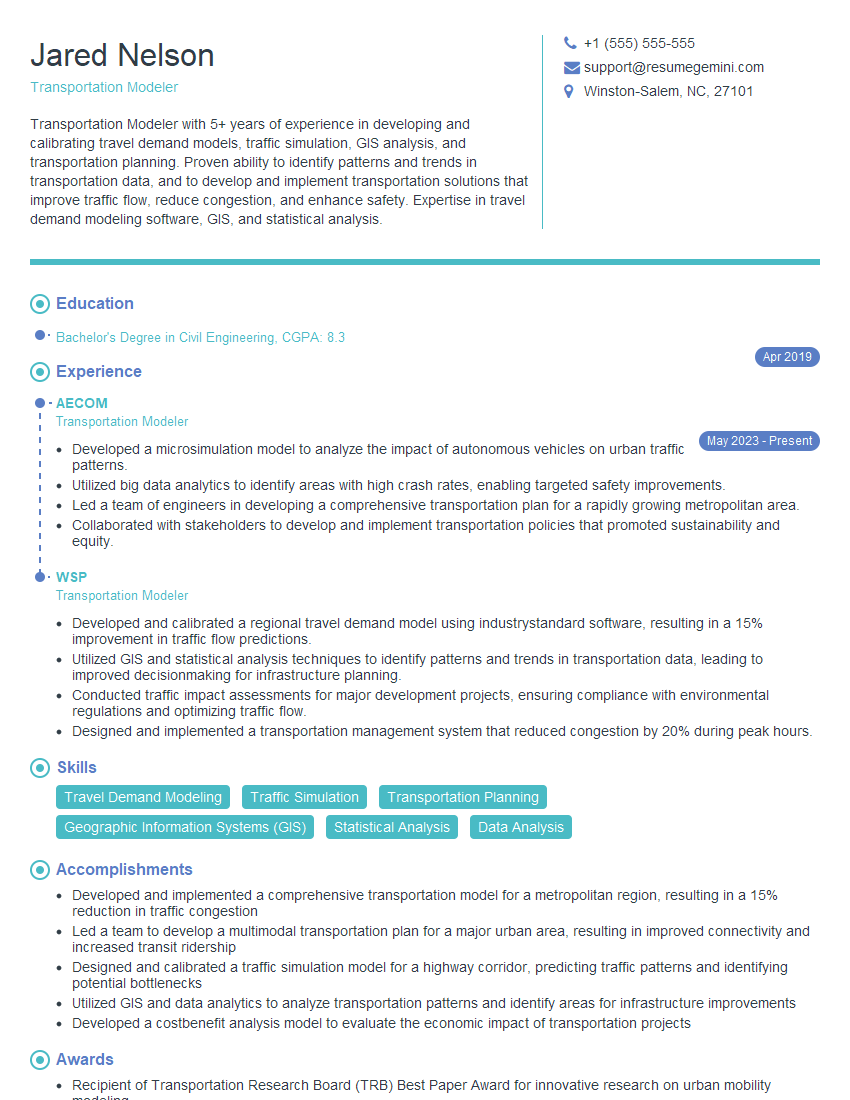
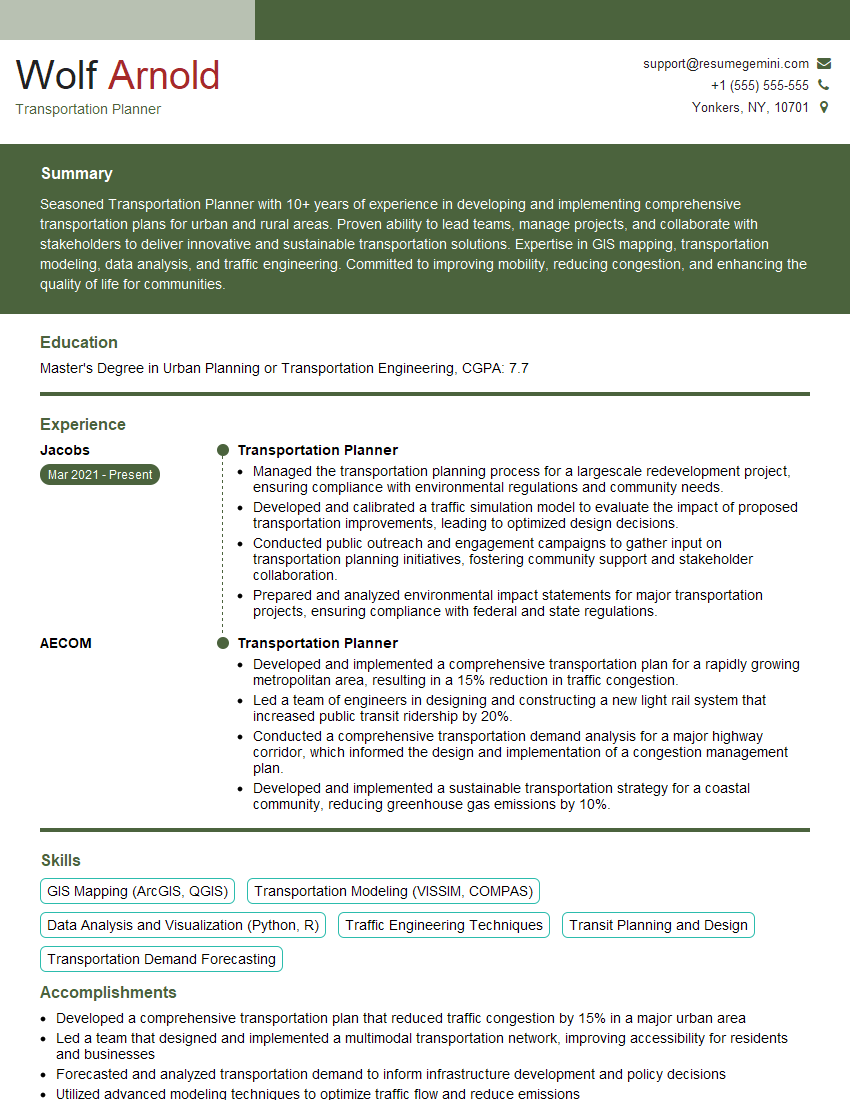
Mastering Transportation Impact Studies opens doors to exciting and impactful careers in urban planning, transportation engineering, and environmental consulting. To significantly boost your job prospects, create a compelling, ATS-friendly resume that showcases your skills and experience effectively. ResumeGemini is a trusted resource to help you build a professional and impactful resume that highlights your qualifications. We provide examples of resumes tailored specifically to Transportation Impact Studies to help guide your process. Invest the time to craft a strong resume – it’s your first impression with potential employers!
Explore more articles
Users Rating of Our Blogs
Share Your Experience
We value your feedback! Please rate our content and share your thoughts (optional).
What Readers Say About Our Blog
Hello,
We found issues with your domain’s email setup that may be sending your messages to spam or blocking them completely. InboxShield Mini shows you how to fix it in minutes — no tech skills required.
Scan your domain now for details: https://inboxshield-mini.com/
— Adam @ InboxShield Mini
Reply STOP to unsubscribe
Hi, are you owner of interviewgemini.com? What if I told you I could help you find extra time in your schedule, reconnect with leads you didn’t even realize you missed, and bring in more “I want to work with you” conversations, without increasing your ad spend or hiring a full-time employee?
All with a flexible, budget-friendly service that could easily pay for itself. Sounds good?
Would it be nice to jump on a quick 10-minute call so I can show you exactly how we make this work?
Best,
Hapei
Marketing Director
Hey, I know you’re the owner of interviewgemini.com. I’ll be quick.
Fundraising for your business is tough and time-consuming. We make it easier by guaranteeing two private investor meetings each month, for six months. No demos, no pitch events – just direct introductions to active investors matched to your startup.
If youR17;re raising, this could help you build real momentum. Want me to send more info?
Hi, I represent an SEO company that specialises in getting you AI citations and higher rankings on Google. I’d like to offer you a 100% free SEO audit for your website. Would you be interested?
Hi, I represent an SEO company that specialises in getting you AI citations and higher rankings on Google. I’d like to offer you a 100% free SEO audit for your website. Would you be interested?
good
