The thought of an interview can be nerve-wracking, but the right preparation can make all the difference. Explore this comprehensive guide to Transportation Planning and Modeling interview questions and gain the confidence you need to showcase your abilities and secure the role.
Questions Asked in Transportation Planning and Modeling Interview
Q 1. Explain the four-step transportation model.
The four-step transportation model is a classic and widely used method for forecasting travel demand. It’s a sequential process, breaking down the complex problem of predicting travel patterns into four manageable steps. Think of it like a recipe for predicting where people will travel and how they’ll get there.
Trip Generation: This step estimates the total number of trips originating and ending in each zone within the study area. We use factors like population, employment, and land use to predict how many trips will start and end in each location. Imagine counting how many people leave their homes and workplaces in different neighborhoods.
Trip Distribution: This step determines the origin-destination (O-D) matrix, showing the number of trips between each pair of zones. Gravity models or other spatial interaction models are often employed, where the attractiveness of destinations influences trip distribution. Imagine calculating how many people from each neighborhood travel to each other neighborhood (e.g., shopping center, work).
Modal Split: This step allocates trips to different transportation modes (car, bus, train, etc.). We use factors like travel time, cost, and mode availability to determine which mode is preferred for each trip. Imagine deciding whether people choose their car, the bus, or the train based on how long it takes and how much it costs.
Trip Assignment: This step assigns trips to the specific road network, determining traffic flows on each link. This often involves shortest path algorithms. Imagine routing all those trips onto a map, showing the traffic flow on each road.
These steps are iterative; the outputs of one step inform the inputs of the next. This sequential nature makes it relatively straightforward to understand and implement, despite its limitations (discussed later).
Q 2. Describe different types of transportation models (e.g., four-step, activity-based).
Transportation models come in various flavors, each with its own strengths and weaknesses. The four-step model is just one example.
Four-Step Model: As detailed above, this is a classical, sequential approach. It’s relatively easy to understand and implement, making it suitable for initial assessments and smaller-scale projects. However, its sequential nature can be a limitation.
Activity-Based Models (ABM): ABMs move beyond simply predicting trips. They model individual choices about activities (work, shopping, leisure) and then infer trip patterns based on these choices. ABMs are more complex but offer better insights into travel behavior, particularly capturing the interaction between activities and travel choices. For example, an ABM would model the decision of whether to combine work and grocery shopping trips.
Integrated Land Use-Transportation Models: These couple models of land use change with transportation models, allowing for analysis of the feedback loops between land development decisions and transportation demand. This allows us to see how building a new housing development might affect traffic congestion.
Agent-Based Models: These simulate the behavior of individual agents (vehicles, people) interacting within a network. These are computationally intensive but can capture emergent behaviors like traffic jams that simpler models miss. Imagine simulating the movement of individual cars and seeing how they react to each other and traffic signals.
The choice of model depends heavily on the project objectives, data availability, budget, and the required level of detail.
Q 3. What are the limitations of the four-step model?
While the four-step model is a valuable tool, it has limitations. Its sequential nature is a significant drawback.
Independence of Steps: The assumption that steps are independent is unrealistic. For instance, mode choice is influenced by travel time, which is determined in the trip assignment step. This creates inherent inaccuracies.
Simplified Behavioral Representation: The model simplifies decision-making processes. It doesn’t capture the complex interactions between activities, mode choices, and route choices that individuals make.
Difficulty in Handling New Technologies: Incorporating the impact of emerging technologies like ride-sharing or autonomous vehicles is challenging within the four-step framework.
Limited Feedback Loops: The model doesn’t explicitly handle feedback mechanisms between transportation supply and demand. Changes in network capacity don’t automatically affect trip generation or distribution.
These limitations highlight the need for more sophisticated models in certain situations, especially when addressing complex or rapidly changing travel environments.
Q 4. How do you calibrate and validate a transportation model?
Calibration and validation are crucial steps in ensuring the model accurately reflects reality. Calibration involves adjusting model parameters to match observed data, while validation checks how well the calibrated model predicts independent data.
Calibration: This often involves adjusting parameters within the model (e.g., friction factors in gravity models, mode choice parameters) until the model’s outputs closely match observed travel patterns (e.g., from traffic counts, O-D surveys). This is often an iterative process, involving trial and error, and statistical methods.
Validation: Once calibrated, the model’s performance is evaluated using independent data, not used in the calibration process. Metrics like root mean square error (RMSE) or correlation coefficients are used to assess the accuracy of the model’s predictions. If the model performs poorly on validation data, it indicates flaws either in the model structure or the data used for calibration.
A well-calibrated and validated model is crucial for making reliable forecasts and informing transportation planning decisions. If a model’s predictions are consistently far off from observed data, it can lead to flawed investments in infrastructure or policy changes.
Q 5. What software packages are you proficient in for transportation modeling (e.g., Cube, VISUM, Emme)?
Throughout my career, I have gained extensive experience with several leading software packages used for transportation modeling. My proficiency encompasses:
Cube: I’m highly familiar with Cube’s capabilities for network modeling, assignment, and forecasting. I’ve successfully used it for large-scale projects.
VISUM: I possess a strong understanding of VISUM’s comprehensive features for both microsimulation and macroscopic modeling, and have leveraged its powerful visualization tools for effective communication of results.
Emme: My experience with Emme includes network building, assignment, and various forecasting techniques. I’ve used it effectively for multimodal modeling and scenario analysis.
Beyond these, I possess experience with other tools such as TransCAD and various programming languages (e.g., Python) to extend the functionalities of these packages and to develop custom solutions for specific modeling challenges.
Q 6. Explain the concept of travel demand management (TDM).
Travel Demand Management (TDM) encompasses strategies and policies aimed at influencing travel behavior to reduce congestion, improve air quality, and enhance transportation efficiency. It’s about encouraging people to make different travel choices – or to avoid unnecessary trips.
TDM strategies can be categorized into several groups:
Demand Reduction: This involves reducing the overall number of trips, for instance through telecommuting programs or staggered work hours.
Demand Shifting: This focuses on shifting trips away from peak periods (e.g., offering incentives for off-peak travel) or to more efficient modes of transportation.
Demand Management: This aims to manage existing travel demand more efficiently through strategies like improved traffic signal timing or implementing congestion pricing.
Examples include:
Incentivizing public transit: Offering subsidies or improving service quality.
Promoting cycling and walking: Creating dedicated bike lanes and pedestrian walkways.
Implementing congestion pricing: Charging drivers a fee to enter congested areas.
Encouraging telecommuting: Promoting working remotely.
TDM is not about simply controlling travel, but rather about providing alternatives and incentives to create a more sustainable and efficient transportation system.
Q 7. Describe different types of travel demand forecasting techniques.
Travel demand forecasting relies on various techniques, each with its own approach and assumptions.
Trend Extrapolation: This is a simple method that projects past trends into the future. While easy to use, it assumes that past trends will continue, which may not always hold true.
Regression Analysis: This statistical method identifies relationships between travel demand and various influencing factors (population, income, etc.) to predict future demand based on projected changes in these factors.
Causal Models: These models attempt to explain the underlying causes of travel demand, using theoretical frameworks and empirical data. This approach is more sophisticated but requires a deeper understanding of travel behavior.
Econometric Models: These models use statistical techniques to analyze the relationship between economic variables and travel demand. They are particularly useful in forecasting the impact of policy changes on travel patterns.
Simulation Models: These models, such as the four-step model or activity-based models, simulate the travel choices of individuals or households to predict overall travel demand.
The choice of forecasting technique depends on the specific application, data availability, and resources. Often, a combination of techniques is employed to provide a more robust and reliable forecast.
Q 8. How do you incorporate land use data into transportation models?
Land use data is crucial in transportation planning because it dictates the origin and destination (OD) of trips. We use this data to forecast travel demand. Incorporating it involves several steps:
- Data Acquisition: We obtain land use data from sources like census data, zoning maps, and GIS databases. This data might include population density, employment figures by sector, and land use classifications (residential, commercial, industrial).
- Data Processing: This data is often not directly usable. We may need to aggregate it to a suitable spatial scale (e.g., traffic analysis zones – TAZs) for our model. Data cleaning and standardization are also crucial.
- Trip Generation: Using regression models (like multiple linear regression) or gravity models, we estimate the number of trips generated from and attracted to different zones based on land use characteristics. For instance, a higher population density usually means more trip origins, while a large employment center will attract many trips.
- Trip Distribution: We determine the distribution of trips between zones, using models like the gravity model, which considers the attractiveness of destinations and the impedance of travel (distance, travel time).
- Integration into Transportation Models: Finally, the estimated OD matrix (showing the number of trips between each pair of zones) is fed into the transportation model (for example, a four-step model or a dynamic traffic assignment model) to simulate network flows and evaluate performance.
Example: In planning a new highway, we’d use land use data to predict the increase in traffic volume from new residential developments near the highway and the additional traffic attracted to the employment areas accessible by the new road.
Q 9. Explain the significance of accessibility in transportation planning.
Accessibility refers to the ease with which individuals can reach desired destinations. It’s a critical concept because efficient transportation systems must provide convenient access to jobs, education, healthcare, and other essential services. Poor accessibility leads to social and economic inequalities.
We measure accessibility using various indicators, including:
- Travel time: The time taken to reach opportunities.
- Travel cost: The monetary cost of travel (including fuel, tolls, and parking).
- Network connectivity: The number and quality of transportation links between origins and destinations.
Significance in Planning: Accessibility analysis informs decisions on infrastructure investments, transit route planning, and land use regulations. For example, ensuring good accessibility to job centers can stimulate economic activity and reduce commute times. Conversely, inadequate accessibility can lead to social exclusion and limit economic opportunities for certain groups.
Example: A transportation plan might prioritize improvements to public transit in underserved areas to increase accessibility to employment hubs for residents who lack access to private vehicles.
Q 10. What are the key performance indicators (KPIs) used in transportation planning?
Key Performance Indicators (KPIs) in transportation planning track the efficiency, effectiveness, and impact of transportation systems. They vary depending on the project but often include:
- Level of Service (LOS): Measures the quality of traffic flow (e.g., free flow, congested). Often expressed on a letter scale (A-F).
- Travel Time: Average travel time between origins and destinations, a critical measure of efficiency.
- Vehicle Miles Traveled (VMT): Total distance traveled by vehicles, impacting congestion and emissions.
- Transit Ridership: Number of passengers using public transit, indicating effectiveness of transit systems.
- Accident Rates: Number of accidents per vehicle-mile traveled, assessing safety.
- Emissions: Greenhouse gas emissions from transportation activities, measuring environmental impact.
- Equity: Measuring accessibility and travel time differences across different socioeconomic groups.
Example: When evaluating a new highway, we’d track LOS, travel time reductions on affected routes, and the change in VMT to gauge its effectiveness and identify unintended consequences (like induced demand).
Q 11. How do you evaluate the effectiveness of transportation projects?
Evaluating transportation projects involves comparing the predicted outcomes before the project with post-project observations. This is done through a combination of quantitative and qualitative methods:
- Before & After Studies: Comparing traffic volumes, travel times, accident rates, and other KPIs before and after project implementation. This requires collecting baseline data prior to the project.
- Modeling: Using transportation models to simulate the impact of the project under various scenarios. This allows for forecasting and counterfactual analysis (what would have happened without the project).
- Surveys and Public Input: Gathering feedback from users through surveys and community engagement. This qualitative data complements quantitative metrics.
- Cost-Benefit Analysis (CBA): Comparing the total costs of the project to its benefits (reduced congestion, improved safety, economic benefits). This involves monetizing both tangible and intangible impacts.
- Environmental Impact Assessment (EIA): Assessing the project’s environmental consequences (air quality, noise pollution, habitat disruption).
Example: To evaluate a bus rapid transit (BRT) system, we’d compare pre- and post-implementation data on ridership, travel times, and air quality, along with user satisfaction surveys and a CBA.
Q 12. Describe your experience with GIS and its applications in transportation planning.
Geographic Information Systems (GIS) are indispensable in transportation planning. My experience encompasses using GIS for various tasks, including:
- Data Visualization: Creating maps to visualize transportation networks, land use patterns, and demographic data. This facilitates better understanding and communication of project impacts.
- Spatial Analysis: Conducting spatial analyses like proximity analysis (measuring distances to facilities), network analysis (finding shortest paths), and overlay analysis (combining multiple datasets).
- Data Management: Storing, managing, and analyzing large transportation datasets (road networks, transit schedules, accident records).
- Modeling Support: Preparing input data for transportation models (creating TAZs, digitizing road networks), and visualizing model outputs.
- Public Participation GIS (PPGIS): Engaging the public in transportation planning through interactive mapping tools. This allows for better input and understanding from stakeholders.
Example: In a recent project, I used GIS to analyze accessibility to public transit for low-income communities, identifying areas with limited transit access and informing recommendations for transit service improvements. The spatial analysis using GIS helped make a strong case for targeted investments.
Q 13. Explain different traffic assignment methods (e.g., all-or-nothing, user equilibrium).
Traffic assignment methods determine how traffic is distributed across a network given an origin-destination (OD) matrix. Two common methods are:
- All-or-Nothing Assignment: This is a simple method where all trips between an origin and destination are assigned to the shortest path. It doesn’t account for congestion. It’s useful for initial assessments but can be unrealistic for congested networks.
- User Equilibrium (UE) Assignment: This method considers congestion. It assumes that drivers choose routes to minimize their individual travel time. No driver can reduce their travel time by unilaterally switching routes. This leads to a more realistic traffic pattern, often solved using iterative algorithms like the Frank-Wolfe algorithm.
Other Methods: System optimum (SO) assignment aims to minimize total system travel time, but it’s not realistic since drivers act in their own self-interest. Stochastic assignment methods incorporate randomness in route choice to account for driver behavior variations.
Example: In a network with two paths between A and B, all-or-nothing assignment would route all traffic to the shortest path, regardless of its current congestion. UE assignment would distribute the traffic between the paths based on their respective travel times, resulting in a more balanced flow and potentially longer travel times for some drivers compared to the all-or-nothing scenario.
Q 14. What are the environmental considerations in transportation planning?
Environmental considerations are paramount in modern transportation planning. Key aspects include:
- Greenhouse Gas Emissions: Reducing carbon emissions from vehicles is a major concern. This involves promoting alternative transportation modes (public transit, cycling, walking), adopting fuel-efficient vehicles, and implementing strategies to reduce VMT.
- Air Quality: Transportation is a significant source of air pollutants. We must consider the impact of projects on air quality, including criteria pollutants (NOx, PM) and ozone formation. This often involves using air quality models to predict impacts.
- Noise Pollution: Noise from traffic can have significant health impacts on nearby residents. Transportation planning should include noise mitigation measures such as noise barriers and quieter pavement surfaces.
- Water Quality: Runoff from roads can contaminate water bodies. Effective stormwater management is essential.
- Habitat Fragmentation: New transportation infrastructure can disrupt wildlife habitats. Careful planning minimizes such impacts through wildlife crossings and habitat preservation.
- Energy Consumption: Transportation consumes substantial amounts of energy. Strategies to reduce energy consumption include improving fuel efficiency and promoting renewable energy sources for transportation.
Example: When planning a new highway, an EIA would assess its impact on air quality, noise levels, and habitat fragmentation, requiring potential mitigation measures like noise barriers and wildlife crossings. A life-cycle assessment of materials used in the project is also crucial for environmentally sustainable development.
Q 15. Discuss the role of public transit in a sustainable transportation system.
Public transit plays a crucial role in building a sustainable transportation system by significantly reducing our reliance on private vehicles. This reduction leads to lower greenhouse gas emissions, improved air quality, and less traffic congestion. Think of it like this: a single bus can carry dozens of people, replacing dozens of individual cars on the road. That’s a massive reduction in emissions and energy consumption.
- Reduced Greenhouse Gas Emissions: Public transit vehicles, especially those powered by electricity or alternative fuels, produce far fewer emissions than individual cars.
- Improved Air Quality: Fewer vehicles on the road directly translates to cleaner air, benefiting public health and the environment.
- Reduced Congestion: Efficient public transit systems can ease traffic congestion, saving commuters time and reducing fuel consumption associated with idling and stop-and-go traffic.
- Land Use Efficiency: Transit-oriented development encourages denser, more walkable communities, reducing sprawl and the need for extensive road networks.
For example, cities like Curitiba, Brazil, are renowned for their highly efficient bus rapid transit (BRT) system, which has drastically reduced traffic congestion and improved air quality while providing affordable and accessible transportation for its citizens.
Career Expert Tips:
- Ace those interviews! Prepare effectively by reviewing the Top 50 Most Common Interview Questions on ResumeGemini.
- Navigate your job search with confidence! Explore a wide range of Career Tips on ResumeGemini. Learn about common challenges and recommendations to overcome them.
- Craft the perfect resume! Master the Art of Resume Writing with ResumeGemini’s guide. Showcase your unique qualifications and achievements effectively.
- Don’t miss out on holiday savings! Build your dream resume with ResumeGemini’s ATS optimized templates.
Q 16. Explain the concept of level of service (LOS) and its implications.
Level of Service (LOS) is a qualitative measure describing operational conditions within a transportation system, such as a roadway or transit line. It’s a way to quantify how well a system performs under different traffic volumes and conditions. Think of it like rating a restaurant: a high LOS is like a five-star restaurant – smooth and efficient, while a low LOS is akin to a crowded, slow-service establishment.
LOS is usually expressed on a scale (typically A to F, where A is the best and F is the worst), based on factors like speed, density, and delay. For roadways, LOS considers factors such as traffic speed, density, and the number of lane changes. For transit, LOS may focus on waiting time, crowding, and ride time.
Implications of LOS: Understanding LOS is critical for planning and managing transportation networks. A low LOS indicates potential problems such as congestion, safety concerns, and user dissatisfaction. This knowledge helps in prioritizing improvements, like adding lanes, implementing traffic management strategies, or increasing service frequency for public transit.
For example, if a highway consistently operates at LOS E or F during peak hours, it signals a need for capacity expansion or intelligent transportation systems to improve traffic flow. Conversely, a transit route with a consistently low LOS might require increased service frequency or route adjustments to meet passenger demand.
Q 17. How do you handle uncertainty and risk in transportation planning projects?
Uncertainty and risk are inherent in transportation planning. We handle these through a combination of robust data analysis, advanced modeling techniques, and scenario planning.
- Sensitivity Analysis: We examine how changes in key input parameters (e.g., travel demand, construction costs) affect the outcomes of our models. This allows us to identify the most critical uncertainties.
- Monte Carlo Simulation: This technique allows us to simulate many possible scenarios by randomly sampling input parameters based on their probability distributions. This helps in assessing the probability of different outcomes.
- Risk Assessment and Mitigation: We identify potential risks (e.g., project delays, cost overruns, environmental impacts) and develop mitigation strategies to reduce their likelihood or severity. This might include contingency planning or alternative project designs.
- Scenario Planning: We develop multiple future scenarios based on different assumptions about population growth, economic conditions, and technological advancements. This helps evaluate the robustness of our plans under varying circumstances.
For instance, when planning a new highway, we might use Monte Carlo simulation to assess the probability of cost overruns based on historical construction data and inflation forecasts. Then, we can build contingencies into the budget to manage these potential risks.
Q 18. What is the difference between strategic, tactical, and operational transportation planning?
Transportation planning operates at three main levels: strategic, tactical, and operational.
- Strategic Planning (Long-term, 10-30 years): This focuses on the big picture. It involves setting long-term goals, identifying transportation needs, and developing a regional or statewide transportation system plan. Examples include developing a regional transportation plan outlining major highway expansions or transit corridors.
- Tactical Planning (Mid-term, 5-10 years): This translates the strategic plan into more concrete actions. It involves designing specific projects, implementing policies, and allocating resources. An example would be designing a new highway interchange or expanding a bus rapid transit line.
- Operational Planning (Short-term, less than 5 years): This deals with the day-to-day operations of the transportation system. It involves traffic signal timing, transit scheduling, incident management, and real-time traffic monitoring. An example is adjusting traffic signal timings based on real-time traffic conditions using adaptive traffic control systems.
Imagine building a house: strategic planning is deciding the overall layout and location; tactical planning is designing the individual rooms and systems; and operational planning is managing the day-to-day construction activities.
Q 19. Describe your experience with transportation planning studies (e.g., origin-destination studies).
I have extensive experience conducting various transportation planning studies, including origin-destination (OD) studies. OD studies are crucial for understanding travel patterns within a region. They involve collecting data to determine where trips originate and where they terminate, providing insights into trip purpose, mode choice, and travel time.
In one project, I led a team in conducting a comprehensive OD study for a large metropolitan area. We used a combination of techniques, including household travel surveys, automatic vehicle identification (AVI) data from toll roads, and GPS data from smartphones, to collect a massive dataset. We then used specialized software to analyze the data and model travel patterns. The results of this study were essential for planning new transportation infrastructure, including highway improvements and bus rapid transit routes.
The study helped us identify areas with high traffic congestion and significant unmet transit demand, leading to recommendations for targeted infrastructure investments and service improvements. This resulted in improved traffic flow, reduced commute times, and better overall transportation accessibility for the region.
Q 20. Explain the concept of induced travel demand.
Induced travel demand refers to the phenomenon where improvements to the transportation system, such as building a new highway or expanding a transit line, actually *increase* the overall amount of travel. This happens because improved accessibility and reduced travel times encourage people to make more trips or choose longer trips than they would have otherwise.
This isn’t necessarily a bad thing, but it’s crucial to understand and account for it in planning. If we build a new highway without considering induced demand, we might end up with even more congestion than before, negating the benefits of the improvement.
Imagine a town with limited road capacity. Building a new bypass might alleviate congestion initially. However, more people might then choose to drive to previously less accessible areas or make longer trips, leading to increased overall vehicle miles traveled and potentially increased congestion elsewhere in the network. This is induced demand. Effective planning must account for this effect, potentially through traffic management strategies, land use policies, and other measures to manage the resulting increase in travel.
Q 21. How do you incorporate equity considerations into transportation planning decisions?
Incorporating equity considerations is paramount in transportation planning. It means ensuring that all members of the community, regardless of income, race, age, or disability, have access to safe, affordable, and convenient transportation options. We can’t just build the most efficient system; we have to build a *fair* system.
- Accessibility Analysis: We assess the accessibility of transportation services to different population groups, paying particular attention to vulnerable populations. This might involve analyzing travel times, transit fare structures, and the availability of services in low-income or minority neighborhoods.
- Community Engagement: We actively engage with diverse community groups to understand their transportation needs and concerns. This helps ensure that the planning process is inclusive and representative of the community’s diverse interests.
- Environmental Justice: We strive to avoid disproportionately impacting disadvantaged communities with negative environmental consequences of transportation projects, such as increased air pollution or noise.
- Affordability: We consider the cost of transportation, including fares, parking, and vehicle ownership, and how this affects different socioeconomic groups. This might involve exploring options for affordable public transit or subsidies for low-income individuals.
For example, when planning a new bus route, we would analyze its accessibility to low-income neighborhoods and people with disabilities. We might adjust the route or schedule to better serve these communities. Similarly, we might explore strategies for making transit fares more affordable or providing transportation assistance to low-income individuals.
Q 22. Discuss your experience with transportation data collection and analysis methods.
Transportation data collection and analysis are crucial for effective planning. My experience encompasses a wide range of methods, from traditional techniques to cutting-edge data analytics. We start with defining the scope of the study, identifying the required data, and then selecting the appropriate collection methods.
Traditional Methods: These include traffic counts (manual and automated), origin-destination surveys (using questionnaires or GPS data), and on-site observations. For example, I’ve used loop detectors embedded in roadways to measure traffic volume and speed for several highway projects. This data is then analyzed to understand traffic patterns, congestion points, and travel times.
Advanced Methods: I have extensive experience using Geographic Information Systems (GIS) to map and analyze spatial data. This allows for visualizing traffic flows, identifying transportation infrastructure needs, and assessing accessibility. I also utilize various software and programming languages (e.g., Python with libraries like Pandas and NumPy) to analyze large datasets from sources like GPS trackers, smart cards, and mobile phone location data to gain insights into travel behavior, which is essential for forecasting and modeling future scenarios.
Data Analysis Techniques: After data collection, statistical methods like regression analysis, time series analysis, and network analysis are employed. For instance, I once used regression analysis to model the relationship between traffic congestion and land use patterns in a rapidly growing suburban area, enabling recommendations for infrastructure improvements and land-use policies.
Q 23. How do you prioritize transportation projects based on various criteria?
Prioritizing transportation projects requires a multi-criteria decision analysis (MCDA) approach. It’s not simply about cost; we must consider various factors with different weights based on the context. For instance, a cost-benefit analysis (CBA) is often employed to assess the economic viability of a project.
Criteria: These could include safety improvements (reduction in accidents), economic benefits (increased productivity and business opportunities), environmental impacts (reduced emissions and noise pollution), social equity (improved access for underserved communities), and political feasibility (community support).
Weighting Criteria: Each criterion is assigned a weight based on its importance relative to project goals. This is often done through stakeholder engagement sessions or surveys, ensuring a balanced representation of community needs and preferences.
Scoring Methods: Each project is scored against the criteria. A weighted scoring system combines scores with weights to arrive at an overall ranking of the projects. The scoring system could be a simple point system or use more sophisticated techniques like Analytic Hierarchy Process (AHP).
Example: In a previous project, we used a weighted scoring system to prioritize highway improvements, weighing safety improvements and travel time reduction highly. This prioritized projects focusing on areas with high accident rates and significant traffic congestion, addressing both safety and economic efficiency.
Q 24. What are the challenges in integrating different modes of transportation?
Integrating different modes of transportation presents several challenges, primarily stemming from the varying operational characteristics and governance structures of each mode.
Data Integration: Consolidating data from various sources (buses, trains, ride-sharing services, etc.) to create a unified view of the transportation network is complex. Different agencies may use different data formats and standards, making integration a significant hurdle. The use of open data standards and APIs is helping address this issue. For example, GTFS (General Transit Feed Specification) has improved data exchange between transit agencies and third-party applications.
Intermodal Transfer: Designing efficient transfer points between modes (e.g., seamless transitions from bus to rail) requires careful consideration of location, accessibility, and waiting times. The design should minimize walking distances, ensure adequate shelter, and provide real-time information to passengers.
Technological Interoperability: Ensuring that different technologies (ticketing systems, payment platforms, real-time information systems) work together seamlessly is essential. For example, using a single mobile ticketing application for multiple transportation modes requires considerable technical coordination.
Institutional Barriers: Collaboration among different transportation agencies and private operators is often challenging due to conflicting interests, different priorities, and bureaucratic hurdles.
Q 25. Explain your understanding of smart city initiatives and their impact on transportation.
Smart city initiatives leverage technology to improve urban living, and transportation is a key area of focus. The integration of smart technologies significantly impacts transportation planning and operations.
Real-time Data and Information: Smart sensors, GPS trackers, and mobile phone data provide real-time information on traffic flow, congestion, parking availability, and public transit schedules. This empowers improved traffic management, dynamic routing, and more efficient transit operations. Imagine a system providing real-time rerouting for drivers based on traffic incidents, or a transit app showing accurate wait times for buses.
Intelligent Transportation Systems (ITS): These systems utilize technology to optimize traffic flow, enhance safety, and improve efficiency. Examples include adaptive traffic signals that adjust to real-time traffic conditions, advanced traveler information systems that provide navigation and route guidance, and automated vehicle technologies.
Sustainable Transportation: Smart city initiatives frequently promote sustainable transportation options, such as electric vehicles, bike-sharing programs, and ride-sharing services. Data analysis can help assess the effectiveness of these initiatives and guide policy development. For example, analyzing bike-sharing data can help optimize the placement of bike stations and understand usage patterns.
Data-driven Decision Making: The massive amount of data generated by smart city technologies facilitates data-driven decision making in transportation planning. Analyzing this data enables more effective and efficient planning, resulting in better resource allocation and improved transportation services.
Q 26. Describe your experience with transportation safety analysis.
Transportation safety analysis involves identifying and mitigating risks associated with the transportation system. My experience includes various methods for analyzing crash data, identifying safety hazards, and developing safety improvement plans.
Crash Data Analysis: This involves examining historical crash data to identify patterns, contributing factors, and high-risk locations. Techniques like spatial analysis and statistical modeling are used to pinpoint hotspots and understand the causes of accidents. We can then develop strategies to mitigate risks.
Safety Audits and Inspections: I’ve conducted numerous safety audits and inspections of transportation infrastructure to identify potential hazards, such as poor signage, inadequate lighting, or dangerous roadway designs. This involves on-site inspections and visual assessments, alongside reviewing engineering designs and operational plans.
Safety Improvement Plans: Based on the findings of crash data analysis and safety audits, I develop comprehensive safety improvement plans. These plans include specific actions to mitigate risks, such as improved signage, pavement markings, traffic calming measures, and educational campaigns. This may include, for instance, recommending the implementation of roundabouts to reduce high-speed collisions.
Microscopic Simulation: Simulation models can be used to analyze the safety impacts of proposed design changes or operational strategies. These models allow us to test different scenarios in a virtual environment to assess safety improvements before implementing them in the real world.
Q 27. How do you communicate complex transportation planning concepts to stakeholders?
Communicating complex transportation concepts to stakeholders requires clear, concise, and visually appealing presentations. I use various methods to tailor communication to the audience.
Visual Aids: Maps, charts, and graphs are essential to conveying complex data in a user-friendly format. Interactive dashboards and data visualizations can make information easily understandable for a non-technical audience.
Storytelling: Framing information within a compelling narrative can increase engagement and understanding. Using real-world examples and case studies helps illustrate complex ideas in a relatable way.
Tailored Messaging: The level of detail and technical jargon should be adjusted to the audience’s knowledge and background. For example, a presentation to city council members will differ from one presented to community residents.
Interactive Sessions: Engaging stakeholders in interactive sessions, workshops, and public forums fosters discussion, encourages feedback, and promotes transparency.
Collaboration and Feedback: Working closely with stakeholders throughout the planning process allows for continuous feedback and helps refine communication strategies.
Key Topics to Learn for Transportation Planning and Modeling Interview
- Transportation Demand Forecasting: Understanding different models (e.g., four-step model, activity-based models) and their applications in predicting future travel demand. Practical application: Analyzing the impact of a new highway on traffic patterns in a specific region.
- Network Modeling and Simulation: Proficiency in using software like Vissim, Aimsun, or TransCAD to simulate traffic flow and analyze network performance. Practical application: Optimizing traffic signal timing to reduce congestion at a busy intersection.
- Transportation System Evaluation: Mastering techniques for evaluating transportation projects based on various criteria (e.g., cost-benefit analysis, environmental impact assessment). Practical application: Comparing the effectiveness of different transit options for a specific corridor.
- Data Analysis and Visualization: Strong skills in data manipulation, statistical analysis, and creating compelling visualizations to communicate findings effectively. Practical application: Presenting complex modeling results to stakeholders in a clear and concise manner.
- Travel Behavior Analysis: Understanding factors influencing travel choices and using this knowledge to inform planning decisions. Practical application: Designing transportation policies to encourage the use of sustainable modes of transportation.
- Geographic Information Systems (GIS): Familiarity with GIS software and its applications in transportation planning. Practical application: Mapping transportation networks and visualizing spatial data related to accessibility and equity.
- Advanced Modeling Techniques: Explore concepts such as agent-based modeling, discrete choice modeling, and stochastic network optimization for more in-depth understanding. Practical application: Simulating the effects of autonomous vehicles on traffic flow and congestion.
Next Steps
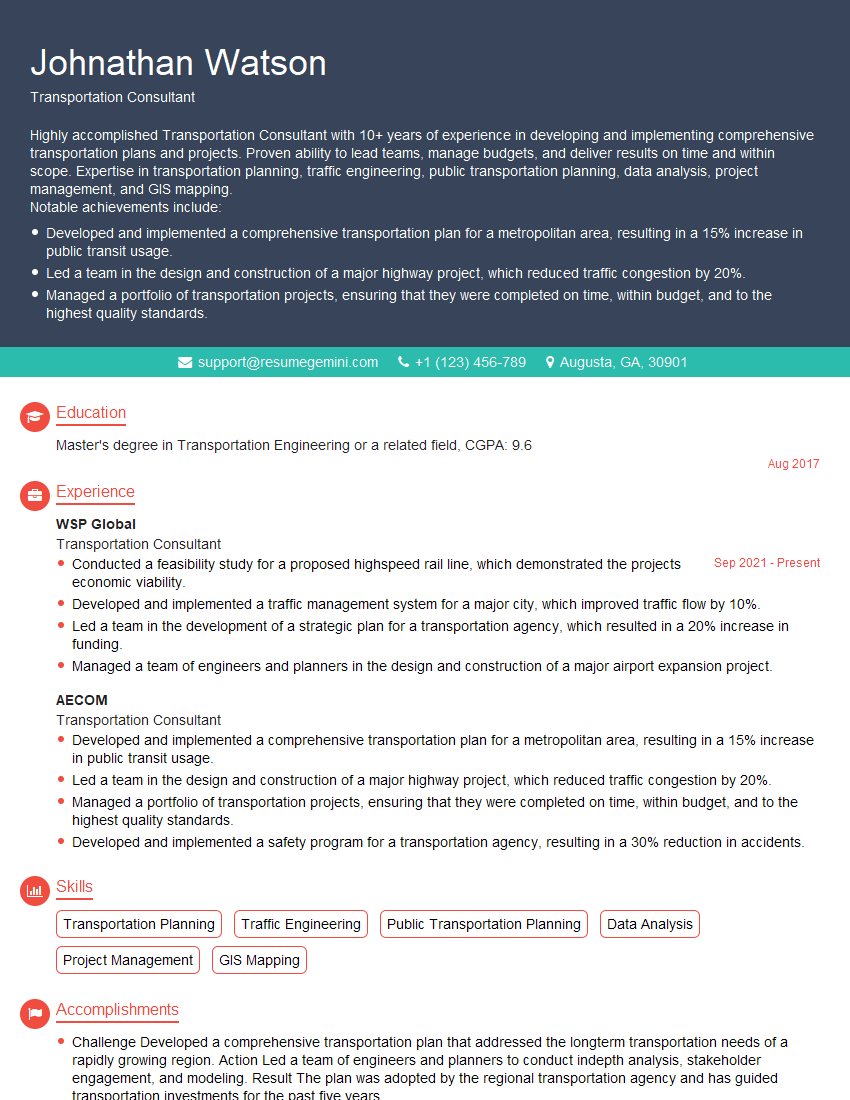
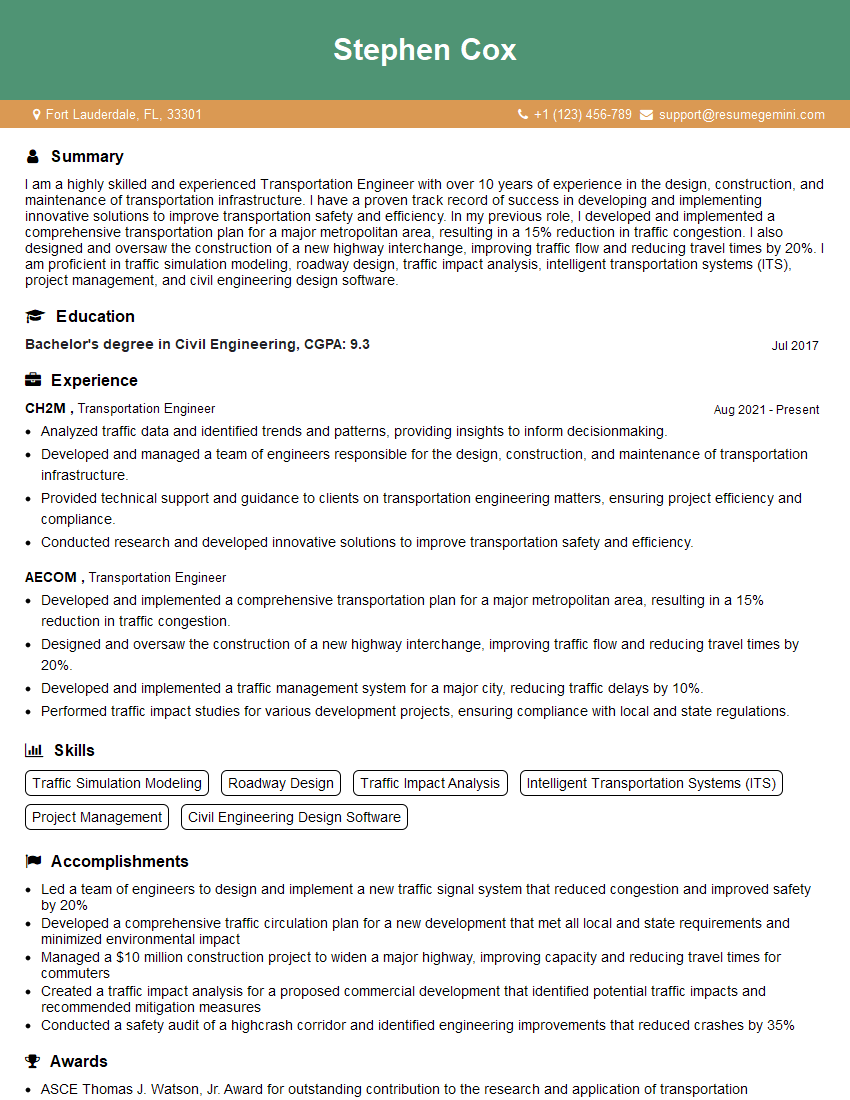
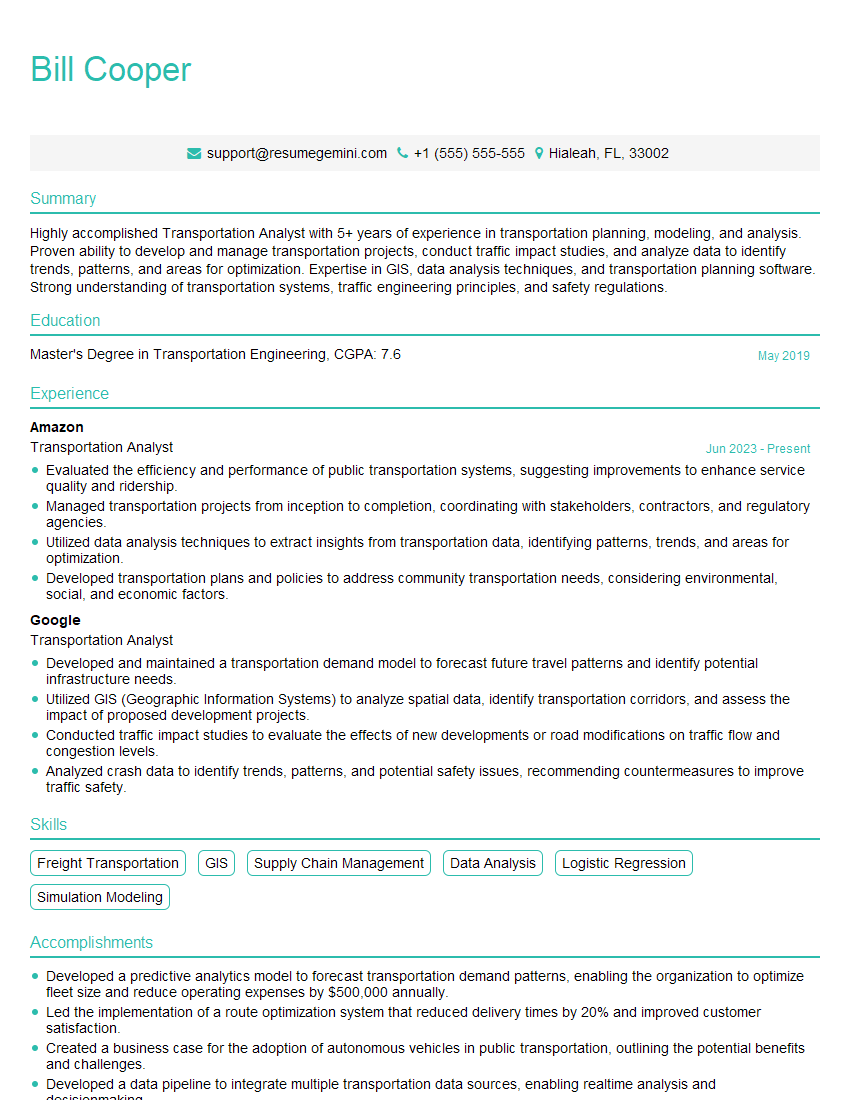
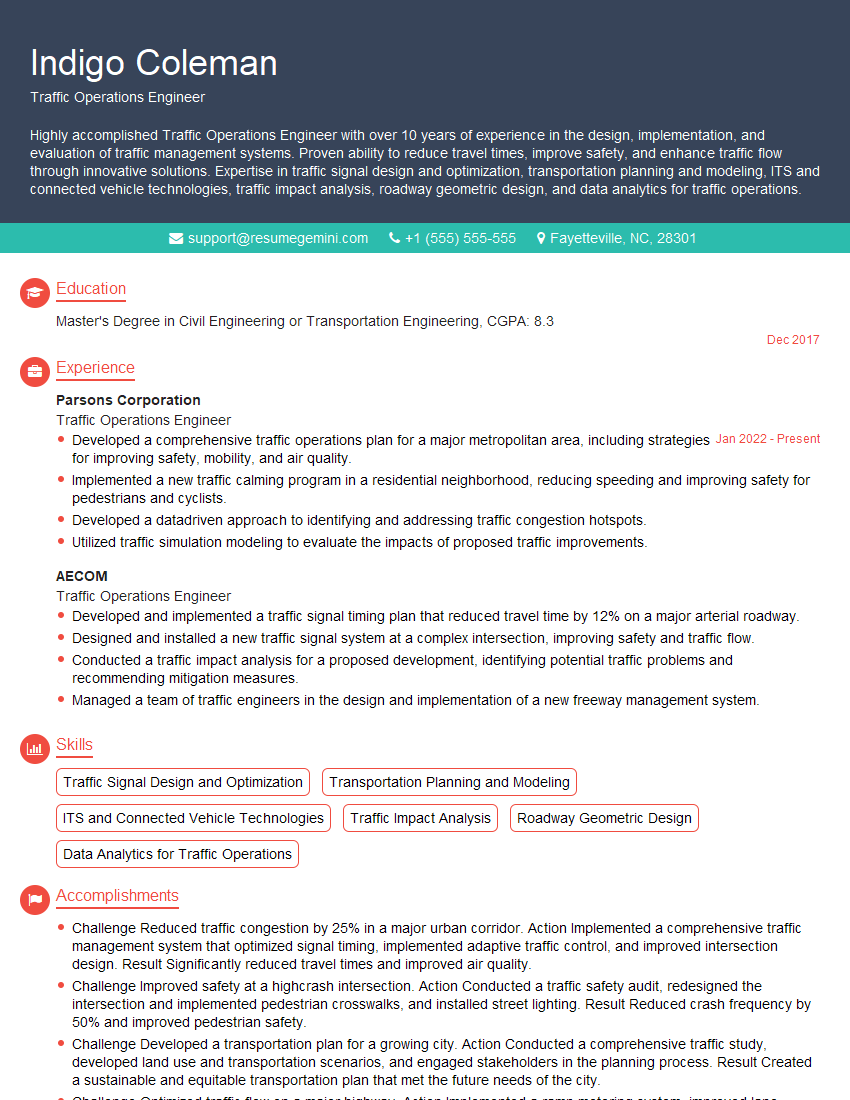
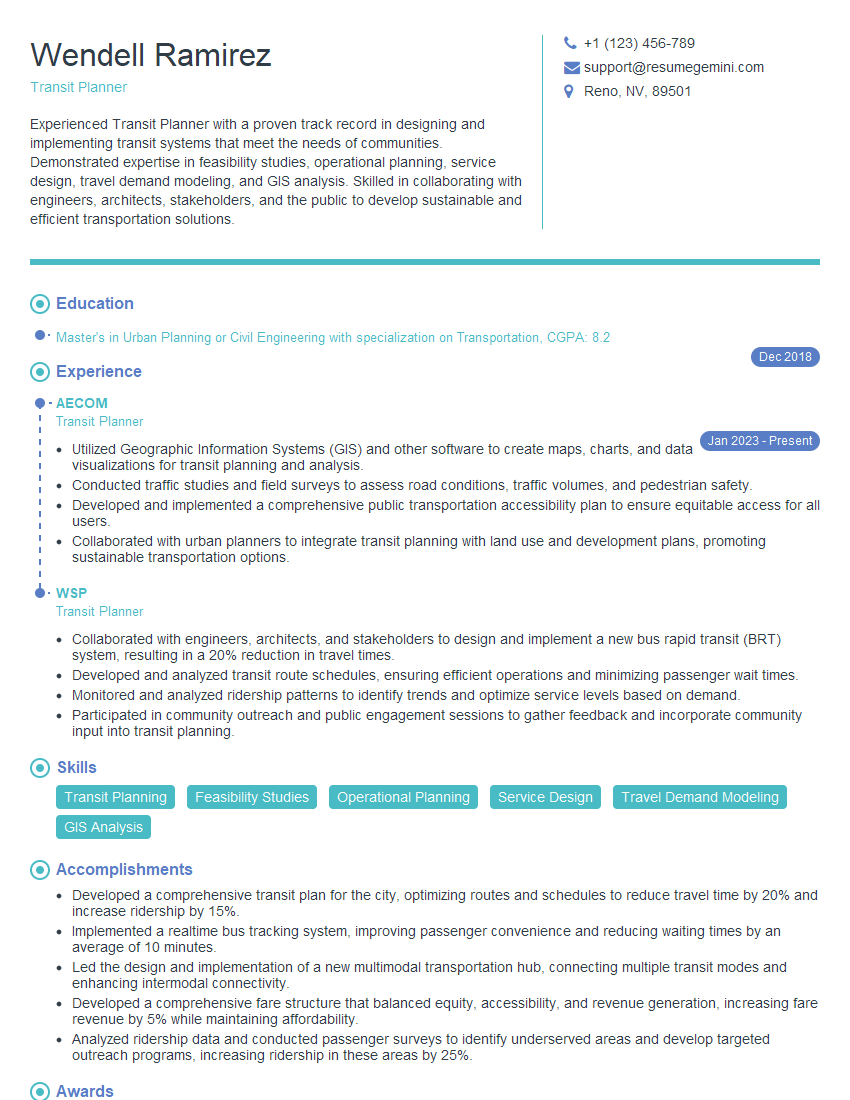
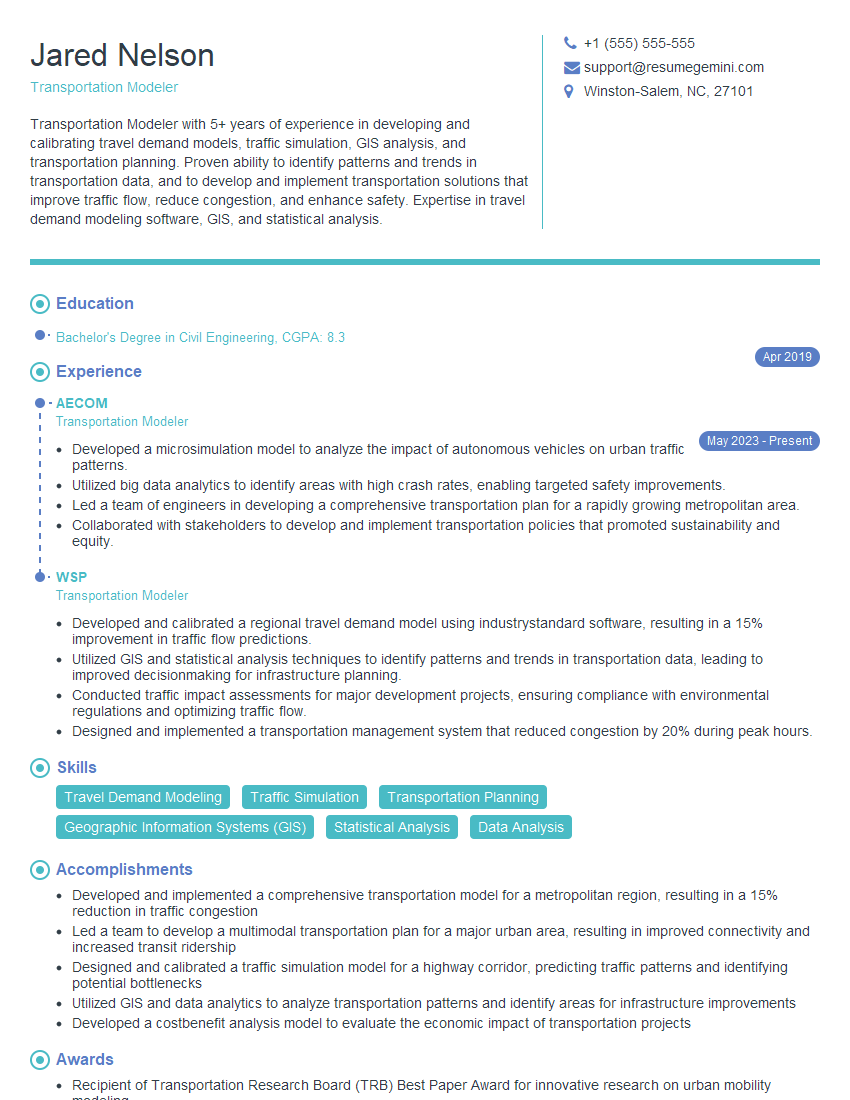
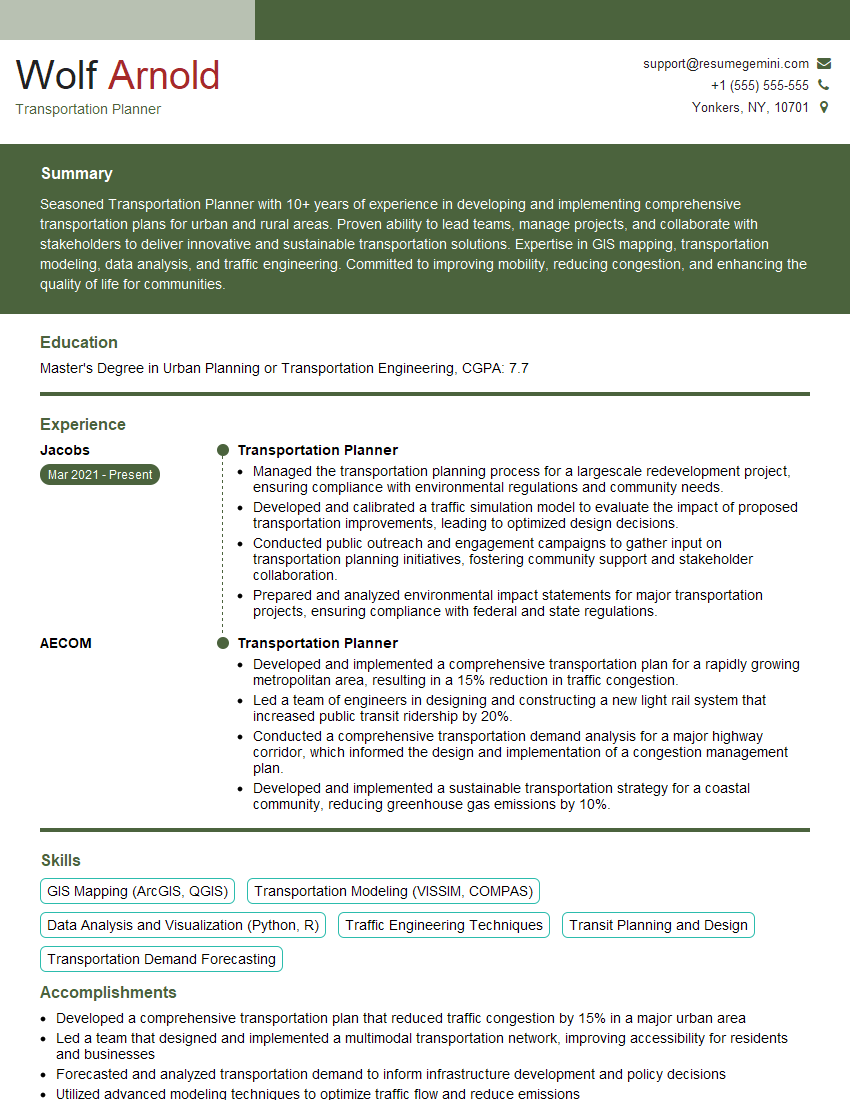
Mastering Transportation Planning and Modeling opens doors to exciting and impactful careers, allowing you to shape the future of transportation systems. To maximize your job prospects, crafting a strong, ATS-friendly resume is crucial. ResumeGemini is a trusted resource to help you build a professional and compelling resume that highlights your skills and experience effectively. Examples of resumes tailored specifically to Transportation Planning and Modeling are available to guide you through the process.
Explore more articles
Users Rating of Our Blogs
Share Your Experience
We value your feedback! Please rate our content and share your thoughts (optional).
What Readers Say About Our Blog
Hello,
We found issues with your domain’s email setup that may be sending your messages to spam or blocking them completely. InboxShield Mini shows you how to fix it in minutes — no tech skills required.
Scan your domain now for details: https://inboxshield-mini.com/
— Adam @ InboxShield Mini
Reply STOP to unsubscribe
Hi, are you owner of interviewgemini.com? What if I told you I could help you find extra time in your schedule, reconnect with leads you didn’t even realize you missed, and bring in more “I want to work with you” conversations, without increasing your ad spend or hiring a full-time employee?
All with a flexible, budget-friendly service that could easily pay for itself. Sounds good?
Would it be nice to jump on a quick 10-minute call so I can show you exactly how we make this work?
Best,
Hapei
Marketing Director
Hey, I know you’re the owner of interviewgemini.com. I’ll be quick.
Fundraising for your business is tough and time-consuming. We make it easier by guaranteeing two private investor meetings each month, for six months. No demos, no pitch events – just direct introductions to active investors matched to your startup.
If youR17;re raising, this could help you build real momentum. Want me to send more info?
Hi, I represent an SEO company that specialises in getting you AI citations and higher rankings on Google. I’d like to offer you a 100% free SEO audit for your website. Would you be interested?
Hi, I represent an SEO company that specialises in getting you AI citations and higher rankings on Google. I’d like to offer you a 100% free SEO audit for your website. Would you be interested?
good
