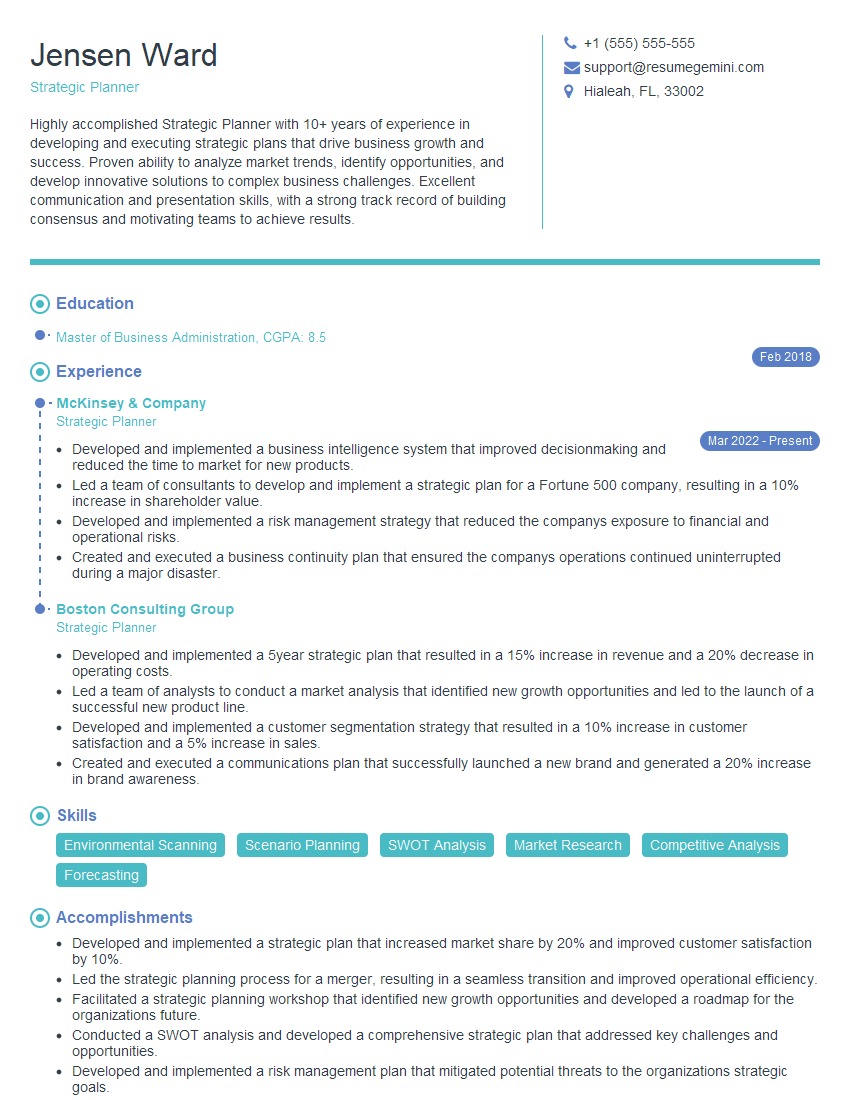
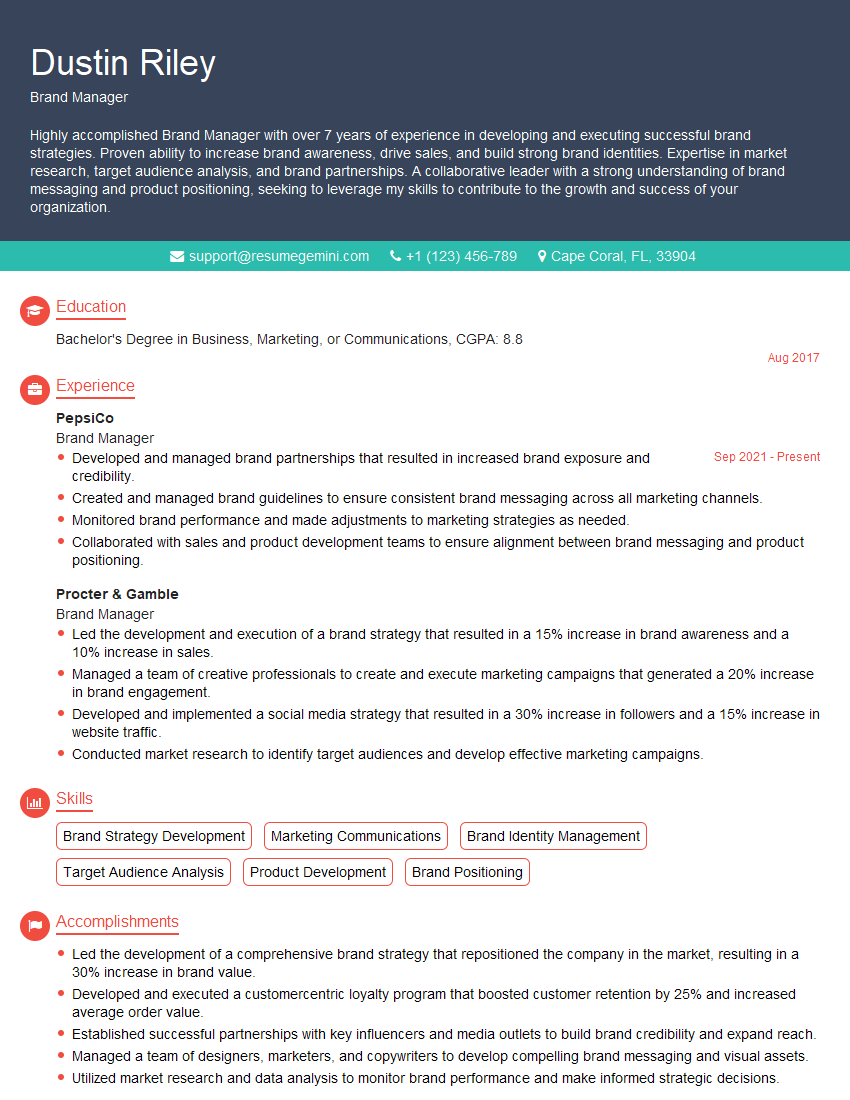
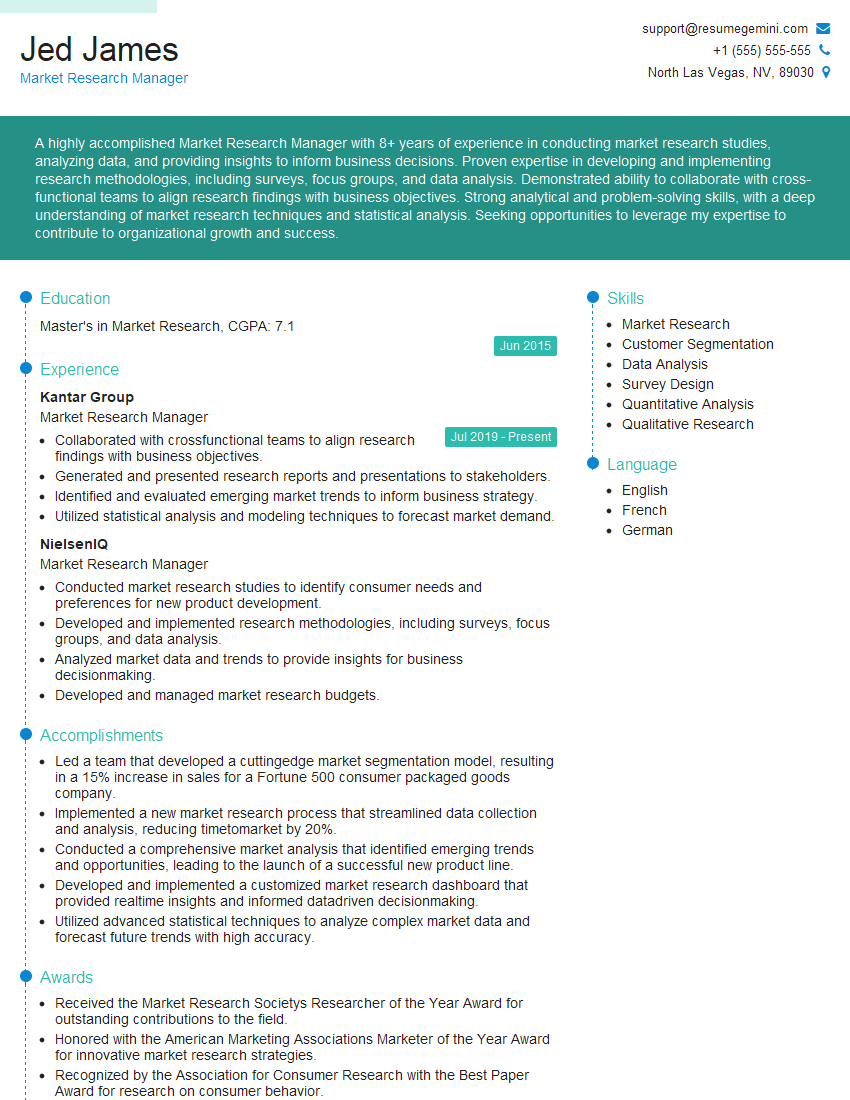
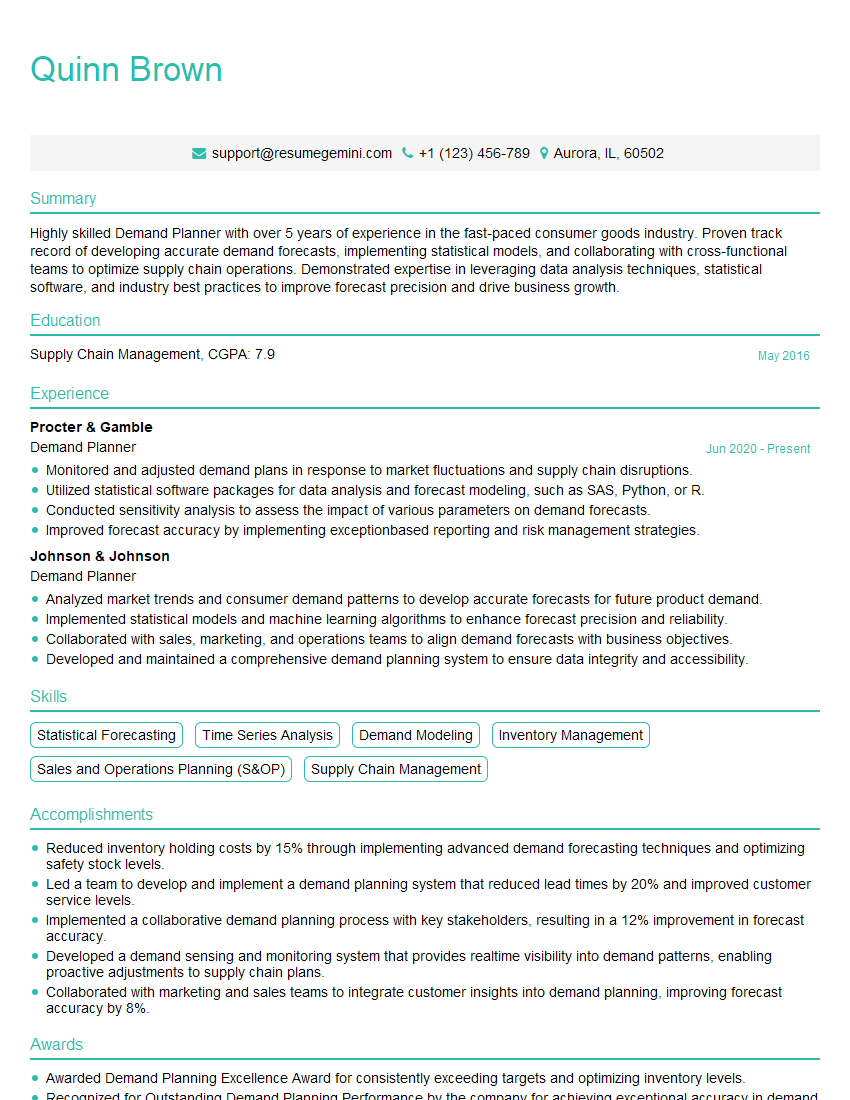
Every successful interview starts with knowing what to expect. In this blog, we’ll take you through the top Market Analysis and Consumer Behavior interview questions, breaking them down with expert tips to help you deliver impactful answers. Step into your next interview fully prepared and ready to succeed.
Questions Asked in Market Analysis and Consumer Behavior Interview
Q 1. Explain the difference between qualitative and quantitative market research.
Qualitative and quantitative market research are two distinct approaches to understanding consumer behavior and market trends. They differ fundamentally in their data collection methods and the type of insights they provide.
Qualitative research focuses on in-depth understanding of why consumers behave the way they do. It explores attitudes, opinions, and motivations through methods like focus groups, in-depth interviews, and ethnographic studies. The data is descriptive and rich in detail, but not easily statistically analyzed. Think of it like a detailed conversation – you gain a deep understanding, but it’s not easily summarized into numbers.
Quantitative research, on the other hand, emphasizes numerical data and statistical analysis. It aims to measure and quantify market phenomena, often using surveys, experiments, and observational studies. The data is objective and can be used to draw statistically significant conclusions. This is like a large-scale survey – you get a broad picture in numbers, but may miss the nuances.
In short: Qualitative research explores the ‘why,’ while quantitative research measures the ‘what’. Often, a mixed-methods approach, combining both qualitative and quantitative methods, provides the most comprehensive understanding of the market.
Q 2. Describe your experience with different market research methodologies (e.g., surveys, focus groups, experiments).
Throughout my career, I’ve extensively used various market research methodologies. My experience includes:
- Surveys: I’ve designed and implemented both online and offline surveys using tools like Qualtrics and SurveyMonkey to gather large-scale quantitative data on consumer preferences, brand awareness, and purchase intentions. For example, I once used a survey to understand customer satisfaction with a new product feature, allowing us to identify areas for improvement based on numerical ratings and open-ended feedback.
- Focus Groups: I’ve moderated focus groups to gain qualitative insights into consumer attitudes and perceptions towards products or services. This allows for deeper exploration of underlying reasons behind behaviors observed in quantitative research. For instance, I facilitated a focus group to explore the emotional connection consumers had with a particular brand, uncovering valuable qualitative insights that complemented our quantitative sales data.
- Experiments (A/B testing): I’ve designed and analyzed A/B tests to evaluate the effectiveness of different marketing messages, website designs, or product features. This allows us to make data-driven decisions about optimizing marketing campaigns and product development. For example, I conducted an A/B test on website landing pages, comparing conversion rates for different call-to-action buttons, resulting in a 15% increase in conversions.
My experience spans various industries, giving me a broad perspective on applying the most appropriate methodology to address specific research questions.
Q 3. How do you identify and segment target markets?
Identifying and segmenting target markets is a crucial step in effective marketing. It involves dividing the broader market into smaller, more homogenous groups based on shared characteristics. My approach involves a multi-step process:
- Market Research: I begin by conducting thorough market research to understand the overall market size, potential customer base, and existing competition. This involves both secondary research (using existing data sources like market reports) and primary research (conducting surveys, focus groups, etc.).
- Defining Segmentation Variables: I identify relevant segmentation variables, which can be demographic (age, gender, income, location), geographic (region, climate, urban/rural), psychographic (lifestyle, values, attitudes), or behavioral (purchase history, brand loyalty, usage rate). The choice of variables depends on the specific product or service and the overall marketing objectives.
- Developing Target Market Profiles: Based on the segmentation variables, I create detailed profiles of each target market segment. These profiles outline the key characteristics, needs, and preferences of each segment.
- Selecting Target Segments: I analyze the potential profitability and accessibility of each segment to select the most promising target markets. This often involves evaluating factors such as segment size, growth potential, and competitive intensity.
For example, when working on a new health food product, I might segment the market based on age, health consciousness, and income level, creating distinct target profiles like ‘health-conscious millennials’ or ‘budget-conscious families’.
Q 4. How do you analyze consumer behavior data to identify trends and patterns?
Analyzing consumer behavior data involves identifying patterns and trends that reveal how consumers make decisions and interact with products or brands. My approach focuses on several key techniques:
- Descriptive Statistics: I use descriptive statistics (mean, median, mode, standard deviation) to summarize and understand the basic characteristics of the data. This provides a general overview of consumer behavior patterns.
- Data Visualization: I leverage data visualization tools (e.g., charts, graphs, dashboards) to identify trends and patterns visually. This often reveals insights that may be missed through numerical analysis alone.
- Regression Analysis: I use regression analysis to model the relationship between different variables (e.g., advertising spending and sales, price and demand). This helps to understand the impact of one variable on another.
- Clustering Analysis: I employ clustering analysis to group consumers into distinct segments based on their similar behaviors and characteristics. This helps to identify distinct customer segments with unique needs and preferences.
- Time Series Analysis: To analyze trends over time, I use time series analysis, forecasting future consumer behavior based on historical data.
For example, analyzing website analytics data might reveal that customers who visited a specific product page were more likely to make a purchase. This insight could be used to optimize the website design and improve conversion rates.
Q 5. Describe a time you used market analysis to solve a business problem.
During a project for a major coffee chain, we were experiencing declining sales in their afternoon drive-thru traffic. Our initial market analysis using sales data and competitor analysis indicated no significant external factors. To solve this, I initiated a mixed-methods research project. Quantitative analysis of sales data revealed a drop in sales specifically between 2 PM and 4 PM. However, the ‘why’ remained elusive.
To complement the quantitative data, we conducted focus groups and customer surveys. This revealed that customers found the afternoon drive-thru experience slow due to long queues and that many customers felt the afternoon menu was less exciting than the morning menu. Armed with this combined qualitative and quantitative data, we were able to propose actionable solutions including streamlined drive-thru processes, an expanded afternoon menu with new drinks and snacks, and targeted afternoon promotions.
Within six months of implementing these changes, we observed a significant increase in afternoon drive-thru sales, exceeding the previous year’s figures by 18%. This success demonstrated the power of a comprehensive market analysis that leveraged both qualitative and quantitative data to identify and solve a business problem.
Q 6. What are the key factors to consider when conducting a competitive analysis?
A thorough competitive analysis is crucial for understanding your position in the market and identifying opportunities and threats. Key factors to consider include:
- Identifying Competitors: First, define your direct and indirect competitors. Direct competitors offer similar products or services to your target market, while indirect competitors offer substitutes that fulfill the same customer need.
- Analyzing Competitor Strengths and Weaknesses: Evaluate each competitor’s strengths and weaknesses using frameworks like SWOT analysis. This involves examining factors such as their market share, pricing strategies, product features, marketing efforts, and customer service.
- Market Share Analysis: Assess the market share held by each competitor to understand their relative strength and market dominance.
- Competitive Strategies: Analyze competitors’ strategies, including their product development, pricing, distribution, and promotion strategies. This can reveal their competitive advantages and disadvantages.
- Customer Perceptions: Examine customer perceptions of your competitors and their products or services. This understanding is vital for identifying areas where you can differentiate your offerings.
- Financial Performance: If possible, analyze competitors’ financial performance (revenues, profits, etc.) to gauge their overall health and competitiveness.
By systematically analyzing these factors, you can identify opportunities for competitive advantage, such as by entering underserved niches, developing innovative products, or implementing more effective marketing strategies.
Q 7. How do you interpret and present market research findings to stakeholders?
Interpreting and presenting market research findings effectively requires clear communication and a focus on actionable insights. My approach involves:
- Summarizing Key Findings: Condense the extensive data into concise, clear summaries focusing on the most significant findings and implications.
- Visualizations: Use charts, graphs, and other visuals to present complex data in an easily digestible format. Visuals make data more engaging and easier to understand.
- Actionable Recommendations: Translate findings into concrete, actionable recommendations. These should be clearly linked to the business objectives and offer specific strategies to address challenges or capitalize on opportunities.
- Storytelling: Frame the findings within a narrative that is engaging and relevant to the stakeholders. Use real-world examples and case studies to illustrate key points.
- Interactive Presentations: Use interactive elements like Q&A sessions or interactive dashboards to facilitate engagement and discussion.
- Tailoring to Audience: Adapt the presentation style and level of detail to the audience’s technical expertise and understanding of market analysis concepts.
For example, rather than just presenting raw sales figures, I would focus on showing the impact of specific marketing campaigns or product changes on sales growth. The ultimate goal is to help stakeholders understand the implications of the research and make informed decisions based on data-driven insights.
Q 8. Explain your understanding of market segmentation techniques (e.g., demographic, geographic, psychographic).
Market segmentation is the process of dividing a broad consumer or business market, normally consisting of existing and potential customers, into sub-groups of consumers based on some type of shared characteristics. This allows businesses to tailor their marketing efforts to specific groups, increasing efficiency and effectiveness. There are several key techniques:
- Demographic Segmentation: This involves dividing the market based on measurable population characteristics such as age, gender, income, education, occupation, family size, ethnicity, and religion. For example, a company selling luxury cars might target high-income individuals aged 35-55.
- Geographic Segmentation: This focuses on dividing the market based on geographic location, including factors like country, region, city, climate, and population density. A ski resort, for instance, would naturally focus on geographic areas with high snowfall and a population with disposable income for leisure activities.
- Psychographic Segmentation: This dives into the psychological aspects of consumers, considering their lifestyle, values, attitudes, interests, and personality traits. For example, a company selling eco-friendly products would target consumers who value sustainability and environmental consciousness.
- Behavioral Segmentation: This method segments the market based on consumers’ behavior, including their purchasing habits, usage rate, brand loyalty, and responsiveness to marketing campaigns. A subscription box service, for example, would focus on consumers who have demonstrated a preference for receiving regular deliveries of curated items.
Often, businesses use a combination of these techniques for a more nuanced understanding of their target market, creating detailed buyer personas.
Q 9. What are the limitations of using only secondary data in market analysis?
While secondary data (information gathered from existing sources like market research reports, government statistics, and industry publications) is a cost-effective starting point for market analysis, relying solely on it has significant limitations:
- Lack of Specificity: Secondary data may not be tailored to your specific needs or target market, lacking the detail required for informed decision-making. It may be too broad or not directly relevant.
- Data Accuracy and Reliability: The credibility of secondary data sources varies widely. It’s crucial to assess the source’s reputation, methodology, and potential biases. Outdated information is also a major concern.
- Limited Control Over Data Collection: You have no control over how the data was collected, potentially compromising its validity and interpretability. There might be gaps in the information or inconsistencies across different data sources.
- Potential for Bias: Secondary data might reflect the biases of the original researchers or organizations that collected it, leading to skewed interpretations and inaccurate conclusions.
To mitigate these limitations, it’s crucial to triangulate secondary data findings with primary research (data collected directly from the source, e.g., surveys, interviews). This ensures a more comprehensive and accurate understanding of the market.
Q 10. How do you validate market research findings?
Validating market research findings is critical to ensure the accuracy and reliability of your conclusions. This involves several steps:
- Triangulation: Compare findings from multiple sources and methods. If your survey data aligns with your focus group findings and secondary data analysis, it strengthens the validity of your results.
- Statistical Analysis: Use appropriate statistical methods to test the significance of your findings. Ensure your sample size is adequate and representative of your target population to avoid sampling bias.
- Peer Review: Share your findings and methodologies with colleagues or experts in the field to obtain independent validation and identify potential flaws.
- Real-World Testing: Test your hypotheses in a real-world setting through pilot programs or A/B testing. This allows you to assess the practical implications of your research findings.
- Cross-Validation: Use a subset of your data to create a model, and then test it on a separate, independent subset. This helps ensure your model is generalizable and not overfitted to the initial data.
By employing these validation techniques, you can substantially increase confidence in the reliability and accuracy of your market research insights.
Q 11. How do you measure the effectiveness of a marketing campaign using market analysis?
Measuring the effectiveness of a marketing campaign using market analysis requires a multi-faceted approach. Key metrics include:
- Sales Lift: Compare sales before, during, and after the campaign to assess its direct impact on revenue.
- Brand Awareness: Track changes in brand awareness through surveys, social media monitoring, and website traffic analysis.
- Website Traffic and Engagement: Monitor website visits, bounce rate, time on site, and conversion rates to assess the campaign’s influence on online activity.
- Lead Generation: Measure the number of leads generated as a result of the campaign, indicating its success in driving potential customers toward conversion.
- Customer Acquisition Cost (CAC): Calculate the cost of acquiring a new customer through the campaign, helping to evaluate the campaign’s return on investment (ROI).
- Return on Investment (ROI): Compare the overall cost of the campaign against the revenue it generated. A positive ROI indicates successful campaign performance.
- Social Media Engagement: Measure likes, shares, comments, and other interactions on social media platforms. This provides insights on user engagement with the campaign content.
By tracking these metrics and analyzing the data, you can gain a clear understanding of the campaign’s performance and identify areas for improvement in future marketing efforts.
Q 12. Explain the concept of consumer decision-making process.
The consumer decision-making process describes the steps a consumer takes when deciding whether or not to purchase a product or service. While models vary, a common framework includes:
- Need Recognition: The process begins with the consumer recognizing a need or want. This could be triggered by internal factors (e.g., hunger) or external factors (e.g., an advertisement).
- Information Search: The consumer seeks information about products or services that could satisfy their need. This might involve internal search (recalling past experiences) or external search (researching online or asking friends).
- Evaluation of Alternatives: The consumer compares different options based on factors like price, quality, features, and brand reputation.
- Purchase Decision: The consumer decides which product or service to purchase based on their evaluation.
- Post-Purchase Evaluation: After the purchase, the consumer evaluates their satisfaction with the product or service. This can influence future purchasing decisions.
Understanding this process is crucial for marketers, as it allows them to tailor their messaging and strategies to influence consumer behavior at each stage.
Q 13. How do you incorporate consumer insights into product development?
Incorporating consumer insights into product development is essential for creating successful products that meet market demands. This involves several steps:
- Market Research: Conduct thorough market research to understand consumer needs, preferences, and pain points. This may involve surveys, focus groups, interviews, and competitive analysis.
- Persona Development: Create detailed buyer personas representing your target audience. These personas should describe the demographics, psychographics, and behavioral characteristics of your ideal customer.
- Concept Testing: Test different product concepts with your target audience to gather feedback and identify preferred features and functionalities.
- Prototype Development: Develop prototypes based on consumer feedback and test them with users to identify areas for improvement.
- Iterative Design: Use iterative design, incorporating feedback from each stage of the product development process to refine the final product. This ensures the product aligns with consumer needs and expectations.
For example, a company developing a new smartphone might conduct surveys to understand user preferences for features like camera quality, battery life, and screen size, incorporating that feedback directly into design and development.
Q 14. How do you use market analysis to forecast future trends?
Market analysis plays a crucial role in forecasting future trends. This involves analyzing various data sources and applying forecasting techniques:
- Trend Analysis: Identify current trends in the market by analyzing sales data, consumer behavior, technological advancements, and economic indicators.
- Competitive Analysis: Analyze the actions and strategies of your competitors to anticipate their future moves and potential impacts on the market.
- Data Mining and Predictive Modeling: Employ data mining techniques to identify patterns and relationships in historical data, and use this to build predictive models forecasting future market behavior.
- Scenario Planning: Create different scenarios based on various potential future events and their impact on the market. This provides a range of potential outcomes to prepare for.
- Expert Interviews: Consult with industry experts and thought leaders to gather their perspectives on future trends and challenges.
For example, analyzing past sales data of winter coats combined with weather forecasts and economic projections can help a clothing retailer anticipate demand and plan inventory accordingly. Combining these approaches creates a robust foundation for informed decision making and future planning.
Q 15. What are the key performance indicators (KPIs) you track in market analysis?
Key Performance Indicators (KPIs) in market analysis are quantifiable metrics that track the success of marketing strategies and overall market performance. Choosing the right KPIs depends heavily on the specific business goals and the stage of the product lifecycle. However, some common and crucial KPIs include:
- Market Share: This represents the percentage of the total market controlled by a specific company or product. For example, a company might aim to increase its market share from 10% to 15% within a year. This KPI helps assess competitive standing.
- Customer Acquisition Cost (CAC): This measures the cost of acquiring a new customer. Lower CAC indicates more efficient marketing spend. A company might strive to reduce its CAC by optimizing its digital advertising campaigns.
- Customer Lifetime Value (CLTV): This predicts the total revenue a customer will generate throughout their relationship with a business. High CLTV is a sign of customer loyalty and successful retention strategies. For instance, a subscription-based service would track CLTV closely to gauge the profitability of its user base.
- Conversion Rate: This reflects the percentage of website visitors or leads who complete a desired action, such as making a purchase or signing up for a newsletter. Optimizing landing pages and user experience can significantly improve conversion rates.
- Brand Awareness: While harder to directly quantify, brand awareness can be measured through surveys, social media mentions, and website traffic. Growth in brand awareness points to successful marketing efforts and building brand recognition.
- Return on Investment (ROI): This fundamental metric measures the profitability of a marketing campaign or initiative. A positive ROI indicates a successful investment.
Tracking these KPIs allows for data-driven decision-making, enabling businesses to adapt their strategies, optimize resource allocation, and ultimately, achieve their market objectives.
Career Expert Tips:
- Ace those interviews! Prepare effectively by reviewing the Top 50 Most Common Interview Questions on ResumeGemini.
- Navigate your job search with confidence! Explore a wide range of Career Tips on ResumeGemini. Learn about common challenges and recommendations to overcome them.
- Craft the perfect resume! Master the Art of Resume Writing with ResumeGemini’s guide. Showcase your unique qualifications and achievements effectively.
- Don’t miss out on holiday savings! Build your dream resume with ResumeGemini’s ATS optimized templates.
Q 16. Describe your experience with market sizing and forecasting techniques.
Market sizing and forecasting are critical for strategic planning and investment decisions. My experience encompasses various techniques, from top-down approaches to bottom-up methodologies and the use of sophisticated statistical models.
Top-down approaches start with overall market data (e.g., total market revenue) and then break it down into segments based on factors like demographics or product usage. This is useful when detailed granular data is limited.
Bottom-up approaches involve estimating the market size by summing up the potential sales of individual customers or market segments. This provides a more granular, but potentially less reliable, estimate if the sampling is not representative.
I frequently employ regression analysis to identify correlations between market indicators (like GDP growth, disposable income, and consumer confidence) and product demand to forecast future market size. I also utilize time series analysis techniques, such as ARIMA modeling, to forecast future trends based on historical data. The choice of technique depends on data availability, the complexity of the market, and the desired level of accuracy.
For example, in a recent project for a new sustainable energy product, we used a combination of top-down (estimating the total market for renewable energy solutions) and bottom-up (analyzing the potential demand from specific sectors like residential and commercial buildings) approaches. We then refined our forecast using regression analysis to account for factors like government subsidies and technological advancements.
Q 17. How do you handle conflicting data points in market research?
Conflicting data points in market research are common and require a systematic approach to resolution. My strategy involves a multi-step process:
- Data Source Evaluation: First, I critically assess the credibility and reliability of each data source. This includes evaluating the methodology used to collect the data, the sample size, and potential biases. For example, self-reported data from surveys might be less reliable than data from sales transactions.
- Data Cleaning and Triangulation: I clean the data to identify and remove outliers or errors. I then look for patterns and potential explanations for the inconsistencies. Triangulation, using multiple data sources to confirm findings, is key here. If multiple reliable sources indicate conflicting results, it highlights the need for further investigation.
- Qualitative Research: Sometimes quantitative data needs further contextualization. I often supplement quantitative data with qualitative insights from focus groups, customer interviews, or social media analysis to gain a deeper understanding of conflicting trends.
- Sensitivity Analysis: To understand the impact of conflicting data points on the overall conclusions, I perform sensitivity analysis. This involves running analyses with different assumptions regarding the conflicting data to assess the robustness of the findings.
- Transparent Reporting: Finally, I always transparently report any conflicting data points and the resolution strategy used in the final analysis. This ensures the integrity and reliability of the results.
Handling conflicting data is crucial because it directly affects the validity of the market analysis and the strategic decisions made based on it.
Q 18. What statistical software or tools are you proficient in?
I’m proficient in several statistical software packages and tools including:
- R: A powerful open-source language and environment for statistical computing and graphics. I leverage R for complex statistical modeling, data visualization, and custom script development.
- Python (with libraries like Pandas, NumPy, and Scikit-learn): Python offers excellent capabilities for data manipulation, analysis, and machine learning. I use it extensively for data cleaning, exploratory data analysis, and building predictive models.
- SPSS: A comprehensive statistical software package commonly used for survey data analysis and other statistical tasks. I use SPSS for its robust capabilities in analyzing large datasets and conducting advanced statistical tests.
- SQL: I’m adept at writing SQL queries to efficiently extract and manipulate data from large databases. This is essential for accessing and preparing data for analysis.
- Tableau and Power BI: For data visualization and creating interactive dashboards, I utilize Tableau and Power BI to present findings effectively and in a user-friendly manner.
My proficiency in these tools ensures I can effectively handle diverse analytical tasks and deliver robust and reliable insights.
Q 19. How do you stay up-to-date with current market trends and consumer behavior changes?
Staying updated on market trends and consumer behavior changes is an ongoing process, and I utilize several strategies:
- Industry Publications and Reports: I regularly follow industry-specific publications, journals, and research reports (e.g., Nielsen, Statista) to understand emerging trends and shifts in consumer preferences.
- Market Research Databases: I leverage access to databases like Mintel and Euromonitor for in-depth market research and consumer behavior data.
- Social Media Monitoring: I actively monitor social media platforms to gauge public sentiment, identify emerging trends, and understand consumer conversations around relevant products and brands.
- Competitor Analysis: I regularly analyze competitors’ strategies, product launches, and marketing campaigns to identify best practices and anticipate potential shifts in the market.
- Conferences and Webinars: Attending industry conferences and webinars allows me to network with experts and stay abreast of the latest developments.
- Newsletters and Blogs: Subscribing to relevant newsletters and blogs keeps me informed about the latest news, research, and insights.
Combining these methods gives me a comprehensive understanding of the dynamic market landscape and allows me to anticipate future changes in consumer behavior effectively.
Q 20. Describe your experience working with large datasets.
I have extensive experience working with large datasets, often involving millions of data points. My approach focuses on efficiency and scalability. I use tools like:
- Distributed Computing Frameworks (e.g., Spark): For extremely large datasets that don’t fit into a single machine’s memory, I utilize distributed computing frameworks to process the data in parallel across multiple machines, significantly reducing processing time.
- Database Management Systems (DBMS): I’m proficient in working with various DBMS, including relational databases (like MySQL, PostgreSQL) and NoSQL databases (like MongoDB), to store and manage large volumes of data efficiently.
- Data Sampling Techniques: When dealing with exceptionally large datasets, appropriate data sampling is often employed to create a representative subset that is manageable for analysis while still providing meaningful results.
- Data Wrangling and Preprocessing: A significant portion of my workflow involves efficiently cleaning, transforming, and preparing the data for analysis. This includes handling missing values, outliers, and inconsistencies.
In a past project involving customer transaction data for a major e-commerce company, I used a combination of Spark and SQL to analyze over 50 million records to identify customer segmentation patterns and optimize targeted marketing campaigns.
Q 21. How do you ensure data accuracy and reliability in market analysis?
Ensuring data accuracy and reliability is paramount in market analysis. My approach is based on several key principles:
- Data Source Validation: I carefully evaluate the credibility of each data source. This involves examining the data collection methodology, the sample size, the potential for bias, and the reputation of the source. Government statistics, for example, are often considered more reliable than self-reported data from online surveys.
- Data Cleaning and Validation: I rigorously clean and validate the data to identify and correct errors, inconsistencies, and outliers. This includes checking for missing values, duplicate entries, and logical inconsistencies.
- Data Transformation and Standardization: I ensure data consistency by transforming and standardizing variables, ensuring compatibility between datasets from different sources.
- Cross-Validation and Triangulation: I use multiple data sources to confirm findings wherever possible. This cross-validation increases confidence in the accuracy of the analysis.
- Robust Statistical Methods: I employ statistical methods that are less sensitive to outliers and errors, and I carefully consider the assumptions underlying the chosen methods.
- Documentation and Transparency: I meticulously document my data sources, cleaning procedures, and analysis steps, ensuring complete transparency and reproducibility of the results.
By meticulously following these steps, I strive to produce market analyses that are accurate, reliable, and support robust decision-making.
Q 22. Explain your understanding of A/B testing and its application in market analysis.
A/B testing, also known as split testing, is a randomized experiment where two versions of a variable (e.g., website headline, email subject line, product image) are shown to different groups of users to determine which performs better. It’s a powerful tool in market analysis because it allows for data-driven decision-making, minimizing guesswork and maximizing impact.
In market analysis, A/B testing can be applied to various aspects, such as:
- Website Optimization: Testing different layouts, calls-to-action, or images to improve conversion rates.
- Marketing Campaigns: Comparing the effectiveness of different email subject lines, ad copy, or landing pages.
- Product Development: Testing different product features, pricing strategies, or packaging designs.
For example, imagine an e-commerce company A/B testing two different versions of their product page. Version A features a large hero image, while Version B features multiple smaller images showcasing different product angles. By tracking metrics like click-through rates and conversion rates, the company can determine which version performs better and optimize their product page accordingly. This ensures that resources are focused on what resonates best with the target audience.
Q 23. How do you identify unmet customer needs using market research?
Identifying unmet customer needs is crucial for innovation and competitive advantage. This involves a multi-pronged approach using various market research techniques. We can leverage qualitative research methods like:
- In-depth interviews: These allow for detailed exploration of customer experiences, pain points, and aspirations.
- Focus groups: These provide a platform for group discussions and identifying common themes among customers.
- Ethnographic studies: These involve observing customers in their natural environment to understand their behavior and needs in context.
Quantitative methods like surveys can help quantify the prevalence of specific needs and preferences. Analyzing existing customer data, such as customer service interactions or online reviews, can also provide valuable insights into common complaints and unmet expectations. The key is to triangulate findings from multiple sources to develop a robust understanding of customer needs. For instance, if numerous customer service tickets report difficulty using a specific software feature, combined with focus group discussions confirming this frustration, it clearly signals an unmet need for improved usability and user-friendliness.
Q 24. How do you determine the sample size for a market research study?
Determining the appropriate sample size for market research is crucial for ensuring the reliability and validity of the results. A sample that’s too small may not accurately represent the target population, while a sample that’s too large can be unnecessarily expensive and time-consuming. Several factors influence sample size determination:
- Population size: The larger the population, the larger the sample size generally needed.
- Desired confidence level: The higher the desired confidence level (e.g., 95%, 99%), the larger the sample size required.
- Margin of error: A smaller margin of error requires a larger sample size. A margin of error describes how much the sample results might differ from the true population values.
- Expected variability: If the population is highly diverse, a larger sample size is needed to capture this variability.
Statistical formulas, often available in statistical software packages, are used to calculate the required sample size based on these factors. There are online sample size calculators that simplify this process. It’s also important to consider practical factors like budget and time constraints when finalizing the sample size.
Q 25. What is your experience with conjoint analysis?
Conjoint analysis is a powerful statistical technique used to understand how consumers make trade-offs among different product attributes. It’s particularly useful for new product development and pricing strategies. I have extensive experience designing and interpreting conjoint studies. The process involves presenting respondents with a series of hypothetical product profiles, each with varying levels of different attributes (e.g., price, features, brand). Respondents rank or rate these profiles, and sophisticated statistical models are used to estimate the relative importance of each attribute in driving consumer choice. This allows us to understand which features are most valued and how much consumers are willing to pay for them. For example, in developing a new smartphone, conjoint analysis can help determine the optimal balance between screen size, camera quality, battery life, and price to maximize consumer appeal and profitability.
Q 26. How do you handle ethical considerations in market research?
Ethical considerations are paramount in market research. My approach is guided by principles of informed consent, confidentiality, and data integrity. Before initiating any research, participants are fully informed about the study’s purpose, procedures, and their rights (including the right to withdraw at any time). Data collected is anonymized or pseudonymized to protect participant privacy and confidentiality. Transparency and honesty are crucial in reporting the results and avoiding any misleading interpretations. I always adhere to relevant ethical guidelines and regulations, such as those provided by professional organizations like the American Marketing Association. For example, I would never use deceptive practices or misrepresent the purpose of the research. Ensuring ethical conduct builds trust with respondents, which is vital for obtaining accurate and reliable data.
Q 27. How would you approach analyzing customer reviews to identify areas for product improvement?
Analyzing customer reviews to identify areas for product improvement requires a structured approach. I would begin by:
- Data Collection: Gathering customer reviews from various sources (e.g., online marketplaces, social media, app stores).
- Text Analysis: Employing text mining and natural language processing (NLP) techniques to identify recurring themes, sentiments, and keywords. This might involve sentiment analysis to gauge whether reviews are positive, negative, or neutral.
- Categorization: Grouping similar reviews based on the identified themes (e.g., usability issues, feature requests, performance problems).
- Prioritization: Analyzing the frequency and intensity of each theme to prioritize areas for improvement. Reviews expressing strong negative sentiments should be prioritized.
- Actionable Insights: Formulating concrete recommendations for product improvement based on the insights gleaned from the analysis. This might involve specific design changes, bug fixes, or new feature development.
For example, if a significant number of reviews mention difficulties navigating a particular website section, this indicates a clear need for improved website design and user interface. By systematically analyzing customer feedback, we can transform complaints into opportunities for product enhancement and increased customer satisfaction.
Q 28. Describe your experience with using market research to inform pricing strategies.
Market research plays a vital role in informing effective pricing strategies. I have significant experience leveraging market research data to guide pricing decisions. This can involve:
- Price Sensitivity Analysis: Determining how changes in price affect consumer demand. This might involve conjoint analysis or surveys to gauge willingness-to-pay for different price points.
- Competitor Analysis: Understanding competitor pricing strategies and identifying opportunities for differentiation. This requires thorough market research to understand competitor offerings and pricing structures.
- Value-Based Pricing: Setting prices based on the perceived value of the product or service to the customer. Market research helps determine what features and benefits customers value most and are willing to pay a premium for.
- Cost-Plus Pricing: Determining the cost of production and adding a markup to determine the price. While cost-plus pricing is simpler, market research is still important to ensure that the final price is competitive and acceptable to consumers.
For example, understanding the price sensitivity of a target market can help determine the optimal price point to maximize revenue. If research reveals that customers are highly price-sensitive, a lower price might be more effective than a higher price even if it impacts margins. Conversely, if customers value specific features highly, a premium price might be justified.
Key Topics to Learn for Market Analysis and Consumer Behavior Interview
- Market Segmentation & Targeting: Understanding different segmentation approaches (demographic, psychographic, behavioral) and their application in targeting specific consumer groups. Practical application: Develop a targeted marketing campaign for a new product based on identified segments.
- Consumer Research Methods: Familiarize yourself with qualitative (focus groups, interviews) and quantitative (surveys, experiments) research methodologies. Practical application: Design a research plan to assess consumer preferences for a particular product category.
- Analyzing Market Trends & Data: Mastering data analysis techniques to identify market trends, growth opportunities, and competitive landscapes. Practical application: Interpret market research data to inform strategic business decisions.
- Consumer Behavior Theories: Grasp key theoretical frameworks like Maslow’s Hierarchy of Needs, the Theory of Planned Behavior, and the Diffusion of Innovation. Practical application: Explain how a specific marketing campaign leverages a chosen theory to influence consumer behavior.
- Competitive Analysis: Developing a deep understanding of competitive strategies, strengths, and weaknesses. Practical application: Conduct a competitive analysis to identify opportunities for differentiation and market penetration.
- Forecasting & Predictive Modeling: Learn how to use various forecasting techniques to predict future market trends and consumer demand. Practical application: Develop a sales forecast for a new product launch based on market research and predictive models.
- Marketing Analytics & KPIs: Understanding key performance indicators (KPIs) and their application in measuring marketing campaign effectiveness. Practical application: Analyze marketing data to determine the ROI of a specific campaign and suggest areas for improvement.
Next Steps
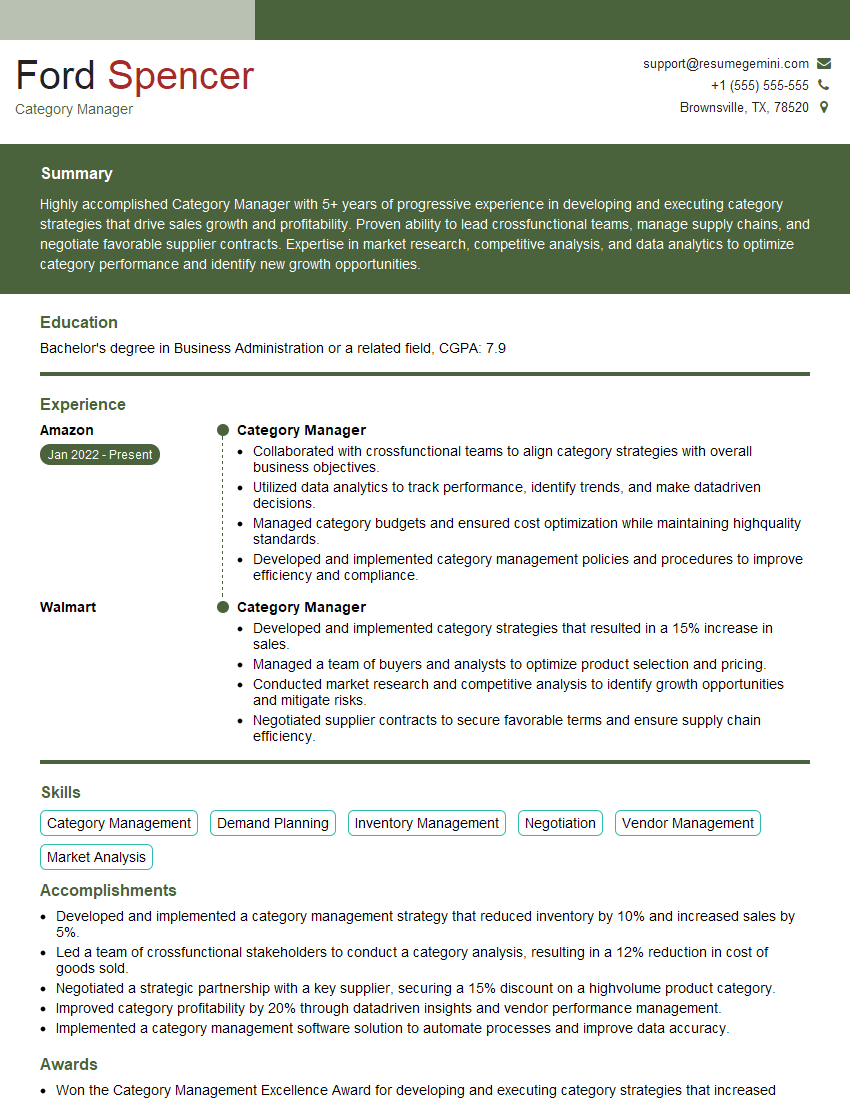
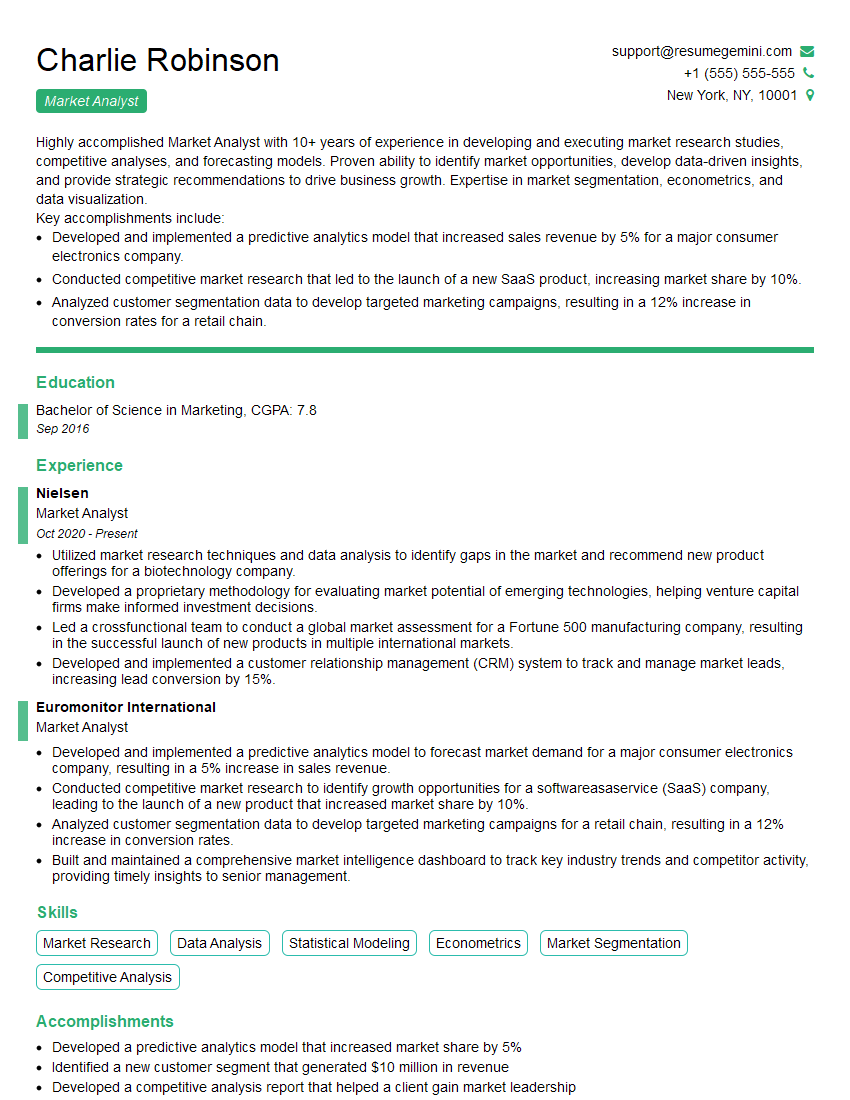
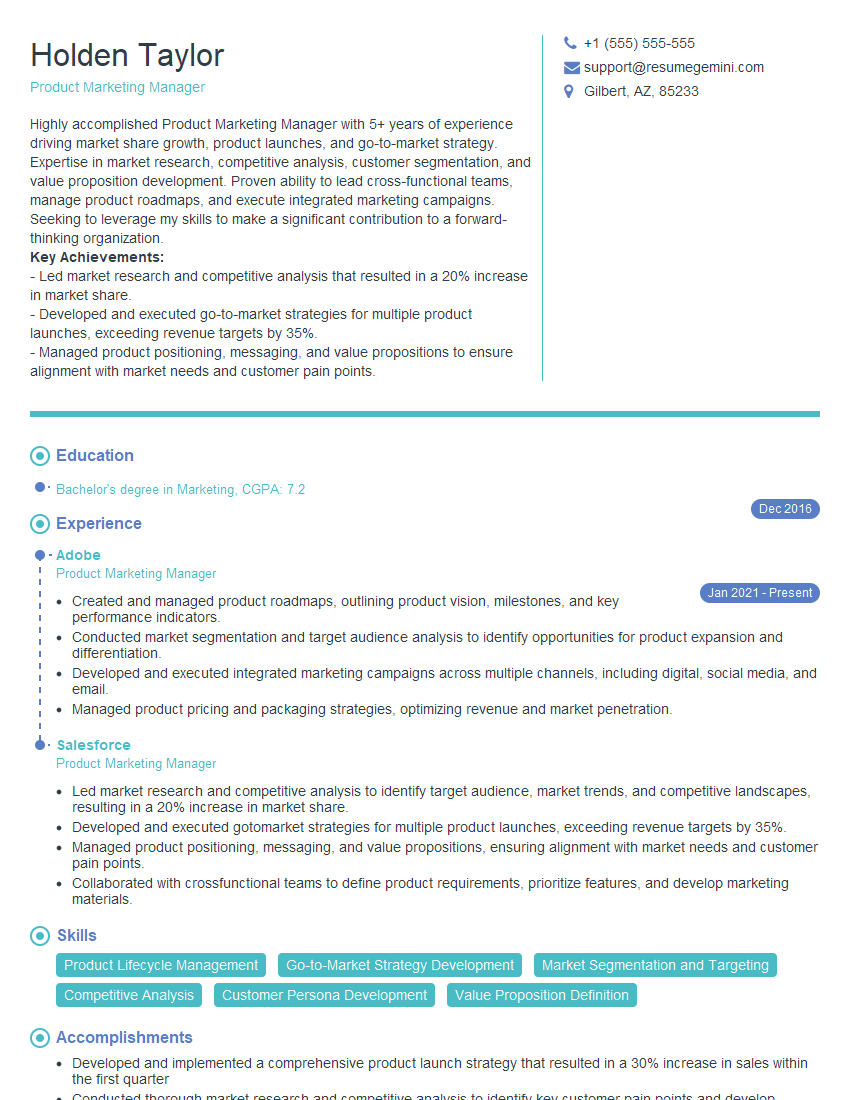
Mastering Market Analysis and Consumer Behavior is crucial for a successful career in marketing, market research, and related fields. A strong understanding of these concepts allows you to make data-driven decisions, identify emerging opportunities, and contribute significantly to organizational growth. To enhance your job prospects, create an ATS-friendly resume that highlights your relevant skills and experience. ResumeGemini is a trusted resource to help you build a professional and impactful resume. Examples of resumes tailored to Market Analysis and Consumer Behavior are available to guide you through the process. Investing time in crafting a compelling resume significantly increases your chances of landing your dream role.
Explore more articles
Users Rating of Our Blogs
Share Your Experience
We value your feedback! Please rate our content and share your thoughts (optional).
What Readers Say About Our Blog
Hello,
We found issues with your domain’s email setup that may be sending your messages to spam or blocking them completely. InboxShield Mini shows you how to fix it in minutes — no tech skills required.
Scan your domain now for details: https://inboxshield-mini.com/
— Adam @ InboxShield Mini
Reply STOP to unsubscribe
Hi, are you owner of interviewgemini.com? What if I told you I could help you find extra time in your schedule, reconnect with leads you didn’t even realize you missed, and bring in more “I want to work with you” conversations, without increasing your ad spend or hiring a full-time employee?
All with a flexible, budget-friendly service that could easily pay for itself. Sounds good?
Would it be nice to jump on a quick 10-minute call so I can show you exactly how we make this work?
Best,
Hapei
Marketing Director
Hey, I know you’re the owner of interviewgemini.com. I’ll be quick.
Fundraising for your business is tough and time-consuming. We make it easier by guaranteeing two private investor meetings each month, for six months. No demos, no pitch events – just direct introductions to active investors matched to your startup.
If youR17;re raising, this could help you build real momentum. Want me to send more info?
Hi, I represent an SEO company that specialises in getting you AI citations and higher rankings on Google. I’d like to offer you a 100% free SEO audit for your website. Would you be interested?
Hi, I represent an SEO company that specialises in getting you AI citations and higher rankings on Google. I’d like to offer you a 100% free SEO audit for your website. Would you be interested?
good
