Every successful interview starts with knowing what to expect. In this blog, we’ll take you through the top Questionnaires interview questions, breaking them down with expert tips to help you deliver impactful answers. Step into your next interview fully prepared and ready to succeed.
Questions Asked in Questionnaires Interview
Q 1. Explain the difference between open-ended and closed-ended questions in a questionnaire.
Open-ended and closed-ended questions represent two fundamental approaches to gathering information in questionnaires. Open-ended questions allow respondents to answer in their own words, providing rich qualitative data. Closed-ended questions, conversely, offer a pre-defined set of response options, yielding quantitative data easier to analyze statistically.
Open-ended Example: “What are your thoughts on the new company policy?” This prompts a detailed, nuanced response. Analysis involves thematic coding or qualitative content analysis, looking for recurring ideas and sentiments.
Closed-ended Example: “How satisfied are you with the new company policy? (Very Satisfied, Satisfied, Neutral, Dissatisfied, Very Dissatisfied)” This provides structured data easily summarized with frequencies and percentages.
Choosing between question types depends on your research goals. Open-ended questions are valuable for exploratory research or gaining in-depth understanding of perspectives, while closed-ended questions are better for large-scale surveys needing concise, quantifiable results. Often, a mix of both is used for a balanced approach.
Q 2. What are the key considerations when designing a questionnaire for online administration?
Designing online questionnaires requires careful consideration of several factors to maximize response rates and data quality. Key considerations include:
- User Experience (UX): The questionnaire should be visually appealing, easy to navigate, and mobile-friendly. Avoid lengthy questionnaires or complex layouts that might lead to respondent fatigue or abandonment. Use clear and concise language.
- Accessibility: Ensure your questionnaire is accessible to individuals with disabilities. This includes using appropriate alt text for images, providing sufficient color contrast, and offering alternative input methods.
- Progress Indicators: Display a progress bar to show respondents how far they are in the process, encouraging completion.
- Branching Logic: Implement conditional logic to route respondents to relevant questions based on their previous answers. This personalizes the experience and improves efficiency.
- Data Validation: Use input validation to ensure that respondents provide data in the correct format (e.g., numbers for numerical questions, valid email addresses). Error messages should be clear and helpful.
- Security and Privacy: Use secure platforms and clearly communicate data privacy policies to build trust and encourage participation.
- Testing: Thoroughly test the questionnaire before deployment to identify and fix any usability or technical issues.
Q 3. How do you ensure the reliability and validity of a questionnaire?
Reliability and validity are crucial for ensuring the credibility of a questionnaire. Reliability refers to the consistency of a measure, while validity indicates whether it actually measures what it intends to measure.
Ensuring Reliability: Methods include test-retest reliability (administering the questionnaire twice to the same group and comparing scores), internal consistency (measuring the correlation between items within the questionnaire), and inter-rater reliability (assessing agreement between multiple raters when scoring open-ended questions).
Ensuring Validity: Techniques such as content validity (ensuring items represent the full scope of the construct being measured), criterion validity (correlating scores with an external criterion), and construct validity (demonstrating the questionnaire accurately reflects the underlying theoretical construct) are employed.
Imagine a questionnaire designed to measure job satisfaction. Reliability would mean that someone scoring high on the questionnaire at one time would likely score similarly at another time. Validity would mean that the questionnaire truly measures job satisfaction, not some other related but different construct, like overall life satisfaction.
Q 4. Describe different question types (e.g., Likert scale, multiple choice, ranking) and their appropriate uses.
Questionnaires employ diverse question types to gather different kinds of data. Each type has its strengths and weaknesses:
- Likert Scale: Measures attitudes or opinions using a scale (e.g., Strongly Agree to Strongly Disagree). Provides ordinal data.
Example: "I am satisfied with my job." (Strongly Agree, Agree, Neutral, Disagree, Strongly Disagree) - Multiple Choice: Offers pre-defined options, allowing respondents to select one or more answers. Provides nominal data.
Example: "What is your favorite color? (Red, Green, Blue, Yellow)" - Ranking: Requires respondents to rank options according to their preference or importance. Provides ordinal data.
Example: "Rank these features in order of importance: (Price, Quality, Design)" - Dichotomous: Presents only two options (e.g., Yes/No, True/False). Provides nominal data.
Example: "Have you ever used this product? (Yes/No)" - Open-ended Questions (Qualitative): Allows for free-form text responses, capturing rich detail but challenging to analyze quantitatively.
The appropriate question type depends on the research objective, the nature of the variable being measured, and the level of detail required.
Q 5. How do you handle missing data in a questionnaire?
Missing data is a common challenge in questionnaire research. Strategies for handling it include:
- Listwise Deletion: Removing entire cases (respondents) with any missing data. Simple but can lead to a significant loss of data if missingness is not random.
- Pairwise Deletion: Excluding cases only for the analysis of variables with missing data. Can lead to different sample sizes across analyses.
- Imputation: Replacing missing values with estimated values. Methods include mean/median imputation (replacing with the average or median of the observed values), regression imputation (predicting missing values based on other variables), and multiple imputation (creating multiple plausible imputed datasets).
The best approach depends on the extent and pattern of missing data, the research question, and the characteristics of the dataset. Understanding the reasons for missing data (e.g., random vs. non-random) informs the most suitable method. If missing data is substantial or non-random, this will significantly impact the results and interpretation of the study.
Q 6. What techniques do you use to prevent response bias in questionnaires?
Response bias, where respondents answer inaccurately or dishonestly, threatens data validity. Techniques to mitigate this include:
- Ensuring Anonymity and Confidentiality: Protecting respondent privacy builds trust and encourages honest responses.
- Neutral Question Wording: Avoid leading questions or questions that might encourage a particular response.
- Balanced Response Options: Offer equally appealing options on scales (e.g., balanced Likert scales).
- Including Reverse-Scored Items: Incorporating items that measure the opposite of the main construct helps detect response bias.
- Using Multiple Methods: Triangulating data from multiple sources provides a richer and more reliable picture.
- Pilot Testing: Pilot testing identifies and helps to correct biases revealed through initial responses.
For instance, a question like, “Don’t you agree that our product is superior?” is leading, while a neutral alternative would be, “How would you rate the quality of our product?”
Q 7. Explain the concept of pilot testing a questionnaire and its importance.
Pilot testing involves administering a draft version of the questionnaire to a small sample of individuals before full-scale deployment. This crucial step allows for identifying potential problems before they affect the main study.
Importance: Pilot testing helps identify:
- Ambiguous or confusing questions: Respondents’ feedback reveals unclear wording or misunderstood instructions.
- Length and flow issues: The pilot test reveals whether the questionnaire is too long or difficult to navigate.
- Technical problems: Testing reveals any bugs in the online questionnaire platform or data entry errors.
- Response bias indicators: The pilot test provides an opportunity to identify potential sources of response bias.
Pilot testing data should be analyzed to make necessary revisions to the questionnaire. It is like a dress rehearsal before the main performance ensuring that everything runs smoothly and the results are of high quality.
Q 8. How do you determine the appropriate sample size for a questionnaire study?
Determining the appropriate sample size for a questionnaire study is crucial for obtaining reliable and statistically significant results. It’s not a one-size-fits-all answer; it depends on several factors, including the desired level of precision, the variability within the population you’re studying, and the resources available. A larger sample size generally leads to more accurate results but increases costs and time commitment.
One common method is using a sample size calculator, which requires inputting the desired confidence level (e.g., 95%), the margin of error you’re willing to accept (e.g., ±5%), and an estimate of the population proportion (if known, or a conservative estimate of 50% if unknown). These inputs are then used to calculate the minimum sample size needed. For instance, if you want a 95% confidence level with a ±5% margin of error and an unknown population proportion, the calculator might suggest a sample size of around 384 participants.
Another approach involves power analysis, a more sophisticated statistical method that considers the effect size you’re hoping to detect. Power analysis helps determine the sample size needed to ensure that you have a sufficient chance of finding a statistically significant result if a real effect exists. Statistical software packages like G*Power can assist with this process. Remember, always justify your sample size choice in your research report, citing the method and parameters used.
Q 9. What are some common errors to avoid when designing a questionnaire?
Designing a questionnaire requires careful attention to detail to avoid common errors that can jeopardize the validity and reliability of your findings. Some key pitfalls to avoid include:
- Leading questions: Questions that subtly guide respondents towards a particular answer (e.g., “Don’t you agree that…?”). Instead, frame questions neutrally.
- Double-barreled questions: Questions that ask about two different things at once (e.g., “How satisfied are you with the price and quality of our product?”). Separate these into two distinct questions.
- Ambiguous wording: Using vague or unclear language that can be interpreted in multiple ways. Always use precise and unambiguous terms.
- Jargon and technical terms: Avoid using specialized language that your respondents may not understand. Keep it simple and accessible.
- Long and complex questions: Break down lengthy questions into shorter, more manageable parts.
- Sensitive questions without proper context or warnings: If dealing with sensitive topics, provide a clear explanation of why the information is needed and assure confidentiality.
- Lack of pilot testing: Failing to test the questionnaire on a small sample before administering it to the larger group. Pilot testing allows for identifying and fixing any issues with question clarity, flow, or response options.
By carefully considering these points during questionnaire design, you can significantly improve the quality of your data and the validity of your conclusions. For example, replacing a leading question like “Do you find our customer service excellent?” with a neutral question like “How would you rate our customer service?” can significantly improve the accuracy of your responses.
Q 10. Describe your experience with different questionnaire software or platforms.
I have extensive experience using various questionnaire software and platforms, each with its own strengths and weaknesses. I’ve worked with both offline and online platforms. Offline, I’ve used tools for creating and printing paper-based questionnaires. While cost-effective, this approach can be cumbersome for large-scale studies and data entry.
Online platforms provide significantly more efficiency. I’m proficient in SurveyMonkey, Qualtrics, and Google Forms. SurveyMonkey offers a user-friendly interface and excellent reporting features, suitable for various research projects. Qualtrics provides more advanced functionalities like branching logic and sophisticated data analysis tools, ideal for complex studies. Google Forms is a simpler, free option, perfect for quick surveys and smaller projects.
My choice of platform depends heavily on the project requirements. For example, a simple customer satisfaction survey might use Google Forms, while a large-scale academic study might necessitate Qualtrics’ advanced capabilities. Understanding the unique features of each platform allows me to select the most appropriate tool for each task, optimizing both efficiency and data quality.
Q 11. How do you ensure the clarity and understandability of questions in a questionnaire?
Ensuring the clarity and understandability of questions is paramount to obtaining accurate and meaningful data. This involves several strategies:
- Use simple language: Avoid jargon, technical terms, and complex sentence structures. Write as if you are speaking to someone with limited knowledge of the subject matter.
- Define terms: If specialized terms are unavoidable, provide clear definitions or explanations.
- Keep questions concise: Short, focused questions are easier to understand than long, rambling ones.
- Avoid double negatives: Double negatives can easily confuse respondents.
- Pilot test: Conduct a pilot study to test the clarity and understanding of questions with a small group of respondents. Gather feedback and revise the questionnaire based on their responses.
- Use clear response options: Provide response options that are mutually exclusive, exhaustive, and easy to understand.
For example, instead of asking, “To what extent do you disagree with the following statement…?,” a clearer question would be “How much do you agree or disagree with the following statement…?” The latter is significantly more straightforward and less prone to misinterpretation.
Q 12. How do you adapt questionnaires for different target audiences?
Adapting questionnaires for different target audiences is crucial for ensuring that the questions are relevant, understandable, and culturally appropriate. This often involves several adjustments:
- Language: Use language appropriate to the respondents’ literacy level and cultural background. Avoid idioms or slang that might not be understood by all participants.
- Cultural sensitivity: Consider cultural norms and values when formulating questions. Questions that are acceptable in one culture might be offensive or inappropriate in another.
- Format and design: Adjust the format and design to accommodate the audience’s technological proficiency and preferences. For example, using large font sizes for older adults or designing a mobile-friendly questionnaire for younger generations.
- Question content: Adapt the content of the questions to reflect the knowledge and experiences of the target audience. Avoid asking about concepts or experiences that are irrelevant or unfamiliar to them.
For instance, a questionnaire about financial literacy for college students will differ substantially from one designed for retired individuals. The former might focus on student loans and budgeting, while the latter might emphasize retirement planning and investment strategies. Thorough consideration of the audience’s specific needs ensures the questionnaire remains effective and produces valuable insights.
Q 13. What are some ethical considerations when designing and administering a questionnaire?
Ethical considerations are central to designing and administering questionnaires. Key aspects include:
- Informed consent: Participants must be fully informed about the purpose of the study, their rights, and how their data will be used. They should freely choose to participate without coercion.
- Confidentiality and anonymity: Participants’ responses should be kept confidential and, whenever possible, anonymous. Explain how data will be protected from unauthorized access or disclosure.
- Data security: Implement appropriate measures to protect the data from loss, theft, or unauthorized access.
- Minimizing risk: Ensure that the questionnaire does not cause undue stress or harm to participants. Sensitive questions should be handled with care and appropriate safeguards.
- Transparency: Be transparent about the sponsorship and funding sources of the study.
- Debriefing: Provide participants with information about the study’s findings, if appropriate.
For example, obtaining written informed consent before administering the questionnaire, providing clear instructions on how to withdraw from the study at any time, and assuring participants of the confidentiality of their responses are all critical ethical considerations. Ethical questionnaire design not only protects participants but also enhances the credibility and trustworthiness of the research.
Q 14. How do you analyze data collected from a questionnaire? Explain specific methods.
Analyzing data from a questionnaire involves several steps, starting with data cleaning and preparation. This includes checking for missing data, identifying outliers, and correcting any inconsistencies. After cleaning, I typically use statistical methods appropriate for the type of data collected. For example:
- Descriptive statistics: For summarizing the data, I use frequencies, means, standard deviations, and other descriptive measures to understand the distribution of responses.
- Inferential statistics: If testing hypotheses or making inferences about a larger population, I utilize techniques like t-tests, ANOVA, chi-square tests, or correlation analysis depending on the research question and the nature of the data (e.g., comparing means between groups, examining relationships between variables).
- Regression analysis: For examining the relationships between multiple variables, regression models (linear, logistic, etc.) can be used to predict outcomes or understand the influence of predictors.
- Factor analysis: Used to identify underlying factors or dimensions within a set of variables, allowing for data reduction and conceptual clarity.
The choice of statistical method depends on the research question, the type of data (e.g., categorical, continuous), and the assumptions underlying each test. Statistical software packages such as SPSS, R, or SAS are commonly employed to perform these analyses. The results are then interpreted in the context of the research question and reported in a clear and concise manner, highlighting key findings and limitations.
Q 15. What statistical software are you proficient in for questionnaire data analysis?
For questionnaire data analysis, I’m proficient in several statistical software packages. My primary tools are R and SPSS. R offers unparalleled flexibility and a vast library of packages for advanced statistical modeling, including complex survey data analysis. I frequently use packages like survey for handling complex survey designs and weighting, and ggplot2 for creating publication-quality visualizations. SPSS, on the other hand, provides a user-friendly interface, making it ideal for tasks requiring quicker turnaround or for those less familiar with coding. I leverage its capabilities for descriptive statistics, t-tests, ANOVAs, and more. The choice of software depends heavily on the complexity of the analysis, the size of the dataset, and the specific research questions. For instance, if I’m analyzing data from a complex stratified sample with weights, R’s survey package would be my go-to. For a simpler analysis, such as calculating basic descriptive statistics from a smaller dataset, SPSS’s user-friendly interface might be more efficient.
Career Expert Tips:
- Ace those interviews! Prepare effectively by reviewing the Top 50 Most Common Interview Questions on ResumeGemini.
- Navigate your job search with confidence! Explore a wide range of Career Tips on ResumeGemini. Learn about common challenges and recommendations to overcome them.
- Craft the perfect resume! Master the Art of Resume Writing with ResumeGemini’s guide. Showcase your unique qualifications and achievements effectively.
- Don’t miss out on holiday savings! Build your dream resume with ResumeGemini’s ATS optimized templates.
Q 16. How do you create visually appealing and user-friendly questionnaires?
Creating visually appealing and user-friendly questionnaires is crucial for maximizing response rates and data quality. I follow several key principles. First, I use clear and concise language, avoiding jargon and technical terms. The language should be tailored to the target audience’s education level and understanding. Second, I employ a logical flow, grouping related questions together and progressing from general to specific topics. This enhances the respondent’s experience, making it easier to complete the questionnaire. Third, I break down lengthy questionnaires into smaller sections with clear headings and subheadings. This prevents respondents from feeling overwhelmed. Visual elements also play a significant role. I incorporate whitespace effectively to avoid a cluttered appearance. I utilize different font sizes and styles for emphasis, and I might use images or icons sparingly, only where they add value and clarity. For online questionnaires, I use user-friendly platforms like SurveyMonkey or Qualtrics which offer pre-designed templates and built-in features like progress bars that can significantly improve the respondent experience. For example, if I was designing a questionnaire for children, I might use larger fonts, simpler language, and incorporate playful visuals. For a survey of academics, I would opt for a more formal, concise style.
Q 17. Describe your experience with qualitative data analysis from questionnaires.
My experience with qualitative data analysis from questionnaires involves a systematic approach focusing on identifying themes and patterns within the responses. I often start by transcribing open-ended responses, ensuring accuracy and consistency. Then, I utilize techniques like thematic analysis. This involves immersing myself in the data, carefully reading each response to identify recurring themes, patterns, and key concepts. I employ coding schemes to categorize and organize the data, allowing for a structured analysis of the qualitative information. Software like NVivo or Atlas.ti can assist in this process, but even with smaller datasets, I find that manual coding initially can help me to truly understand the nuances of the responses. For example, in a study exploring customer satisfaction, open-ended feedback on their experience might reveal recurrent themes such as ‘long wait times,’ ‘unhelpful staff,’ or ‘complicated processes.’ These themes then become the basis for further interpretation and potentially inform changes to the service.
Q 18. How do you manage and organize large datasets collected from questionnaires?
Managing large datasets from questionnaires requires a well-structured approach. I typically start by exporting the data into a structured format like CSV or SPSS data files. This ensures data integrity and compatibility with various statistical software packages. I then create a detailed codebook, which documents each variable’s name, definition, and coding scheme. This is critical for maintaining consistency throughout the analysis and for allowing others to understand the data structure. I employ data cleaning techniques to identify and handle missing values, outliers, and inconsistencies. Depending on the nature of the missing data, I might use imputation methods or exclude specific cases from the analysis. For very large datasets, I often work with relational databases (like MySQL or PostgreSQL) which allow for efficient storage, retrieval, and management of the data. This database approach also facilitates data sharing and collaboration if multiple team members are involved in the analysis. Finally, I always maintain meticulous documentation of the data cleaning and manipulation procedures, ensuring the transparency and reproducibility of my analysis.
Q 19. How do you handle sensitive or personal information collected through questionnaires?
Handling sensitive or personal information collected through questionnaires is paramount. I adhere strictly to ethical guidelines and regulations, ensuring data confidentiality and anonymity. This involves obtaining informed consent from participants, clearly explaining how their data will be used, and guaranteeing the protection of their privacy. I de-identify data whenever possible, removing or replacing identifying information such as names, addresses, and email addresses. The data is stored securely, usually on password-protected computers and servers with limited access. I often use encryption techniques to protect data during transmission and storage. For sensitive information like medical records or financial data, I may work with institutional review boards (IRBs) to ensure compliance with all relevant ethical regulations. Compliance with data protection regulations like GDPR (in Europe) or HIPAA (in the US) is crucial and I ensure that all procedures align with these regulations. Transparency and accountability are key – maintaining detailed records of data handling practices is a must.
Q 20. Explain your understanding of different sampling techniques for questionnaires.
Understanding sampling techniques is essential for drawing valid inferences from questionnaire data. Different techniques are suitable for different research contexts and objectives.
- Simple Random Sampling: Every member of the population has an equal chance of being selected. This is easy to implement but may not be representative if the population is heterogeneous.
- Stratified Random Sampling: The population is divided into strata (subgroups) and random samples are drawn from each stratum. This ensures representation from all subgroups.
- Cluster Sampling: The population is divided into clusters, and a random sample of clusters is selected. All members within the selected clusters are included. This is efficient for large, geographically dispersed populations but may have higher sampling error.
- Convenience Sampling: Participants are selected based on their availability. This is convenient but may lead to bias and limit generalizability.
- Quota Sampling: Similar to stratified sampling, but instead of random selection, participants are selected to meet specific quotas (e.g., gender, age).
Q 21. How do you measure the response rate of a questionnaire and what are acceptable rates?
The response rate of a questionnaire is calculated as the number of completed questionnaires divided by the number of questionnaires distributed, expressed as a percentage. Response Rate = (Number of Completed Questionnaires / Number of Questionnaires Distributed) * 100 Acceptable response rates vary depending on the research context and the mode of administration. Generally, rates above 50% are considered good, while rates above 70% are excellent. However, a lower response rate may still be acceptable if the sample is highly representative of the target population, even if the absolute number of responses is low. Factors influencing response rate include the length of the questionnaire, the clarity of instructions, the perceived relevance of the topic to the respondents, and the method of administration (e.g., online surveys tend to have lower response rates than mail surveys). Strategies to increase response rates include providing incentives, personalizing the invitation, offering clear and concise questionnaires, and using multiple methods of follow-up.
Q 22. How do you interpret the results from a questionnaire and draw meaningful conclusions?
Interpreting questionnaire results involves a multi-step process that goes beyond simply tallying responses. It begins with data cleaning, identifying and handling missing data or outliers. Then, descriptive statistics are used to summarize the data, often employing measures like frequencies, percentages, means, and standard deviations, depending on the question type (e.g., multiple choice, Likert scale, open-ended). This allows us to see patterns and trends in the responses.
Next comes inferential statistics, which helps determine if those trends are statistically significant. For example, we might use t-tests or ANOVA to compare responses across different groups. Finally, we interpret the findings within the context of the research question. We don’t just present numbers; we explain what those numbers *mean* in relation to the study’s goals. For instance, if a customer satisfaction survey shows a low average rating for a particular product feature, we need to explain *why* that’s the case, potentially offering recommendations based on the qualitative data from open-ended questions.
Consider a customer satisfaction survey. If 70% of respondents rate a feature as ‘poor,’ it’s not enough to just state that statistic. We need to explore the qualitative data (e.g., open-ended comments) to understand *why* they gave that rating. Maybe the feature is difficult to use, or it lacks a needed function. This qualitative insight gives much richer context to the quantitative findings. The final report is a synthesis of both sets of data, leading to actionable conclusions.
Q 23. What are the strengths and weaknesses of using questionnaires as a research method?
Questionnaires offer several advantages as a research method, but also come with limitations.
- Strengths: Cost-effectiveness, particularly for large samples; ability to collect data from geographically dispersed populations; anonymity and confidentiality; ease of data analysis (for structured questionnaires).
- Weaknesses: Potential for response bias (e.g., social desirability bias, where respondents answer to present themselves in a positive light); limited depth of understanding (especially with structured questionnaires); low response rates can affect the generalizability of findings; inability to clarify ambiguities in questions; and risk of misunderstanding questions if the questionnaire isn’t clearly worded or culturally appropriate.
For example, a customer satisfaction survey might reveal high overall satisfaction scores, but this could mask underlying issues. Open-ended questions could reveal specific product problems not captured by the rating scales.
Q 24. How do you incorporate feedback from pilot testing to improve a questionnaire?
Pilot testing is crucial for refining a questionnaire before full-scale deployment. Feedback from pilot testing informs iterative improvements. This involves administering the questionnaire to a small, representative sample. Post-test, the feedback focuses on clarity, relevance, and flow of questions. We analyze feedback regarding:
- Question Clarity: Were the questions easily understood? Did respondents have any difficulties interpreting the wording or meaning?
- Question Relevance: Did the questions seem relevant to the research topic? Were there any questions that felt unnecessary or out of place?
- Response Time: How long did it take respondents to complete the questionnaire? Were any sections overly time-consuming?
- Response Consistency: Were there any inconsistencies or contradictions in the responses? Did any questions seem to lead respondents to different conclusions?
Based on this feedback, we make revisions, such as rewording confusing questions, removing irrelevant ones, or rearranging the order to improve flow. For instance, if a pilot test shows that many participants misinterpreted a question, we might reword it for better clarity or add more detailed instructions. This iterative process ensures a robust and effective final questionnaire.
Q 25. Describe your experience with creating questionnaires for specific research purposes (e.g., customer satisfaction, employee feedback).
I have extensive experience designing questionnaires for various research purposes. For example, I’ve developed customer satisfaction surveys using Likert scales to measure satisfaction levels across multiple product or service dimensions and open-ended questions for detailed feedback. This enabled detailed analysis on specific areas and identification of key improvement areas.
In employee feedback surveys, I’ve used a combination of quantitative (rating scales for job satisfaction, work-life balance, etc.) and qualitative methods (open-ended comments on workplace culture, management practices) to get a comprehensive understanding of employee perspectives. This helped identify underlying causes of employee attrition and inform interventions to improve workplace satisfaction.
In another project, I designed a questionnaire for measuring the effectiveness of a training program. I incorporated pre- and post-training assessments to measure participants’ knowledge and skills before and after the training, which allowed for measuring actual impact of the program. For each project, I tailored the questionnaire’s design, question type, and analysis techniques to meet the study’s specific objectives.
Q 26. How do you ensure the confidentiality and anonymity of respondents in a questionnaire study?
Ensuring confidentiality and anonymity in questionnaire studies is paramount. Here are some key steps:
- Anonymity: Avoid collecting identifying information (name, email, address) unless absolutely necessary. If possible, utilize unique ID numbers instead of personal data. If you need to link responses to other data, ensure that data is securely stored and linked through coded identifiers.
- Confidentiality: Clearly state in the questionnaire’s introduction that responses will be kept confidential and only aggregated data will be reported. Emphasize that individual responses will not be disclosed. Adhere to ethical guidelines and data protection regulations (like GDPR or HIPAA, depending on the context).
- Secure Data Storage: Store data securely using password-protected files and encrypted databases. Access to the data should be restricted to authorized personnel only.
- Data Anonymization: Before analysis, remove any identifying information from the dataset and use only aggregated data in reports. This should be done immediately following data collection.
For example, responses to a sensitive topic like employee burnout should be completely anonymized to encourage honest responses and ensure no individual can be identified. Transparent communication regarding the data handling process reassures participants and encourages higher response rates.
Q 27. How do you develop a questionnaire that is both efficient and effective in gathering data?
Developing an efficient and effective questionnaire involves careful planning and design. Efficiency means minimizing respondent burden, while effectiveness means accurately and reliably collecting the required data. Here’s a framework:
- Clearly Define Objectives: Start by specifying the research questions and what information needs to be collected. This informs the type of questions and the overall structure.
- Target Audience: Consider the characteristics of the target population (age, education, language) when designing questions and response options to ensure comprehensibility.
- Question Types: Select appropriate question types (multiple choice, Likert scales, open-ended) based on the type of information needed. Use a mix to get both breadth and depth of information. Avoid leading or biased questions.
- Logical Flow: Organize questions logically, beginning with easy and engaging questions to motivate respondents. Group related questions together and use clear transitions between sections.
- Pilot Testing: Conduct pilot testing to identify and address any issues with clarity, flow, or question ambiguity before the main survey.
- Length: Keep the questionnaire as concise as possible while still gathering the necessary data. Respondents are more likely to complete shorter questionnaires.
For instance, a short, focused questionnaire might use multiple choice questions for demographic information and Likert scales to gauge satisfaction, reserving open-ended questions for only the most critical aspects. This balance maximizes both efficiency and effectiveness.
Q 28. What strategies do you employ to increase the response rate of online questionnaires?
Increasing response rates for online questionnaires requires a multi-pronged approach:
- Personalization: Address respondents by name if possible, personalize the email invitation and the questionnaire itself (e.g., mentioning their location if relevant).
- Incentives: Offer incentives such as gift cards, discounts, or entry into a raffle to encourage participation. But avoid offering incentives that could influence the responses.
- Clear and Concise Invitations: Make it clear what the survey is about, why it’s important, and how long it will take to complete. Highlight the benefits of participation.
- Multiple Reminders: Send follow-up reminders to non-respondents. Multiple reminders at increasing intervals often increase response rates.
- Easy to Use: Ensure the questionnaire is easy to navigate and complete. The design should be user-friendly and mobile-responsive.
- Short and Sweet: Aim for brevity. Respondents are less likely to finish long questionnaires.
- Pre-notification: Provide a pre-notification email that explains the purpose and timeline of the upcoming survey. This prepares participants and increases anticipation.
For example, I’ve had success with a tiered reminder strategy. First, a friendly reminder; then a more urgent one highlighting the benefits; and finally, a last attempt emphasizing the value of their participation. This layered approach helps maximize response without feeling pushy.
Key Topics to Learn for Questionnaires Interview
- Questionnaire Design Principles: Understand the fundamental principles of creating effective questionnaires, including question types, wording, and order.
- Data Collection and Analysis: Learn about different methods of administering questionnaires (online, paper, etc.) and analyzing the collected data using statistical software or techniques.
- Sampling and Survey Methodology: Grasp the concepts of target populations, sampling methods (random, stratified, etc.), and their impact on data validity and generalizability.
- Reliability and Validity: Understand how to assess the reliability and validity of questionnaires and the implications for data interpretation.
- Bias and Error Reduction: Explore techniques to minimize bias in questionnaire design, administration, and analysis, including pre-testing and pilot studies.
- Ethical Considerations: Familiarize yourself with ethical guidelines related to questionnaire research, including informed consent and data privacy.
- Practical Application in Different Fields: Explore how questionnaires are used in various fields like market research, social sciences, healthcare, and human resources.
- Troubleshooting and Problem-Solving: Develop skills in identifying and addressing potential issues that may arise during the questionnaire process, such as low response rates or ambiguous questions.
Next Steps
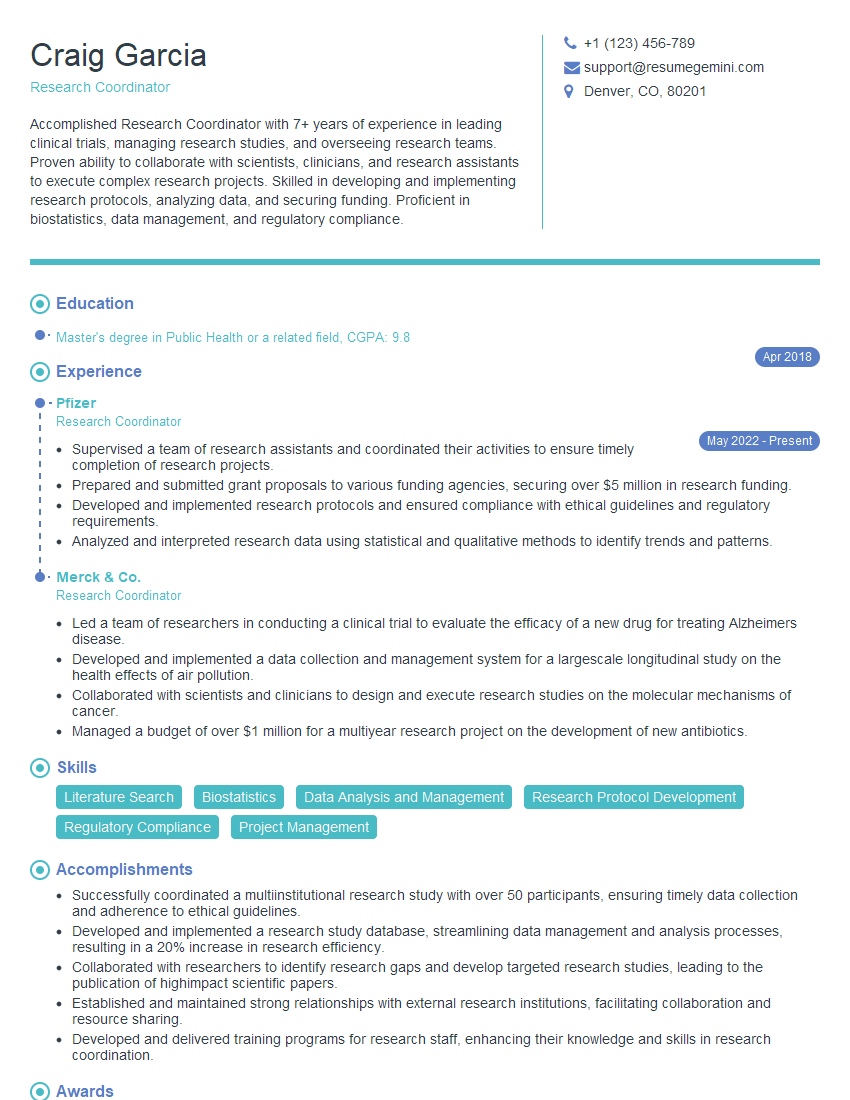
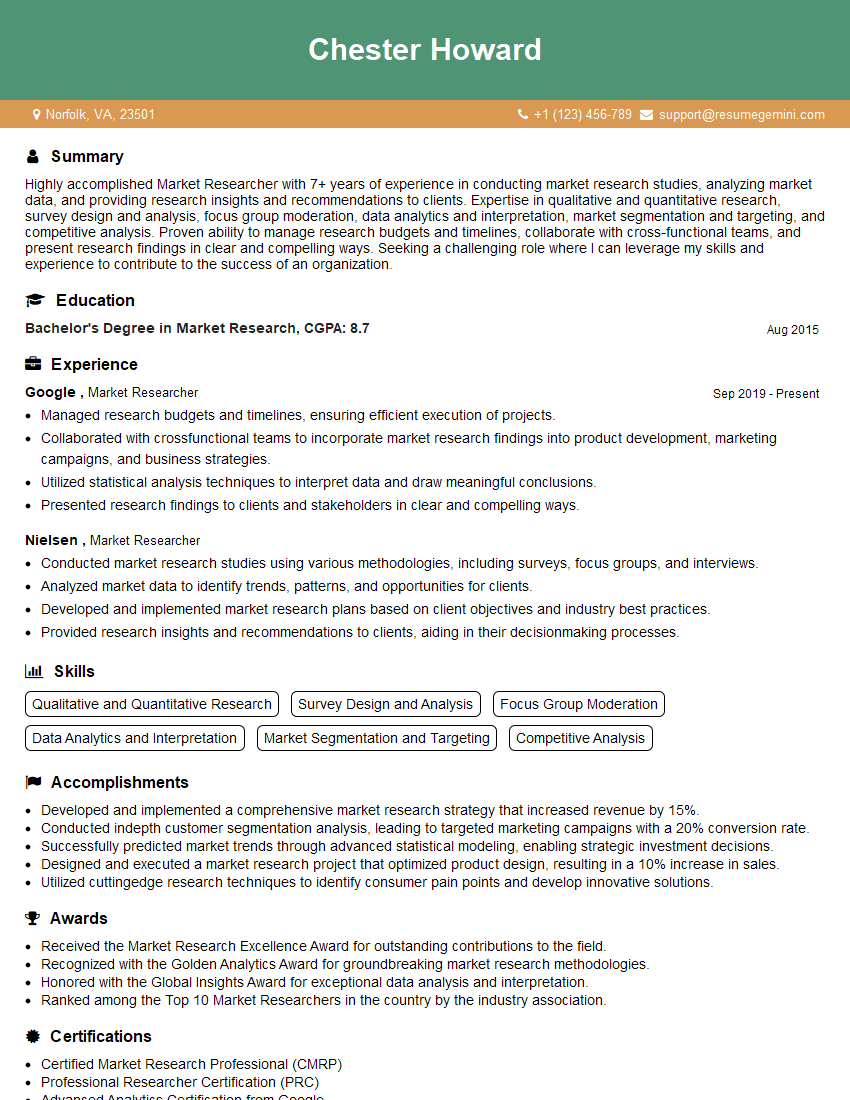
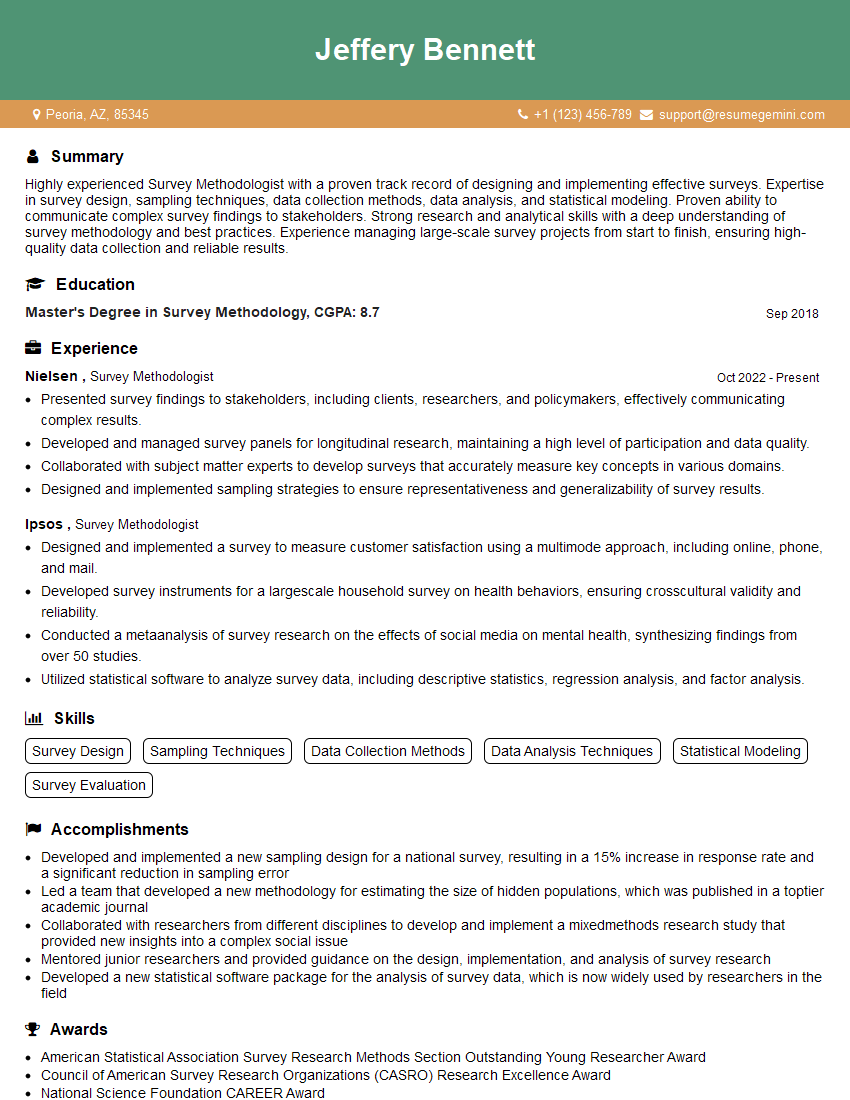
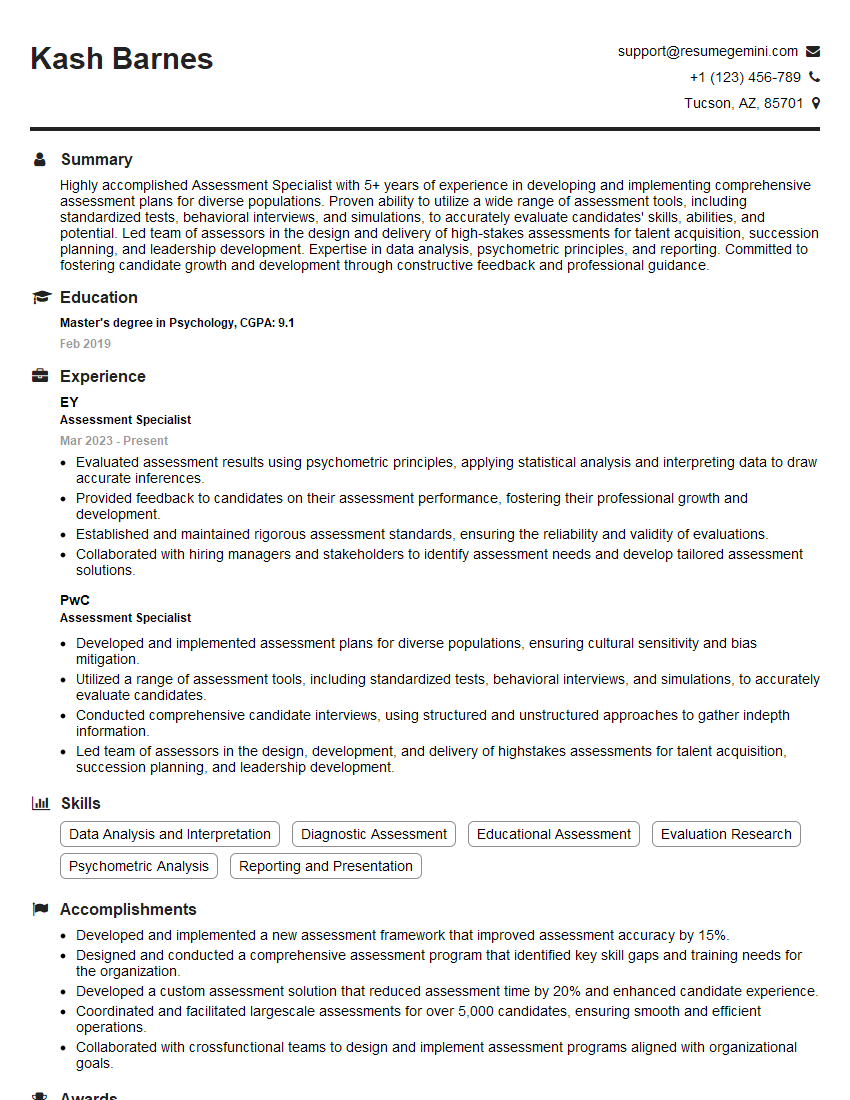
Mastering the art of questionnaires is crucial for success in many fields, opening doors to exciting career opportunities. A strong understanding of questionnaire design and analysis demonstrates valuable research and analytical skills highly sought after by employers. To significantly boost your job prospects, it’s essential to create a resume that Applicant Tracking Systems (ATS) can easily read and understand. ResumeGemini is a trusted resource that can help you build a professional and effective resume tailored to your skills and experience. We provide examples of resumes specifically designed for candidates with expertise in Questionnaires to guide you in crafting your own compelling application materials. Take advantage of these resources to present yourself effectively and increase your chances of landing your dream job.
Explore more articles
Users Rating of Our Blogs
Share Your Experience
We value your feedback! Please rate our content and share your thoughts (optional).
What Readers Say About Our Blog
Hello,
We found issues with your domain’s email setup that may be sending your messages to spam or blocking them completely. InboxShield Mini shows you how to fix it in minutes — no tech skills required.
Scan your domain now for details: https://inboxshield-mini.com/
— Adam @ InboxShield Mini
Reply STOP to unsubscribe
Hi, are you owner of interviewgemini.com? What if I told you I could help you find extra time in your schedule, reconnect with leads you didn’t even realize you missed, and bring in more “I want to work with you” conversations, without increasing your ad spend or hiring a full-time employee?
All with a flexible, budget-friendly service that could easily pay for itself. Sounds good?
Would it be nice to jump on a quick 10-minute call so I can show you exactly how we make this work?
Best,
Hapei
Marketing Director
Hey, I know you’re the owner of interviewgemini.com. I’ll be quick.
Fundraising for your business is tough and time-consuming. We make it easier by guaranteeing two private investor meetings each month, for six months. No demos, no pitch events – just direct introductions to active investors matched to your startup.
If youR17;re raising, this could help you build real momentum. Want me to send more info?
Hi, I represent an SEO company that specialises in getting you AI citations and higher rankings on Google. I’d like to offer you a 100% free SEO audit for your website. Would you be interested?
Hi, I represent an SEO company that specialises in getting you AI citations and higher rankings on Google. I’d like to offer you a 100% free SEO audit for your website. Would you be interested?
good

