Cracking a skill-specific interview, like one for Experimental Studies, requires understanding the nuances of the role. In this blog, we present the questions you’re most likely to encounter, along with insights into how to answer them effectively. Let’s ensure you’re ready to make a strong impression.
Questions Asked in Experimental Studies Interview
Q 1. Explain the difference between a between-subjects and a within-subjects design.
The core difference between between-subjects and within-subjects designs lies in how participants are assigned to experimental conditions.
In a between-subjects design, different participants are assigned to different experimental conditions. Imagine testing a new drug: one group receives the drug (experimental group), while another receives a placebo (control group). Each participant is only exposed to one condition. This simplifies data analysis as individual differences between participants don’t confound within-condition comparisons. However, it requires a larger number of participants and is more susceptible to individual differences influencing the results.
In a within-subjects design, the same participants are exposed to all experimental conditions. Using the drug example, each participant would receive both the drug and the placebo at different times. This requires fewer participants and controls for individual differences more effectively, leading to greater statistical power. However, it’s prone to order effects (the order of conditions influencing results) and carryover effects (the lingering impact of one condition on the next).
Example: Studying the effect of caffeine on reaction time. A between-subjects design would have one group drink caffeinated coffee and another group drink decaf. A within-subjects design would have each participant drink both caffeinated and decaf coffee on different days.
Q 2. Describe the concept of counterbalancing and its importance in experimental design.
Counterbalancing is a technique used in within-subjects designs to control for order effects. It involves systematically varying the order in which participants experience different conditions. This ensures that no single condition is consistently presented first, last, or in any particular position, minimizing the bias introduced by the order of presentation.
There are several methods of counterbalancing, including complete counterbalancing (every possible order is used), and incomplete counterbalancing (a subset of all possible orders is used, such as a Latin Square design). The choice depends on the number of conditions and the practicality of testing all possible orders.
Importance: Counterbalancing is crucial in within-subjects designs because without it, observed differences in performance across conditions could be due to the order of conditions rather than the manipulation itself. For instance, if participants always receive the experimental condition first, any observed improvement might be attributed to practice effects rather than the treatment’s true effect.
Example: If testing three different learning methods (A, B, C), complete counterbalancing would involve six different orderings (ABC, ACB, BAC, BCA, CAB, CBA). A Latin Square design might use a smaller set of orders while still ensuring each condition appears in each position equally often.
Q 3. What are the key characteristics of a well-designed experiment?
A well-designed experiment is characterized by several key features:
- Clearly defined variables: Independent, dependent, and controlled variables are precisely defined and measurable.
- Control group: A control group (or baseline condition) allows for comparison and helps isolate the effect of the independent variable.
- Random assignment: Participants are randomly assigned to conditions to minimize bias and ensure groups are comparable.
- Manipulation of the independent variable: The researcher systematically manipulates the independent variable to observe its effect on the dependent variable.
- Measurement of the dependent variable: The dependent variable is reliably and validly measured using appropriate instruments.
- Control of extraneous variables: Steps are taken to minimize the influence of confounding variables that could affect the results.
- Replication: The study is designed to be replicable, allowing other researchers to verify the findings.
- Appropriate statistical analysis: Statistical tests are selected based on the research design and data type to determine statistical significance.
These features work together to ensure the experiment’s internal and external validity. Internal validity refers to the confidence that the independent variable caused the observed changes in the dependent variable. External validity refers to the generalizability of the findings to other populations and settings.
Q 4. How do you control for confounding variables in an experiment?
Controlling for confounding variables—variables that might influence the dependent variable along with or instead of the independent variable—is crucial for accurate interpretation of experimental results. Several strategies can be employed:
- Random assignment: Randomly assigning participants to different conditions helps distribute confounding variables evenly across groups.
- Matching: Participants in different groups are matched on relevant characteristics (e.g., age, gender, pre-existing knowledge) that could act as confounders.
- Statistical control: Using statistical techniques like analysis of covariance (ANCOVA) can statistically remove the influence of confounding variables from the analysis.
- Holding variables constant: Keeping certain variables constant across all conditions, like testing participants in the same room at the same time, reduces their potential to confound results.
- Counterbalancing (in within-subjects designs): As discussed earlier, counterbalancing minimizes the impact of order effects as a potential confound.
- Blind procedures: Using single-blind (participants unaware of the condition) or double-blind (both participants and researchers unaware) procedures prevents bias from influencing the results.
The choice of method depends on the nature of the confounding variable and the specific research design.
Q 5. Explain the difference between Type I and Type II errors.
Type I error (false positive): This occurs when we reject the null hypothesis when it is actually true. In simpler terms, we conclude there’s a significant effect when there isn’t one. Think of it as a false alarm. The probability of committing a Type I error is denoted by alpha (α), typically set at 0.05 (5%).
Type II error (false negative): This occurs when we fail to reject the null hypothesis when it is actually false. We conclude there is no significant effect when there actually is one. This is a missed opportunity. The probability of committing a Type II error is denoted by beta (β). The power of a test (1-β) is the probability of correctly rejecting a false null hypothesis.
Example: Imagine testing a new drug. A Type I error would be concluding the drug is effective when it’s not. A Type II error would be concluding the drug is ineffective when it actually is effective.
Q 6. What is statistical power, and why is it important?
Statistical power refers to the probability that a study will detect a real effect if one exists. It’s the probability of correctly rejecting a false null hypothesis (1 – β). A higher power means a greater chance of finding a significant result when a true effect is present.
Importance: Power is crucial because a low-power study might fail to detect a real effect, leading to a Type II error. Factors influencing power include sample size (larger samples generally lead to higher power), effect size (larger effects are easier to detect), alpha level, and the chosen statistical test.
Example: A study with low power might fail to show that a new teaching method improves student test scores, even if the method is actually effective. Increasing the sample size or using a more sensitive statistical test can increase power and reduce the chance of missing a real effect.
Q 7. What are the assumptions of a t-test?
The assumptions of a t-test depend on the type of t-test (one-sample, independent samples, or paired samples), but generally include:
- Normality: The data should be approximately normally distributed, especially for smaller sample sizes. While slight deviations from normality are often tolerated, severely skewed or kurtotic data may violate this assumption.
- Independence: Observations should be independent of each other. This means that the score of one participant should not influence the score of another.
- Homogeneity of variances (for independent samples t-test): The variances of the two groups being compared should be roughly equal. Tests like Levene’s test can assess this assumption. If violated, a Welch’s t-test, which doesn’t assume equal variances, can be used.
- Interval or ratio data: The dependent variable should be measured on an interval or ratio scale.
Violating these assumptions can affect the validity of the t-test results. Transforming the data or using non-parametric alternatives (like the Mann-Whitney U test or Wilcoxon signed-rank test) may be necessary if assumptions are severely violated.
Q 8. Explain the difference between correlation and causation.
Correlation and causation are two distinct concepts in experimental studies. Correlation refers to a statistical relationship between two or more variables; when one variable changes, the other tends to change as well. However, correlation does not imply causation. Just because two variables are correlated doesn’t mean one causes the other. There might be a third, unseen variable influencing both, or the relationship could be purely coincidental.
Example: Ice cream sales and crime rates are often positively correlated – both tend to increase during summer. This doesn’t mean that eating ice cream causes crime, or vice-versa. The underlying cause is the warmer weather, which influences both ice cream consumption and the likelihood of increased social activity and therefore, potentially, higher crime rates.
Causation, on the other hand, implies a direct cause-and-effect relationship. One variable directly influences or produces a change in another. Establishing causation requires rigorous experimental design, including controlling for confounding variables and demonstrating a clear temporal sequence (cause precedes effect).
Q 9. What are some common threats to internal and external validity?
Threats to validity undermine the confidence we can place in the results of an experiment. Internal validity refers to the accuracy of the causal inference within the study, while external validity concerns the generalizability of the findings to other populations and settings.
- Threats to Internal Validity:
- Confounding Variables: Uncontrolled variables that correlate with both the independent and dependent variables, making it difficult to isolate the effect of the independent variable. For example, in a study on the effect of a new drug on blood pressure, age could be a confounding variable if older participants tend to have higher blood pressure regardless of the drug.
- Selection Bias: Systematic differences between the experimental and control groups before the manipulation of the independent variable. Random assignment helps mitigate this.
- History: External events occurring during the study that could influence the results.
- Maturation: Natural changes in the participants over time, like aging or fatigue.
- Threats to External Validity:
- Sampling Bias: The sample doesn’t accurately represent the population of interest.
- Situational Factors: The specific setting of the experiment might limit the generalizability of findings. A lab setting might not reflect real-world conditions.
- Interaction of Selection and Treatment: The effects of the independent variable may only apply to the specific sample studied.
Q 10. Describe your experience with different statistical software packages (e.g., R, SPSS, SAS).
I have extensive experience with several statistical software packages, including R, SPSS, and SAS. My proficiency extends beyond basic data entry and analysis to include advanced statistical modeling and data visualization.
R: I use R for its flexibility and power in handling complex datasets and implementing custom statistical procedures. I’m comfortable with packages like ggplot2 for visualizations, dplyr for data manipulation, and lme4 for mixed-effects modeling. I’ve used R extensively for creating publication-ready figures and conducting advanced statistical analyses for various research projects.
SPSS: I utilize SPSS for its user-friendly interface and its robust capabilities for conducting a wide range of statistical tests, including t-tests, ANOVAs, and regression analyses. It’s particularly helpful for analyzing large survey datasets and producing clear and concise reports.
SAS: I’m familiar with SAS for its strength in handling extremely large datasets and its capabilities for complex data management. I have experience with SAS procedures for statistical analysis and data manipulation.
Q 11. How do you determine the appropriate sample size for an experiment?
Determining the appropriate sample size is crucial for ensuring the statistical power of an experiment. A sample that is too small may fail to detect a true effect, while an excessively large sample may be wasteful of resources. Several factors influence sample size determination:
- Effect Size: The magnitude of the difference or relationship you expect to observe. Larger expected effects require smaller sample sizes.
- Significance Level (alpha): The probability of rejecting the null hypothesis when it is true (typically set at 0.05).
- Power (1-beta): The probability of correctly rejecting the null hypothesis when it is false (typically set at 0.80).
- Variability of the Data: Higher variability requires larger sample sizes.
Power analysis, often conducted using statistical software, is a standard method for calculating the required sample size based on these factors. Software like G*Power provides tools to perform these calculations.
Q 12. What are different ways to measure and analyze data?
Data measurement and analysis methods depend on the type of data collected (nominal, ordinal, interval, ratio) and the research question.
- Measurement: This involves using appropriate instruments or scales to collect data. For example, using a Likert scale for measuring attitudes, a stopwatch for measuring reaction time, or a questionnaire for gathering demographic information.
- Analysis:
- Descriptive Statistics: Summarizing the data using measures like mean, median, mode, standard deviation, and frequency distributions.
- Inferential Statistics: Drawing conclusions about a population based on sample data. This includes hypothesis testing (t-tests, ANOVAs, chi-square tests), correlation analysis, regression analysis, and other statistical modeling techniques.
- Qualitative Data Analysis: For non-numerical data like interviews or open-ended survey responses, techniques include thematic analysis, grounded theory, and content analysis.
Q 13. Explain your understanding of effect size and its interpretation.
Effect size quantifies the magnitude of the relationship between variables in an experiment. It’s a crucial measure that complements p-values by providing a standardized way to assess the practical significance of findings, regardless of sample size. A small p-value indicates statistical significance, but a small effect size implies that the finding is not practically meaningful.
Different effect size measures exist depending on the statistical test used. For example:
- Cohen’s d: Used for comparing means (t-tests, ANOVAs). A Cohen’s d of 0.2 is considered a small effect, 0.5 a medium effect, and 0.8 a large effect.
- Pearson’s r: Used for measuring the correlation between two variables. A value of 0.1 is considered a small effect, 0.3 a medium effect, and 0.5 a large effect.
- Eta-squared (η²): Used in ANOVA to measure the proportion of variance explained by the independent variable.
Interpreting effect sizes involves considering the context of the study and the practical implications of the findings. A small effect size might be clinically significant in certain situations, while a large effect size might be trivial in others. It’s important to report and interpret both p-values and effect sizes to provide a complete picture of the research findings.
Q 14. Describe your experience with qualitative data analysis.
My experience with qualitative data analysis involves various approaches such as thematic analysis, grounded theory, and content analysis. I am proficient in using qualitative data analysis software such as NVivo or Atlas.ti to manage and analyze large qualitative datasets. The process typically involves several steps:
- Data Transcription: Converting audio or video recordings into textual data.
- Coding: Identifying recurring themes and patterns in the data, assigning codes to relevant segments of text.
- Theme Development: Grouping similar codes into broader themes that capture the essence of the data.
- Interpretation: Drawing meaning and insights from the identified themes, considering the context and nuances of the data.
- Validation: Ensuring the rigor and trustworthiness of the analysis, often through member checking or triangulation with other data sources.
I’ve employed qualitative data analysis in several projects, including interviews with patients to understand their experiences with a particular treatment and analysis of open-ended survey responses to identify key factors influencing consumer behavior.
Q 15. How do you handle missing data in your analyses?
Missing data is a common challenge in experimental research. The best approach depends heavily on the nature of the missing data – is it missing completely at random (MCAR), missing at random (MAR), or missing not at random (MNAR)?
- MCAR: If data is MCAR, meaning the probability of missingness is unrelated to any observed or unobserved variables, simple methods like listwise deletion (removing participants with any missing data) might be acceptable, although it reduces power. However, I prefer imputation techniques like mean imputation or multiple imputation for MCAR data, as they retain more participants.
- MAR: If the missingness depends on observed variables, more sophisticated imputation techniques become necessary. Multiple imputation, where multiple plausible datasets are created to account for the uncertainty of the missing values, is a robust choice. I often use this approach in my studies.
- MNAR: When missingness is related to unobserved variables, this is the most challenging situation. Specialized techniques such as maximum likelihood estimation or model-based imputation are often required. These necessitate careful consideration of the underlying mechanisms causing the missing data.
In practice, I always thoroughly explore the reasons for missing data and document my chosen method, clearly stating its limitations. For example, in a study on medication adherence, if patients who missed many doses also dropped out of the study, we’d need a technique that addresses this non-random missingness, and simple deletion would bias the results.
Career Expert Tips:
- Ace those interviews! Prepare effectively by reviewing the Top 50 Most Common Interview Questions on ResumeGemini.
- Navigate your job search with confidence! Explore a wide range of Career Tips on ResumeGemini. Learn about common challenges and recommendations to overcome them.
- Craft the perfect resume! Master the Art of Resume Writing with ResumeGemini’s guide. Showcase your unique qualifications and achievements effectively.
- Don’t miss out on holiday savings! Build your dream resume with ResumeGemini’s ATS optimized templates.
Q 16. What are some ethical considerations in experimental research?
Ethical considerations are paramount in experimental research. They guide every stage, from design to dissemination. Key aspects include:
- Informed Consent: Participants must fully understand the study’s purpose, procedures, risks, and benefits before agreeing to participate. They must have the freedom to withdraw at any time without penalty.
- Minimizing Risk: The potential risks to participants must be minimized and weighed against the potential benefits. This involves rigorous risk assessment and mitigation strategies.
- Confidentiality and Anonymity: Participant data must be protected to maintain confidentiality and, whenever possible, anonymity. Data security protocols are crucial.
- Justice and Equity: The selection of participants should be fair and equitable, avoiding bias and ensuring diverse representation. Studies should not disproportionately burden specific populations.
- Data Integrity: Researchers have a responsibility to collect and analyze data honestly and accurately, avoiding fabrication, falsification, or plagiarism. Transparency in data analysis and reporting is essential.
- Conflicts of Interest: Any potential conflicts of interest must be disclosed and managed transparently.
For instance, in a clinical trial testing a new drug, the ethical considerations include obtaining informed consent, ensuring the safety of participants, protecting patient confidentiality, and fairly selecting participants to represent the targeted population. Any potential conflicts of interest that may affect the study design, data analysis, or reporting must be addressed from the outset.
Q 17. Explain your experience with IRB procedures.
I have extensive experience with Institutional Review Board (IRB) procedures. My involvement includes submitting proposals, responding to IRB queries, obtaining necessary approvals, and adhering to ongoing reporting requirements. I’m familiar with the various ethical review boards’ regulations and guidelines.
The process typically involves crafting a detailed protocol describing the research methods, participant selection criteria, data collection and storage techniques, and risk mitigation strategies. I meticulously document all aspects of the study, including informed consent forms, data management plans, and any necessary amendments to the protocol. I understand the importance of maintaining ongoing communication with the IRB to ensure compliance and address any concerns they may raise. For example, in a recent study involving vulnerable populations, we had to undergo particularly rigorous ethical review and obtained special approvals to ensure full protection for participants.
Q 18. How do you ensure the reproducibility of your research?
Reproducibility is critical for the integrity of scientific findings. I prioritize it through meticulous documentation and open practices.
- Detailed Methodology: I write comprehensive research protocols that detail every step of the study design, data collection, and analysis. This includes software versions, data cleaning procedures, and statistical techniques employed. This helps others to replicate the entire study process.
- Data Sharing: Where possible and ethical, I make my data openly available through reputable repositories or with clear instructions for data access, with due consideration to data privacy and confidentiality.
- Code Sharing: I utilize version control systems like Git and share my analysis scripts and code (e.g., using R or Python) so others can reproduce my analyses.
- Transparent Reporting: I write clear, comprehensive reports, including limitations of the study and potential sources of bias or error, to enhance transparency and reproducibility.
For example, in a recent publication, I included a detailed appendix with the complete R code used for the data analysis, enabling others to replicate our findings precisely and check the integrity of the results. This openness fosters scientific scrutiny and collaboration.
Q 19. Describe your experience with data visualization techniques.
I’m proficient in various data visualization techniques, selecting the most appropriate method to effectively communicate my findings. My experience spans several tools including R (ggplot2), Python (Matplotlib, Seaborn), and specialized statistical software.
I use different visualization types depending on the nature of the data and research question. For example, scatter plots are suitable for showing relationships between two continuous variables, while bar charts are better for comparing groups. I also utilize box plots to show the distribution of data across groups, heatmaps for visualizing correlations, and network graphs for illustrating complex relationships. The choice depends on maximizing clarity and conveying the most important information without misrepresenting the data. For example, in visualizing the results of a clinical trial comparing two treatments, I would use bar charts to illustrate the treatment effects in a way that is easy for both clinicians and non-experts to understand.
Q 20. How do you choose appropriate statistical tests for your research question?
Selecting the right statistical test is crucial for drawing valid conclusions. It depends on several factors:
- Research Question: Is it about comparing means, proportions, or associations? This dictates the general class of test.
- Data Type: Are the variables continuous, categorical, or ordinal? The data type determines what tests can be applied.
- Data Distribution: Are the data normally distributed? This impacts the choice between parametric and non-parametric tests. Parametric tests (like t-tests or ANOVA) assume normality, while non-parametric tests (like Mann-Whitney U or Kruskal-Wallis) are more robust to non-normality.
- Sample Size: Sufficient sample size is crucial for reliable results, and some tests are more sensitive to small sample sizes than others.
For example, to compare the average blood pressure between two treatment groups with normally distributed data, I’d use an independent samples t-test. However, if the data was not normally distributed, I would opt for a Mann-Whitney U test. If I were comparing proportions of patients experiencing a side effect between the groups, I would use a chi-squared test or Fisher’s exact test, depending on sample size.
Q 21. Explain the concept of blinding in experimental studies.
Blinding, also known as masking, is a crucial technique to minimize bias in experimental studies, particularly in clinical trials. It involves concealing the treatment assignment (e.g., placebo vs. active treatment) from either the participants (single-blind), the researchers (double-blind), or both (triple-blind—where even the data analysts are unaware of treatment assignment).
Single-blinding prevents participant bias, where participants’ expectations might influence their responses. Double-blinding also prevents researcher bias, where the researchers’ knowledge of the treatment assignment might influence their assessment or interaction with participants. Triple-blinding extends this to prevent bias in the analysis of results.
In a clinical trial evaluating a new pain medication, double-blinding ensures that neither the participants nor the researchers assessing their pain levels know who received the actual medication versus the placebo. This minimizes the risk of subjective biases affecting the outcome measurement and enhances the objectivity of the results. The blinding procedure is meticulously documented and its efficacy is crucial for the integrity and reliability of the study findings.
Q 22. What are the limitations of experimental research?
Experimental research, while powerful, has inherent limitations. One major constraint is artificiality. The controlled environment of an experiment, while necessary for isolating variables, may not accurately reflect real-world complexities. For instance, studying the effects of a new teaching method in a highly structured lab setting might yield different results than implementing it in a diverse classroom.
Another limitation is generalizability. Findings from a specific sample population may not apply to other groups. A study on the effectiveness of a drug conducted solely on young, healthy adults may not accurately predict its efficacy in elderly patients with comorbidities.
Ethical concerns also play a significant role. Manipulating variables can sometimes be ethically problematic, particularly when it involves potential harm to participants. For example, withholding a potentially beneficial treatment from a control group raises serious ethical considerations.
Finally, experimenter bias can influence results, consciously or unconsciously. Researchers may inadvertently influence participants’ behavior or interpret data in a way that confirms their hypotheses. Using blinding techniques, where researchers are unaware of participants’ group assignment, helps mitigate this issue.
Q 23. Describe a time when you had to troubleshoot a problem during an experiment.
During a study on the impact of different lighting conditions on plant growth, we encountered unexpected inconsistencies in our data. Initially, we hypothesized that plants under blue light would show significantly higher growth rates. However, some plants in the blue light group showed unexpectedly low growth, while some in the control group thrived.
Our troubleshooting process involved systematically investigating potential confounding variables. We checked our equipment for malfunctions, ensuring consistent light intensity and duration across all groups. We also examined the environmental conditions, including temperature and humidity, ruling out significant variations. Ultimately, we discovered that a batch of seeds used for the blue light group had a lower germination rate due to a slight damage during storage. This initial oversight introduced a bias in our results. By accounting for this, we re-analyzed the data, leading to more accurate and reliable conclusions. This experience reinforced the critical need for meticulous attention to detail and thorough control of potential confounding variables in experimental research.
Q 24. How do you interpret p-values?
The p-value is a probability that measures the strength of evidence against a null hypothesis. It represents the probability of observing the obtained results (or more extreme results) if the null hypothesis were true. For example, a p-value of 0.05 indicates a 5% chance of observing the obtained results if there were actually no effect.
It is crucial to understand that a p-value doesn’t provide the probability that the null hypothesis is true; it only assesses the probability of the data given the null hypothesis. A small p-value (typically below 0.05) is often interpreted as statistically significant, suggesting sufficient evidence to reject the null hypothesis. However, it’s essential to consider the p-value in context with effect size, sample size, and the study design, as a statistically significant result doesn’t automatically imply practical significance.
It’s important to avoid solely relying on p-values. A more comprehensive approach involves considering the confidence intervals and effect sizes to understand the magnitude and precision of the findings.
Q 25. Explain your experience with longitudinal studies.
I’ve been involved in several longitudinal studies, focusing on the long-term effects of early childhood interventions on academic achievement. In one particular project, we tracked a cohort of children from kindergarten through high school, collecting data on their academic performance, social-emotional development, and family background at regular intervals.
The challenges inherent in longitudinal studies include participant attrition, the need for consistent data collection methods over extended periods, and the potential for confounding variables to emerge over time. For instance, changes in family dynamics or unforeseen life events could influence the children’s academic performance. To mitigate these challenges, we implemented robust data management protocols and used statistical techniques that accounted for attrition and other potential confounders. The strength of longitudinal studies lies in their capacity to examine changes and relationships over time, providing valuable insights that cross-sectional studies cannot provide. This study demonstrated a strong correlation between early literacy interventions and future academic success, reinforcing the importance of early childhood education.
Q 26. Describe your experience with factorial designs.
Factorial designs are incredibly useful for studying the effects of multiple independent variables simultaneously. In a recent project investigating the effects of fertilizer type (A, B, C) and watering frequency (daily, weekly) on crop yield, we used a 3×2 factorial design. This allowed us to examine the main effects of each independent variable (fertilizer type and watering frequency) as well as their interaction effect.
For example, we could assess whether the effect of fertilizer type on yield differed depending on the watering frequency. The data was analyzed using ANOVA, which allowed us to partition the variance in crop yield attributable to each factor and their interaction.
The advantage of factorial designs is their efficiency; they allow us to collect more information with fewer participants compared to conducting separate experiments for each combination of independent variables. The results showed a significant interaction effect, indicating that the optimal fertilizer type depended on the watering frequency; suggesting a different fertilizer recommendation based on how often crops are watered.
Q 27. How do you manage and organize large datasets?
Managing large datasets requires a structured approach. I rely heavily on relational databases (such as MySQL or PostgreSQL) to organize data efficiently. These databases allow for efficient data storage, retrieval, and manipulation. I use SQL (Structured Query Language) to query and analyze the data. For example, SELECT AVG(score) FROM students WHERE grade='A'; retrieves the average score for students in grade A.
Furthermore, I utilize statistical software packages like R or Python with libraries such as Pandas and Scikit-learn to handle data cleaning, transformation, and analysis. These tools offer powerful functionalities for data visualization, statistical modeling, and machine learning techniques, essential for extracting meaningful insights from extensive datasets. Good data organization from the outset is critical for facilitating efficient analysis and reducing potential errors.
Q 28. What is your experience with meta-analysis?
Meta-analysis is a powerful technique for synthesizing findings from multiple studies investigating the same research question. I’ve used meta-analysis to review the literature on the effectiveness of cognitive behavioral therapy (CBT) for anxiety disorders. By combining the results of numerous independent studies, we were able to obtain a more precise and robust estimate of CBT’s efficacy than any single study could provide.
The process involves systematically searching for relevant studies, extracting relevant data (e.g., effect sizes, sample sizes), assessing the quality of the studies, and then using statistical methods to combine the data. Software packages like RevMan or Comprehensive Meta-Analysis facilitate this process. It’s important to consider the heterogeneity of the studies (i.e., the variability in their methodologies and results) and address potential publication bias (the tendency for studies with positive results to be published more frequently). The meta-analysis revealed a significant positive effect of CBT on anxiety reduction, providing stronger evidence than individual studies alone.
Key Topics to Learn for Experimental Studies Interview
- Research Design: Understanding different experimental designs (e.g., between-subjects, within-subjects, factorial), their strengths and weaknesses, and choosing the appropriate design for a given research question. Consider the implications of randomization and control groups.
- Data Collection and Measurement: Mastering techniques for reliable and valid data collection, including operationalizing variables, selecting appropriate measurement scales, and minimizing bias. Explore different data types and their implications for analysis.
- Statistical Analysis: Developing a strong understanding of relevant statistical tests (e.g., t-tests, ANOVA, regression) and their application to experimental data. Focus on interpreting results and drawing meaningful conclusions.
- Experimental Control and Validity: Deeply understanding internal and external validity, threats to validity, and strategies to mitigate these threats. This includes considering confounding variables and the importance of replication.
- Ethical Considerations: Familiarity with ethical guidelines in research, including informed consent, deception, debriefing, and data privacy. Be prepared to discuss ethical implications of various experimental procedures.
- Interpretation and Reporting: Effectively communicating research findings through clear and concise reports, including the ability to present results in both written and visual formats (e.g., graphs, tables). Practice explaining complex concepts in a simple manner.
- Problem-Solving and Critical Thinking: Demonstrate your ability to analyze experimental results, identify limitations, and propose solutions to improve future research. Practice dissecting research papers and critiquing methodologies.
Next Steps
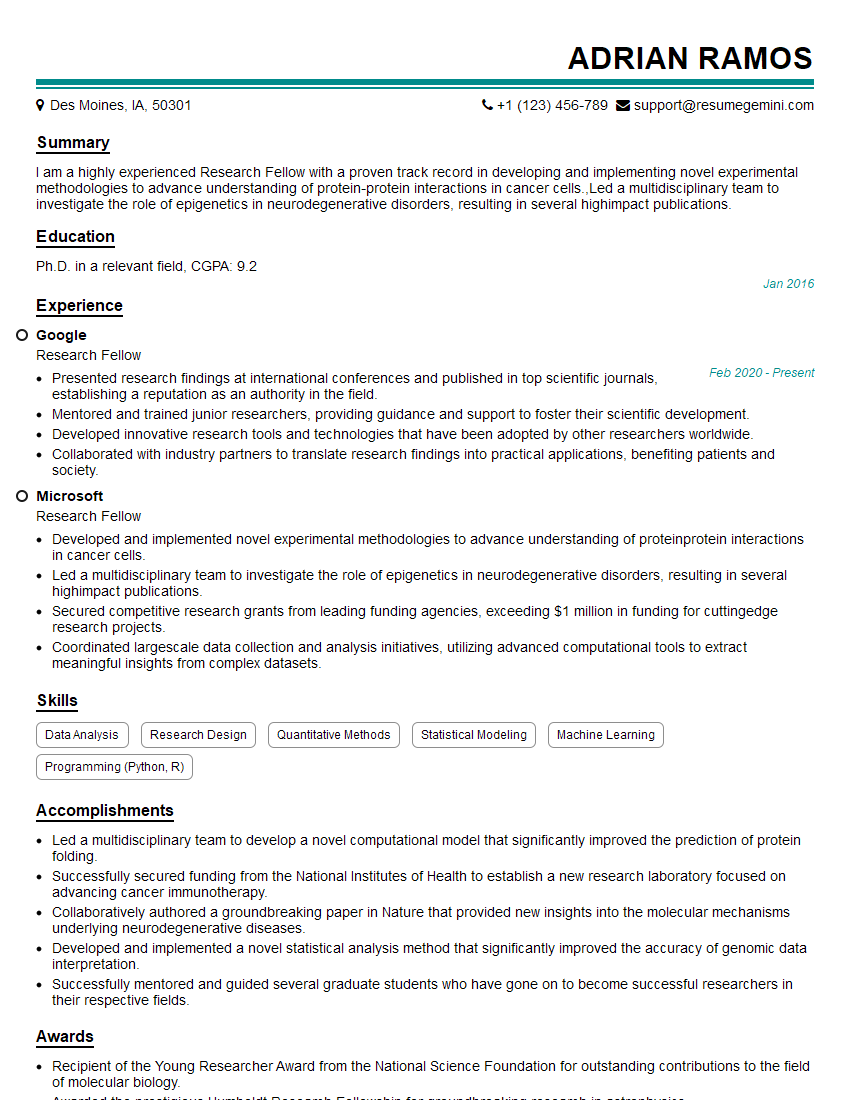
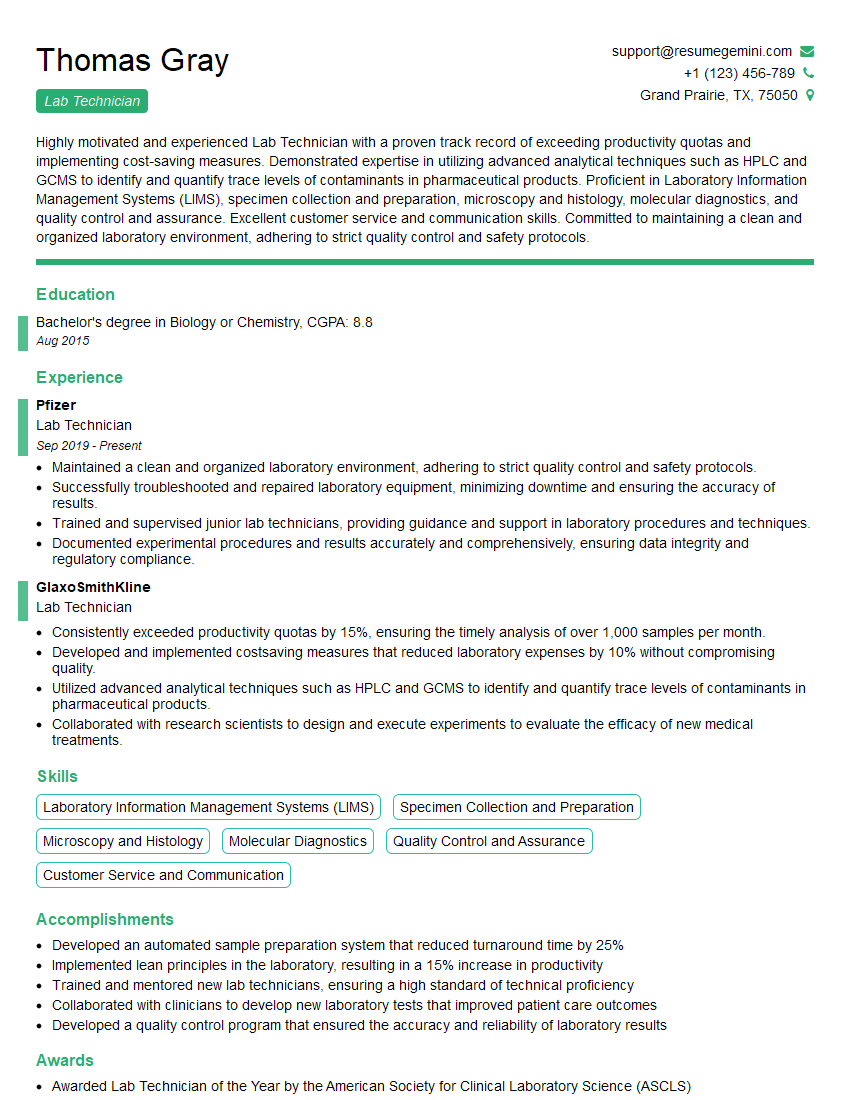
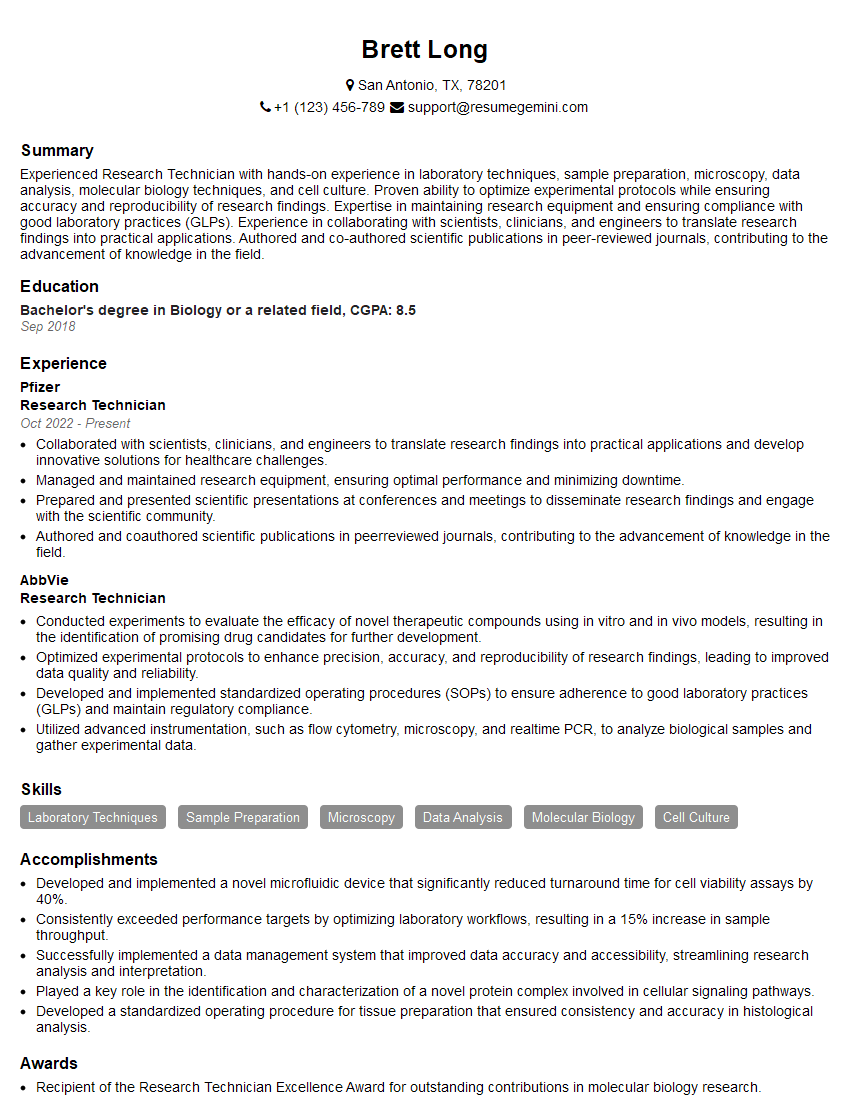
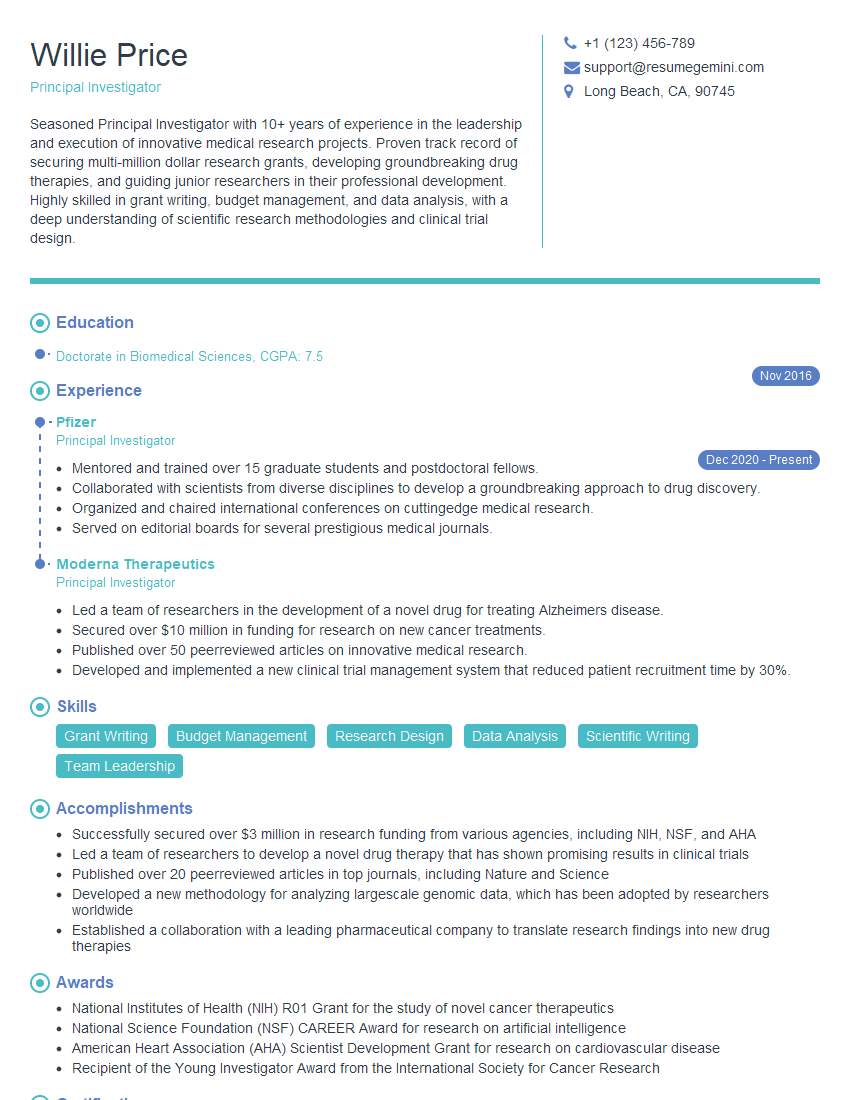
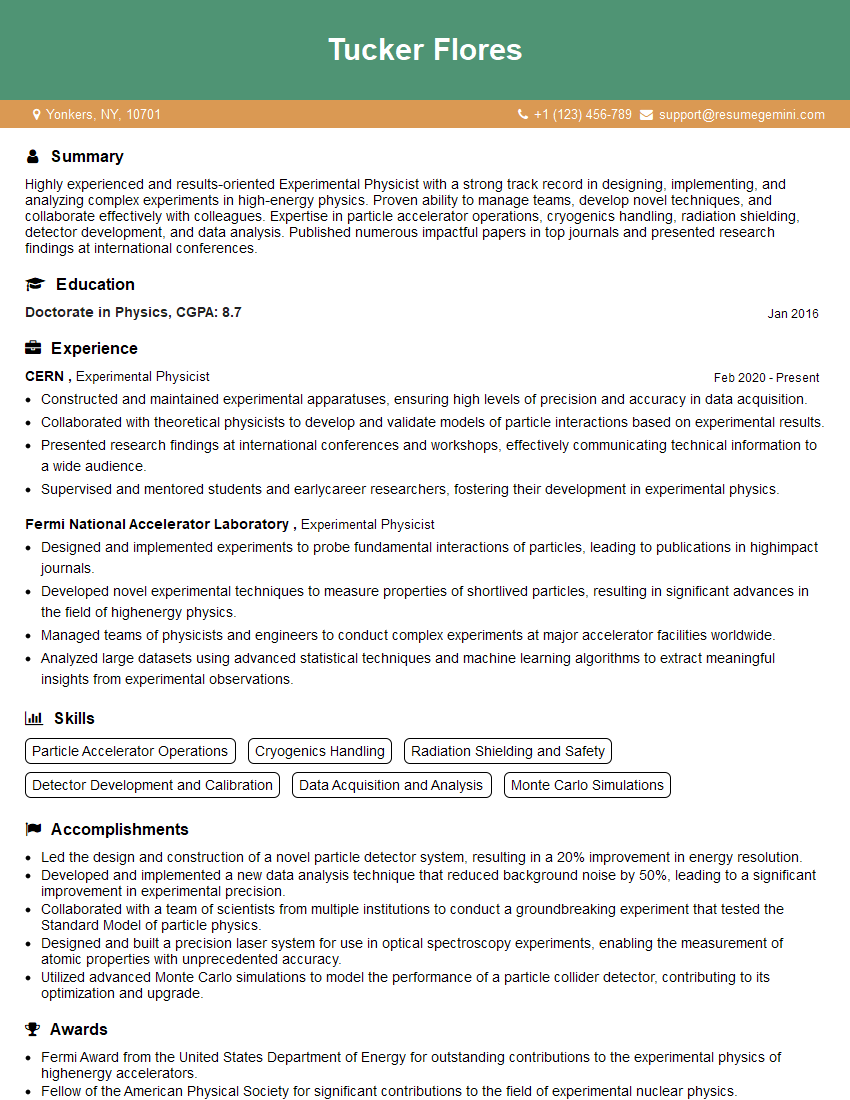
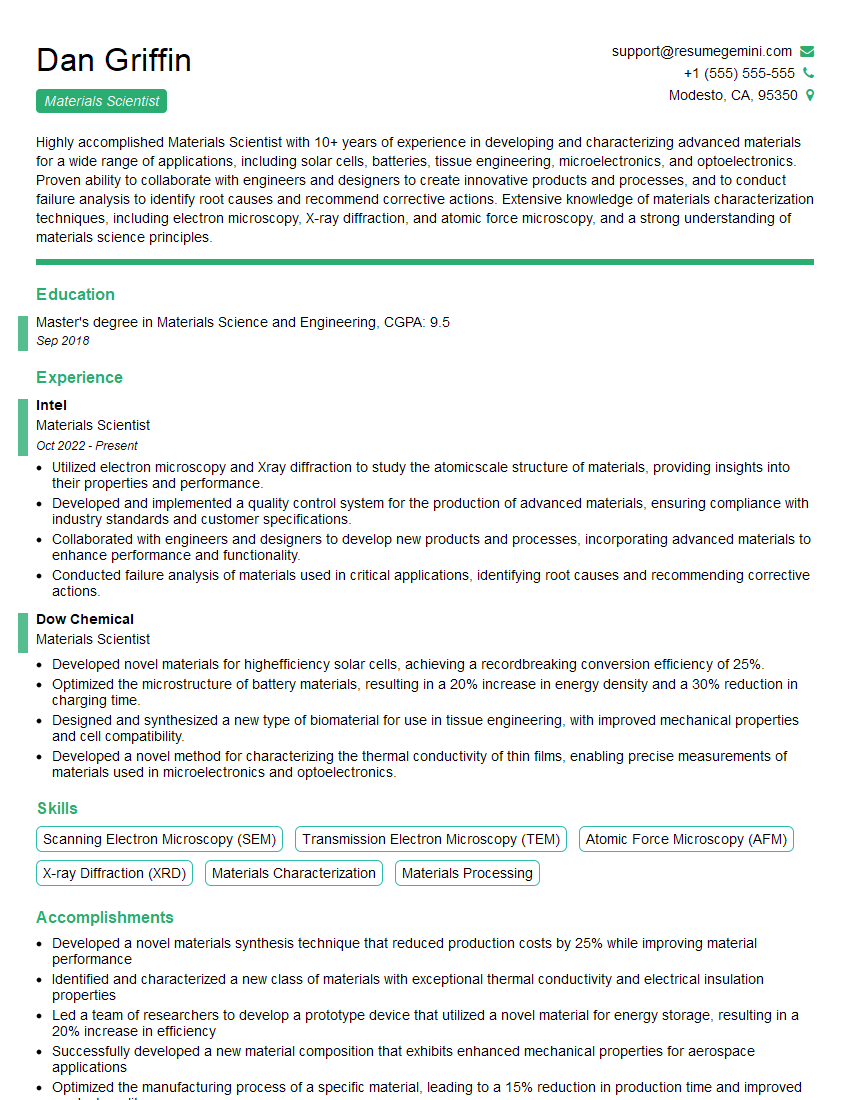
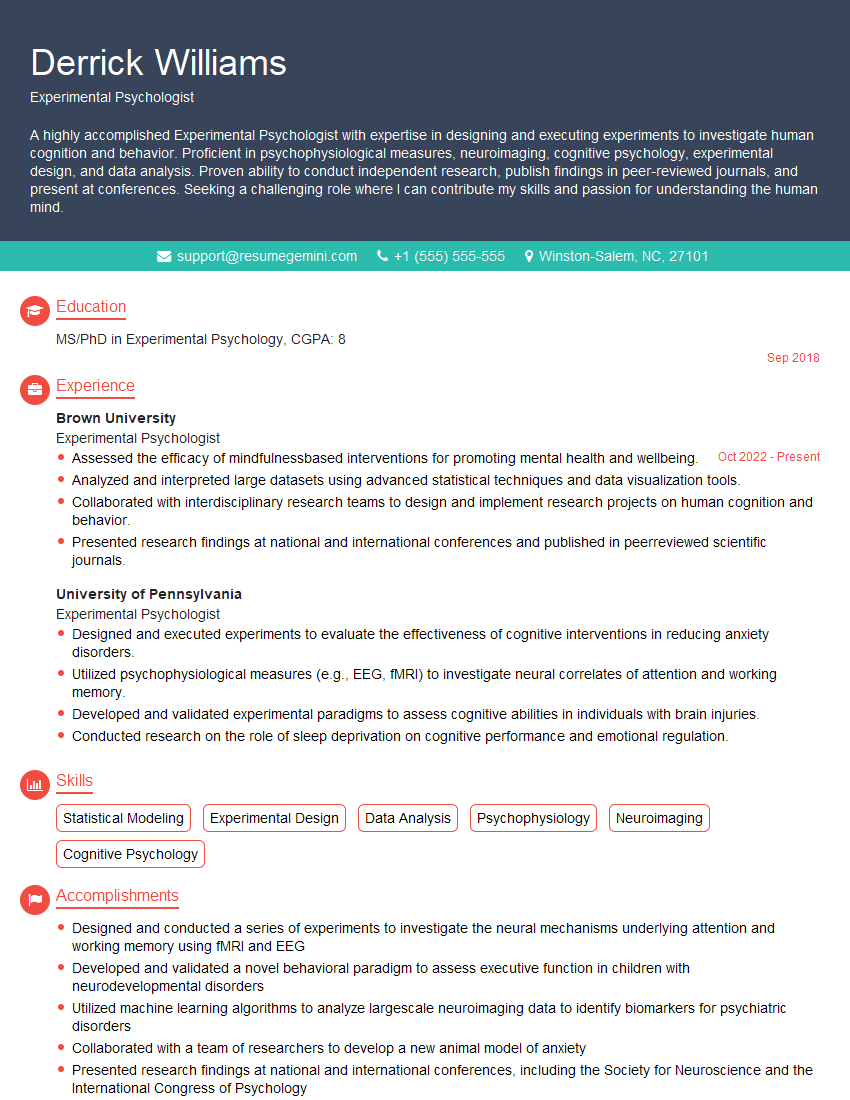
Mastering experimental studies is crucial for career advancement in research-intensive fields. A strong understanding of experimental design, analysis, and interpretation is highly valued by employers. To significantly boost your job prospects, create an ATS-friendly resume that highlights your skills and experience effectively. ResumeGemini is a trusted resource that can help you build a professional and impactful resume tailored to the demands of the Experimental Studies field. Examples of resumes specifically designed for Experimental Studies professionals are available to guide you.
Explore more articles
Users Rating of Our Blogs
Share Your Experience
We value your feedback! Please rate our content and share your thoughts (optional).
What Readers Say About Our Blog
Hello,
We found issues with your domain’s email setup that may be sending your messages to spam or blocking them completely. InboxShield Mini shows you how to fix it in minutes — no tech skills required.
Scan your domain now for details: https://inboxshield-mini.com/
— Adam @ InboxShield Mini
Reply STOP to unsubscribe
Hi, are you owner of interviewgemini.com? What if I told you I could help you find extra time in your schedule, reconnect with leads you didn’t even realize you missed, and bring in more “I want to work with you” conversations, without increasing your ad spend or hiring a full-time employee?
All with a flexible, budget-friendly service that could easily pay for itself. Sounds good?
Would it be nice to jump on a quick 10-minute call so I can show you exactly how we make this work?
Best,
Hapei
Marketing Director
Hey, I know you’re the owner of interviewgemini.com. I’ll be quick.
Fundraising for your business is tough and time-consuming. We make it easier by guaranteeing two private investor meetings each month, for six months. No demos, no pitch events – just direct introductions to active investors matched to your startup.
If youR17;re raising, this could help you build real momentum. Want me to send more info?
Hi, I represent an SEO company that specialises in getting you AI citations and higher rankings on Google. I’d like to offer you a 100% free SEO audit for your website. Would you be interested?
Hi, I represent an SEO company that specialises in getting you AI citations and higher rankings on Google. I’d like to offer you a 100% free SEO audit for your website. Would you be interested?
good
