Preparation is the key to success in any interview. In this post, we’ll explore crucial Data Collection (qualitative and quantitative) interview questions and equip you with strategies to craft impactful answers. Whether you’re a beginner or a pro, these tips will elevate your preparation.
Questions Asked in Data Collection (qualitative and quantitative) Interview
Q 1. Explain the difference between qualitative and quantitative data collection methods.
Qualitative and quantitative data collection methods differ fundamentally in their approach to understanding a phenomenon. Qualitative methods focus on exploring in-depth the why behind observations, gathering rich descriptive data, often in the form of text or images. Think of it like painting a detailed picture – you capture nuances and subtleties. Quantitative methods, on the other hand, focus on measuring and quantifying aspects of the phenomenon, producing numerical data that can be statistically analyzed. This is more like taking a precise measurement – you get a specific number, often a frequency or count.
- Qualitative: Examples include interviews, focus groups, case studies, and ethnography. Imagine conducting in-depth interviews to understand customer satisfaction with a new product; their experiences provide valuable context beyond just a numerical rating.
- Quantitative: Examples include surveys with multiple-choice questions, experiments, and observational studies involving counts or measurements. Think about a clinical trial measuring the efficacy of a drug through blood tests and patient recovery rates.
The choice between these methods depends on the research question. If you want to explore complex social processes, qualitative methods are ideal. If you need to test hypotheses or establish relationships between variables, quantitative methods are more appropriate.
Q 2. What are the strengths and weaknesses of surveys as a data collection method?
Surveys are a popular quantitative data collection method, offering several strengths but also presenting some limitations.
- Strengths:
- Cost-effective: Surveys, particularly online surveys, can reach a large number of participants at a relatively low cost compared to methods like in-person interviews.
- Large sample sizes: This allows for greater generalizability of findings to a wider population.
- Standardized data: Questions are structured consistently, enabling easier analysis and comparison of responses.
- Anonymity and confidentiality: Participants may feel more comfortable sharing sensitive information if they feel their responses are anonymous.
- Weaknesses:
- Response bias: People who choose to respond might differ systematically from those who don’t, affecting the representativeness of the sample.
- Superficiality: Surveys often fail to capture the complexity of human behavior or underlying reasons behind responses.
- Question bias: The wording of questions can influence responses, potentially leading to inaccurate data.
- Low response rates: Can undermine the reliability and validity of the findings.
For example, a survey on customer satisfaction might produce high response rates if the incentive is a discount, but the responses might reflect satisfaction with the incentive rather than true satisfaction with the product.
Q 3. Describe different sampling techniques and when each is appropriate.
Sampling techniques are crucial for selecting a representative subset of the population to study. The choice of technique depends on the research question, resources, and the nature of the population.
- Probability Sampling: Every member of the population has a known chance of being selected.
- Simple Random Sampling: Every member has an equal chance. Think of drawing names from a hat.
- Stratified Random Sampling: The population is divided into strata (e.g., age groups), and a random sample is drawn from each stratum to ensure representation of subgroups.
- Cluster Sampling: The population is divided into clusters (e.g., geographical areas), and a random sample of clusters is selected, followed by sampling within those clusters.
- Non-probability Sampling: The probability of selecting each member is unknown.
- Convenience Sampling: Selecting readily available participants. This is easy but can lead to significant bias.
- Snowball Sampling: Participants refer other participants, useful for hard-to-reach populations, but introduces potential bias.
- Purposive Sampling: Researchers hand-pick participants based on specific characteristics relevant to the study.
For instance, if studying voter preferences, stratified sampling would be useful to ensure representation of different demographic groups. If studying a rare disease, snowball sampling might be necessary to find sufficient participants.
Q 4. How do you ensure the reliability and validity of your data collection instruments?
Ensuring reliability and validity is paramount for trustworthy data. Reliability refers to the consistency of the measurement; validity refers to the accuracy of the measurement in capturing what it intends to measure.
- Reliability:
- Test-retest reliability: Administering the same instrument to the same participants at different times to assess consistency of scores.
- Internal consistency reliability: Measuring the consistency of items within a questionnaire (Cronbach’s alpha).
- Inter-rater reliability: Assessing the agreement between different raters when using subjective measures.
- Validity:
- Content validity: Ensuring the instrument covers all relevant aspects of the construct being measured.
- Criterion validity: Correlating the instrument with an external criterion (e.g., comparing survey scores with observed behavior).
- Construct validity: Assessing whether the instrument measures the theoretical construct it is designed to measure.
For example, a survey on job satisfaction should have high internal consistency if the items measuring job satisfaction are all related. Its criterion validity could be assessed by comparing survey scores with employee turnover rates.
Q 5. What are some common biases in data collection, and how can they be mitigated?
Biases can significantly distort the results. Understanding and mitigating them is crucial.
- Sampling bias: Occurs when the sample is not representative of the population (e.g., convenience sampling).
- Measurement bias: Occurs due to flaws in the instrument or how it’s administered (e.g., leading questions in a survey).
- Response bias: Participants may respond in a way that they think is socially desirable or to please the researcher.
- Confirmation bias: Researchers may interpret data to support pre-existing beliefs.
Mitigation strategies:
- Use appropriate sampling techniques to obtain a representative sample.
- Carefully design questions to avoid leading or ambiguous phrasing.
- Ensure anonymity and confidentiality to encourage honest responses.
- Use blinding techniques to prevent researcher bias.
- Triangulate data using multiple data sources to cross-validate findings.
For instance, a researcher studying gender bias in hiring might unknowingly show favoritism to female candidates if not using a blinded review process.
Q 6. Explain the concept of data cleaning and its importance.
Data cleaning is the process of identifying and correcting or removing errors and inconsistencies in data. It’s a crucial step before analysis because inaccurate or incomplete data can lead to misleading results.
Importance:
- Improved data quality: Removing errors and inconsistencies ensures more accurate analysis.
- Enhanced data integrity: Data cleaning improves the reliability and trustworthiness of the findings.
- Better analysis: Clean data facilitates efficient and effective statistical analysis.
- Reliable results: Data cleaning reduces the risk of drawing incorrect conclusions from flawed data.
Common data cleaning tasks:
- Handling missing values (imputation or removal).
- Identifying and correcting outliers (extreme values).
- Identifying and correcting inconsistencies (e.g., different spellings of the same value).
- Removing duplicates.
- Transforming data (e.g., converting data types).
Q 7. How do you handle missing data in your analyses?
Handling missing data is a critical aspect of data analysis. Ignoring it can lead to biased and unreliable results. The best approach depends on the nature of the missing data and the research question.
- Listwise deletion: Removing entire cases with missing values. Simple but leads to loss of information and bias if missingness is not random.
- Pairwise deletion: Using available data for each analysis. Can lead to inconsistencies if different analyses use different subsets of data.
- Imputation: Replacing missing values with estimated values.
- Mean/median/mode imputation: Simple, but can distort the distribution of the variable.
- Regression imputation: Predicting missing values based on other variables.
- Multiple imputation: Creating multiple plausible imputed datasets to account for uncertainty.
The choice of method depends on the pattern of missingness (Missing Completely at Random (MCAR), Missing at Random (MAR), Missing Not at Random (MNAR)). For example, if missing data is MCAR, mean imputation might be acceptable for a large dataset, but if the missingness is related to the variable itself (MNAR), multiple imputation would be more appropriate.
Q 8. Describe your experience with different data collection tools (e.g., SurveyMonkey, Qualtrics).
My experience spans a wide range of data collection tools, both for quantitative and qualitative research. I’m proficient in using platforms like SurveyMonkey and Qualtrics for creating and deploying surveys. SurveyMonkey is excellent for simpler surveys with straightforward analysis needs, while Qualtrics offers more advanced features, like branching logic, sophisticated question types, and robust data export options. For example, I used Qualtrics to build a complex survey with embedded videos and personalized questions for a customer satisfaction study, allowing for a much richer data set than a simple SurveyMonkey survey would have provided. Beyond these, I’m also comfortable working with other tools such as Google Forms for simpler needs and dedicated software for ethnographic research and interview transcription. The choice of tool always depends on the research question, budget, and the complexity of the data analysis required.
Q 9. How do you determine the appropriate sample size for a research project?
Determining the appropriate sample size is crucial for achieving statistically meaningful results. It’s not a one-size-fits-all answer; it depends on several factors including the desired level of precision (margin of error), the confidence level, and the variability within the population you’re studying. For example, if you’re studying a very homogeneous population, you may need a smaller sample size compared to a highly diverse population. I often use power analysis to calculate the necessary sample size. This involves specifying the desired effect size, alpha level (Type I error rate), and beta level (Type II error rate). Software packages like G*Power can help automate this process. In a recent study on employee engagement, I used power analysis to determine a sample size of 200 employees, ensuring a margin of error of +/- 5% with a 95% confidence level. For qualitative research, sample size determination is different; it is driven by saturation—the point at which gathering additional data doesn’t yield new insights—rather than statistical power.
Q 10. What ethical considerations are important in data collection?
Ethical considerations are paramount in data collection. Key principles include informed consent, ensuring participants understand the study’s purpose, procedures, risks, and benefits before agreeing to participate. This means providing clear and accessible information, tailored to the participant’s understanding. Privacy and confidentiality are essential. Data minimization—collecting only necessary data—is critical, as is data security to protect against unauthorized access. Beneficence and non-maleficence are key; we must strive to maximize benefits and minimize potential harms to participants. For example, in a study involving sensitive topics like mental health, it’s crucial to have mechanisms in place for providing support or referrals if needed. Transparency and honesty throughout the research process are crucial to maintaining ethical integrity.
Q 11. How do you ensure the confidentiality and anonymity of participants?
Ensuring confidentiality and anonymity requires a multi-faceted approach. Anonymity means that participants’ identities are not known, even to the researchers. This is achieved by assigning unique identifiers instead of using names or other identifying information. Confidentiality means that even if participants’ identities are known, their data will be protected from unauthorized disclosure. This involves secure data storage, using encryption if necessary, and adhering to strict data access protocols. Only authorized personnel should have access to the data. In my work, I use techniques like de-identification of data, which involves removing any identifying information before analysis. I also use secure servers and cloud storage with appropriate access controls to safeguard data. Informed consent forms clearly outline how data will be handled, stored, and protected.
Q 12. Explain the process of developing a research question and translating it into a data collection plan.
Developing a research question and translating it into a data collection plan is a systematic process. It begins with a clearly defined research question, which should be specific, measurable, achievable, relevant, and time-bound (SMART). For instance, instead of asking “How do customers feel about our product?”, a better question would be “What are the three most important factors influencing customer satisfaction with our product, and how satisfied are customers with each factor on a 1-5 scale?” Then, I select appropriate methods for collecting data – surveys, interviews, observations, or experiments – based on the research question and the nature of the data needed. A detailed data collection plan includes defining the target population, the sampling method, the data collection instruments (e.g., questionnaires, interview guides), data collection procedures, and a timeline. Pilot testing the data collection instruments is crucial to identify and address potential issues before the main data collection phase.
Q 13. How do you analyze qualitative data (e.g., thematic analysis, grounded theory)?
Analyzing qualitative data often involves iterative processes like thematic analysis or grounded theory. Thematic analysis focuses on identifying recurring themes or patterns within the data. This involves coding the data (assigning labels to meaningful segments), identifying patterns in the codes, developing themes from these patterns, and reviewing and refining these themes. Grounded theory, on the other hand, aims to generate a theory based on the data itself. This is achieved through a more inductive approach, constantly comparing data and developing concepts to explain them. In a recent study on the challenges faced by entrepreneurs, I used thematic analysis to uncover key themes related to access to capital, regulatory hurdles, and market competition. Software like NVivo can facilitate the management and analysis of large qualitative datasets.
Q 14. What statistical methods are you familiar with for analyzing quantitative data?
My expertise in quantitative data analysis encompasses a range of statistical methods. I’m proficient in descriptive statistics, including measures of central tendency (mean, median, mode) and dispersion (standard deviation, variance). I use inferential statistics to test hypotheses and make generalizations about the population based on sample data. This includes t-tests, ANOVA, regression analysis (linear, multiple, logistic), and correlation analysis. For example, in a study examining the relationship between employee training and job performance, I used multiple regression analysis to determine the impact of different training programs on performance while controlling for other factors. I’m also familiar with more advanced techniques like structural equation modeling and time series analysis. I utilize statistical software like SPSS, R, and SAS for data analysis and visualization.
Q 15. Describe your experience with data visualization and presentation.
Data visualization and presentation are crucial for effectively communicating insights derived from data. My experience encompasses creating various visualizations, from simple charts and graphs to interactive dashboards, using tools like Tableau, Power BI, and Python libraries such as Matplotlib and Seaborn. I tailor my visualizations to the audience and the specific message I want to convey. For instance, for a technical audience, I might use detailed charts showcasing statistical distributions, while for a business audience, I might opt for simpler bar charts highlighting key performance indicators (KPIs). I always ensure my visualizations are clear, concise, and aesthetically pleasing, avoiding chart junk and focusing on data integrity. I believe in the power of storytelling with data, and I strive to create presentations that are not just informative but also engaging and memorable. A recent project involved visualizing customer segmentation data using a combination of heatmaps and cluster plots in Tableau, which allowed stakeholders to easily understand distinct customer profiles and inform marketing strategies.
Career Expert Tips:
- Ace those interviews! Prepare effectively by reviewing the Top 50 Most Common Interview Questions on ResumeGemini.
- Navigate your job search with confidence! Explore a wide range of Career Tips on ResumeGemini. Learn about common challenges and recommendations to overcome them.
- Craft the perfect resume! Master the Art of Resume Writing with ResumeGemini’s guide. Showcase your unique qualifications and achievements effectively.
- Don’t miss out on holiday savings! Build your dream resume with ResumeGemini’s ATS optimized templates.
Q 16. How do you interpret statistical results and draw meaningful conclusions?
Interpreting statistical results requires a critical and nuanced approach. I begin by understanding the context of the data and the research question. Then, I examine the descriptive statistics (mean, median, standard deviation, etc.) to get a general sense of the data distribution. I then delve into inferential statistics, looking at p-values, confidence intervals, and effect sizes to determine the statistical significance and practical importance of the findings. I also pay close attention to potential biases, limitations, and confounding variables that might influence the results. For example, if a study shows a correlation between ice cream sales and crime rates, I wouldn’t conclude that ice cream causes crime. Instead, I’d consider a confounding variable like hot weather, which influences both ice cream sales and crime rates. Ultimately, my goal is to draw meaningful and accurate conclusions that are supported by the evidence and avoid overinterpreting the data. I always document my analysis process clearly and transparently, enabling others to scrutinize my findings.
Q 17. How do you manage large datasets efficiently?
Managing large datasets efficiently is essential for timely and accurate analysis. My approach involves several strategies, beginning with data cleaning and pre-processing. I leverage tools like SQL and Python (with libraries like Pandas and Dask) to filter, transform, and aggregate data effectively. For very large datasets that don’t fit in memory, I utilize distributed computing frameworks like Spark or Hadoop to process data in parallel. I also employ techniques like data sampling and dimensionality reduction (PCA, t-SNE) to reduce the dataset’s size while preserving essential information. Furthermore, I meticulously plan the data storage and retrieval process using appropriate databases (SQL or NoSQL) based on the data structure and query patterns. Data compression techniques are also utilized to optimize storage and reduce processing times. In a recent project involving millions of customer transactions, I used Spark to efficiently process and aggregate data, enabling quick generation of sales reports and customer insights.
Q 18. What programming languages or software are you proficient in for data analysis?
I am proficient in several programming languages and software for data analysis. My core skills lie in Python, utilizing libraries like Pandas, NumPy, Scikit-learn, Matplotlib, Seaborn, and TensorFlow/PyTorch for data manipulation, statistical modeling, machine learning, and data visualization. I also have expertise in SQL for database management and data querying. I’m familiar with R and its statistical packages, and I have experience using business intelligence tools such as Tableau and Power BI for data visualization and dashboard creation. My proficiency extends to cloud computing platforms like AWS and Azure, allowing me to efficiently manage and process large datasets in a scalable environment.
Q 19. Describe a time when you had to overcome a challenge in data collection.
During a research project on consumer behavior, we encountered a significant challenge with participant response rates in our online surveys. Initial response rates were low, threatening the validity of our findings. To overcome this, we implemented several strategies. First, we refined our survey design, making it shorter and more user-friendly. Second, we employed multiple modes of recruitment, including social media campaigns, email invitations, and partnerships with relevant organizations. Third, we introduced incentives like gift cards for participants. Finally, we implemented a system for automated follow-up emails to remind non-respondents. This multi-pronged approach significantly improved our response rate, allowing us to collect sufficient data for robust analysis and achieve our research objectives.
Q 20. How do you ensure the quality of data throughout the collection process?
Ensuring data quality is paramount. My approach is a multi-step process that begins with careful planning and defining clear data requirements. This includes specifying data collection methods, defining data fields and their formats, and creating detailed data dictionaries. During the data collection phase, I implement rigorous data validation checks to identify and correct errors in real time, whenever possible. This can involve data type validation, range checks, and consistency checks. After data collection, I perform thorough data cleaning, which involves handling missing values (imputation or removal), identifying and correcting outliers, and addressing inconsistencies. I also employ various data quality assessment techniques to monitor data accuracy, completeness, and consistency. Data profiling is used to identify potential issues early on. Finally, documentation of all data processing steps is crucial to ensure transparency and reproducibility.
Q 21. What are the key differences between structured and unstructured data?
Structured and unstructured data differ fundamentally in their organization and format. Structured data is organized in a predefined format, typically relational databases with rows and columns. Each column represents a specific attribute, and each row represents an instance or record. Examples include data in CSV files, SQL databases, or spreadsheets. Unstructured data, on the other hand, lacks a predefined format and can take many forms, such as text documents, images, audio files, and videos. Analyzing unstructured data often requires techniques like natural language processing (NLP) for text, image recognition for images, and audio processing for sound. The key difference lies in the ease of analysis. Structured data is easily analyzed using standard statistical methods and SQL queries, while unstructured data requires more sophisticated techniques and often involves machine learning algorithms.
Q 22. How do you handle conflicting data from different sources?
Conflicting data is inevitable when collecting information from multiple sources. It’s a common challenge that requires careful consideration and a systematic approach. My strategy involves a multi-step process focusing on identification, analysis, and resolution. First, I meticulously document the discrepancies, noting the source and context of each conflicting data point. This involves comparing data sets using tools like spreadsheets or dedicated data comparison software. Next, I analyze the discrepancies to understand the potential causes – are they due to measurement error, differing methodologies, or inherent biases within specific sources? I might also consider the reliability and validity of each source – a reputable government statistic would carry more weight than an anonymous online forum post, for instance. Finally, I address the conflict. This could involve weighting data based on source credibility, using statistical techniques to identify outliers, or even re-examining the data collection methods to uncover systematic errors. Sometimes, reconciling conflicts requires further investigation or even the exclusion of less reliable data points. For example, if conducting market research and finding conflicting pricing data from two retailers, I’d verify pricing directly with each retailer before drawing conclusions.
Q 23. Explain the concept of triangulation in data collection.
Triangulation in data collection refers to the use of multiple data sources or methods to confirm or validate findings. Think of it like using three points to pinpoint a location on a map – each point offers its perspective, and their intersection confirms the accuracy of the location. Similarly, triangulation enhances the trustworthiness and validity of research by reducing reliance on any single source of information and its potential biases. For instance, if researching employee satisfaction, I might use quantitative surveys to gather numerical data, qualitative interviews to understand individual experiences in detail, and analyze existing company documents (e.g., performance reviews) for additional insights. The convergence of findings across these different methods builds a stronger case for the conclusions drawn.
Q 24. Describe your experience with different types of interviews (e.g., structured, semi-structured, unstructured).
My experience spans a broad range of interview types, each serving different purposes. Structured interviews use pre-determined questions and are highly standardized. They’re excellent for collecting consistent data across a large sample, ensuring comparability, but may lack the depth and flexibility for exploring unexpected insights. I’ve used this approach extensively in large-scale surveys. Semi-structured interviews employ a prepared interview guide with flexibility to explore topics in more detail based on the respondent’s answers. This provides a balance between standardization and flexibility, allowing for richer qualitative data. I often use this approach when exploring sensitive issues or in-depth opinions. Finally, unstructured interviews are more conversational, with open-ended questions allowing for spontaneous exploration of themes and ideas. They are best for gaining a deep understanding of a specific phenomenon, perhaps for a case study, but require strong interviewer skills to maintain focus and consistency. For example, I used unstructured interviews when interviewing artists about their creative processes to better understand their unique approaches.
Q 25. How do you ensure the objectivity of your data collection process?
Ensuring objectivity in data collection is paramount. It’s a multifaceted process that starts with careful planning and design. First, I define clear research questions and operationalize concepts to minimize ambiguity and subjective interpretation. For example, if studying ‘job satisfaction,’ I need to define it operationally in measurable terms. Second, I employ rigorous data collection methods, such as standardized questionnaires or structured observation protocols, to minimize researcher bias. Third, I strive for transparency in documenting the entire process, including data collection instruments, procedures, and any limitations. This allows others to scrutinize the methodology and evaluate the validity of the findings. Finally, I’m committed to using appropriate analytical techniques, ensuring the correct statistical methods are applied to the data and interpreting results cautiously, avoiding drawing unwarranted conclusions.
Q 26. What are your preferred methods for conducting focus groups?
My preferred methods for conducting focus groups center around careful planning and moderation. I begin by recruiting a homogenous group of participants who share relevant characteristics for the research topic. For example, when researching consumer preferences for a new product, I’d recruit participants within a specific age range and income bracket. Then I develop a detailed discussion guide with open-ended questions designed to stimulate discussion and encourage diverse perspectives. During the focus group, I act as a facilitator, ensuring all participants have the opportunity to contribute, managing the conversation to stay on track, and probing responses for deeper insights. I use techniques such as active listening, paraphrasing, and summarizing to ensure the discussion remains focused and productive. After the focus group, I meticulously transcribe the audio recording and analyze the data using thematic analysis to identify recurring themes and patterns.
Q 27. How do you ensure the generalizability of your findings?
Generalizability refers to the extent to which findings from a study can be applied to a larger population beyond the sample studied. Achieving high generalizability requires careful consideration of sampling techniques. A representative sample, obtained through probability sampling methods like random sampling or stratified sampling, is crucial. For instance, if studying voter preferences, I’d use a stratified random sample to ensure representation across different demographics. However, even with the best sampling, generalizability is always relative. The study’s context, including the specific time period and geographical location, impacts the generalizability of the findings. I always explicitly discuss the limitations of generalizability in my reports, acknowledging factors that might restrict the applicability of the results to other contexts.
Key Topics to Learn for Data Collection (Qualitative and Quantitative) Interview
- Qualitative Data Collection Methods: Understanding and applying techniques like interviews (structured, semi-structured, unstructured), focus groups, observations, and document analysis. Consider ethical considerations and bias mitigation in each method.
- Quantitative Data Collection Methods: Mastering surveys (design, sampling, questionnaire creation), experiments, and existing datasets (e.g., census data, government reports). Focus on data validity and reliability.
- Sampling Techniques: Understanding probability (random, stratified, cluster) and non-probability (convenience, snowball) sampling methods and their applications. Knowing when to use each method is crucial.
- Data Cleaning and Preparation: Developing skills in handling missing data, outlier detection, and data transformation for both qualitative (e.g., thematic analysis) and quantitative (e.g., statistical software) analysis.
- Ethical Considerations in Data Collection: Understanding informed consent, confidentiality, anonymity, and the responsible use of data. This is paramount in any data collection role.
- Data Analysis Fundamentals: While in-depth analysis might be handled by others, possessing foundational knowledge of descriptive statistics (for quantitative data) and qualitative data analysis techniques (coding, thematic analysis) demonstrates a well-rounded understanding.
- Software Proficiency: Highlighting familiarity with relevant software (e.g., SPSS, R, NVivo, Atlas.ti) depending on the job description. Be prepared to discuss your experience and proficiency level.
- Problem-Solving and Critical Thinking: Be ready to discuss how you would approach challenges like low response rates in surveys, inconsistent data from interviews, or ethical dilemmas encountered during data gathering.
Next Steps
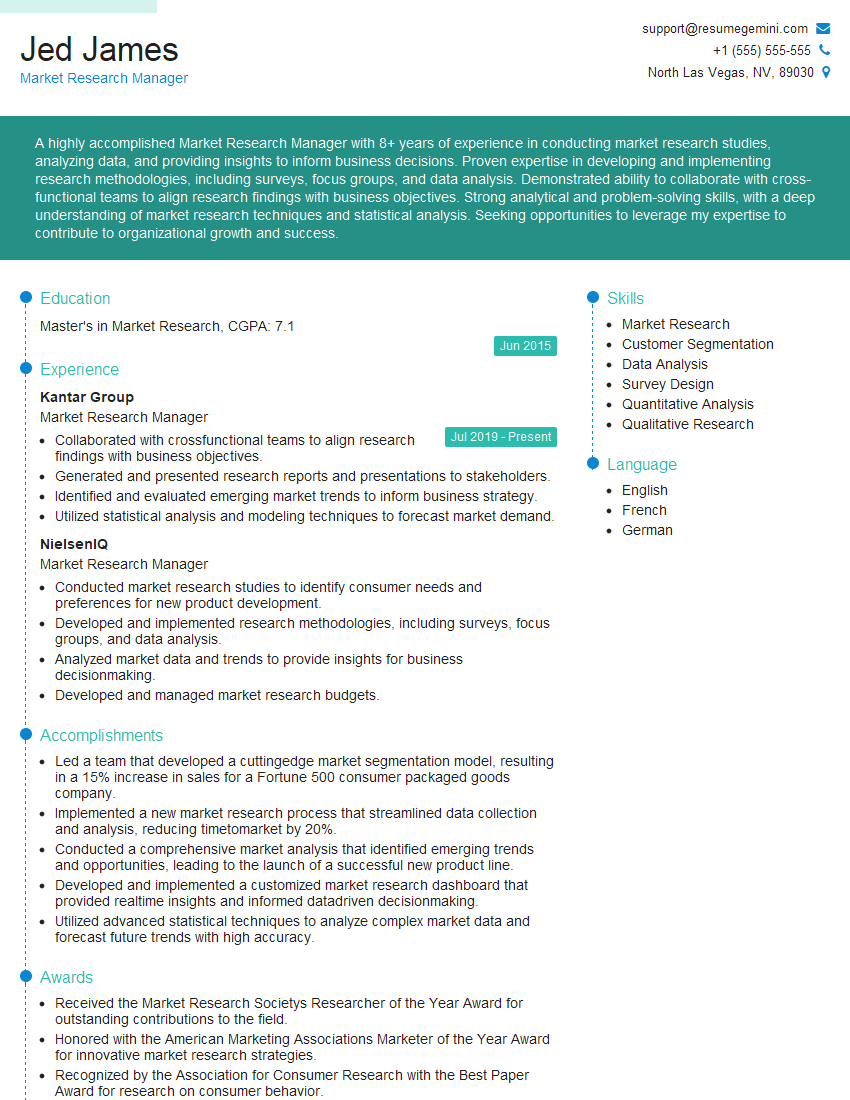
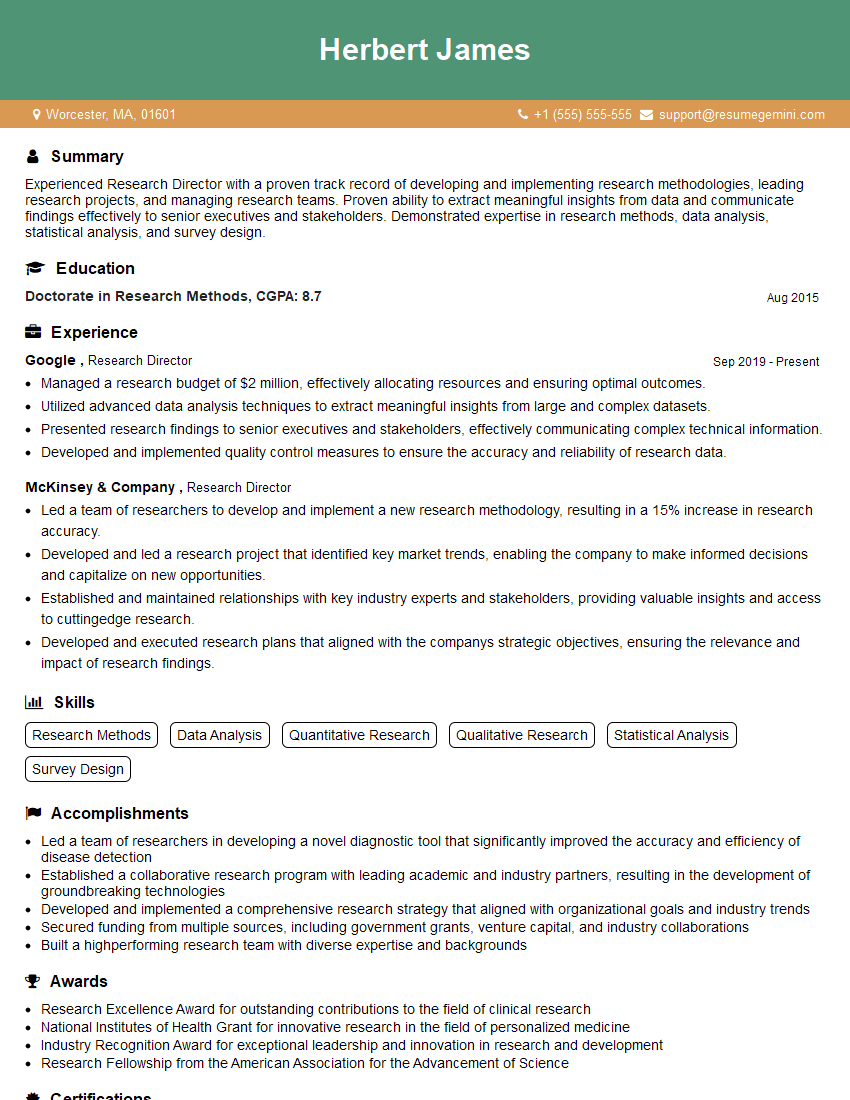
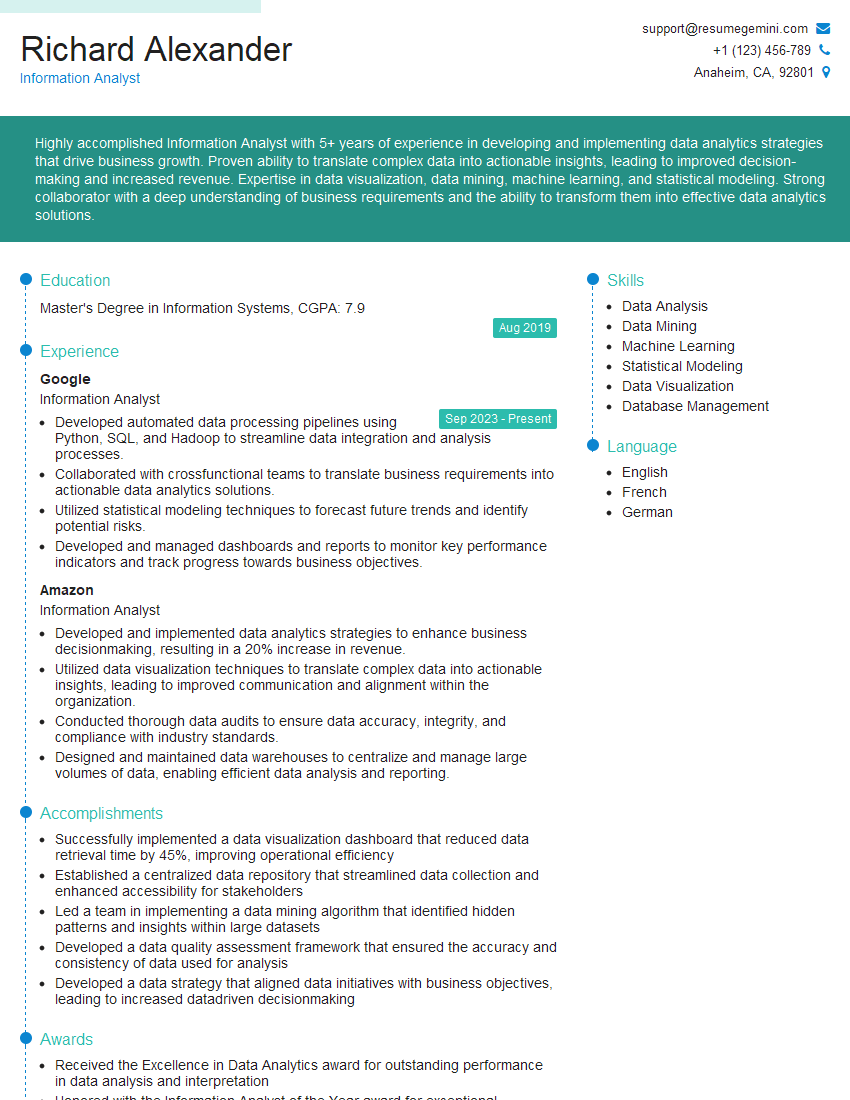
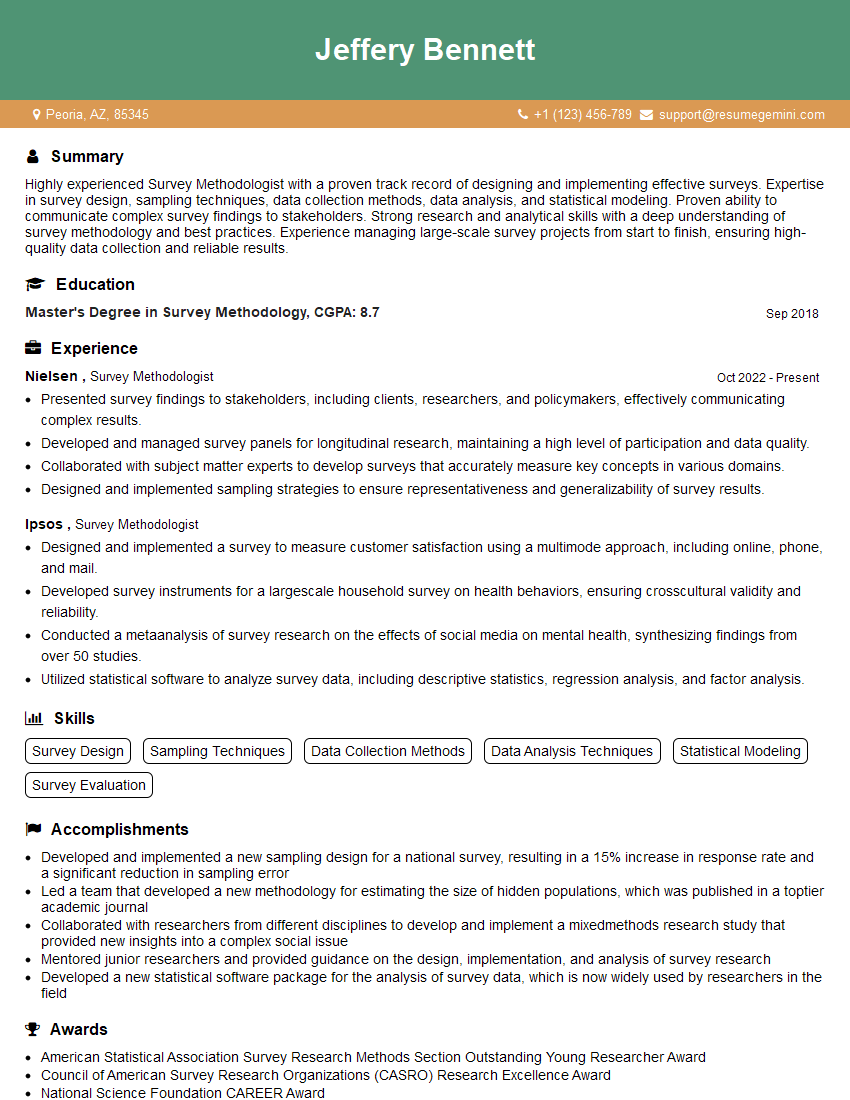
Mastering data collection techniques – both qualitative and quantitative – is essential for a successful career in research, analysis, and many other data-driven fields. It opens doors to diverse and rewarding opportunities. To maximize your job prospects, focus on creating an ATS-friendly resume that highlights your skills and experience effectively. ResumeGemini is a trusted resource for building professional resumes, and we offer examples of resumes tailored to Data Collection (qualitative and quantitative) roles to help you get started. Investing time in crafting a strong resume is a critical step in securing your dream job.
Explore more articles
Users Rating of Our Blogs
Share Your Experience
We value your feedback! Please rate our content and share your thoughts (optional).
