Feeling uncertain about what to expect in your upcoming interview? We’ve got you covered! This blog highlights the most important Measurement Precision interview questions and provides actionable advice to help you stand out as the ideal candidate. Let’s pave the way for your success.
Questions Asked in Measurement Precision Interview
Q 1. Explain the difference between accuracy and precision in measurement.
Accuracy and precision are two crucial aspects of measurement, often confused but distinct. Accuracy refers to how close a measurement is to the true or accepted value. Think of it like hitting the bullseye on a dartboard. Precision, on the other hand, refers to how close repeated measurements are to each other. This is like consistently hitting the same spot on the dartboard, even if that spot is far from the bullseye. A measurement can be precise but not accurate (repeatedly hitting the same spot off-center), accurate but not precise (hitting near the bullseye inconsistently), both accurate and precise (consistently hitting the bullseye), or neither (scattered shots).
Example: Imagine measuring the length of a table. The true length is 1 meter. If your measurements are 1.01m, 1.02m, and 1.00m, you have high precision (measurements are close together), but the accuracy is also good as they are all close to the true value. If your measurements were 0.9m, 0.91m, and 0.89m, you have high precision but low accuracy. Conversely, measurements of 1.1m, 0.9m, and 1.0m show low precision but a relatively acceptable accuracy.
Q 2. Describe various sources of measurement uncertainty and how to minimize them.
Measurement uncertainty arises from various sources. These can be broadly categorized as:
- Random errors: These are unpredictable variations in measurements, often due to environmental factors (temperature fluctuations, vibrations) or limitations of the instrument itself. They can be minimized through repeated measurements and statistical analysis (e.g., calculating the average and standard deviation).
- Systematic errors: These are consistent biases that affect all measurements in the same way. They may stem from instrument calibration errors, operator biases, or flaws in the measurement method. Minimizing systematic errors requires careful calibration of instruments, standardized procedures, and proper instrument handling.
- Environmental factors: Temperature, humidity, pressure, and electromagnetic fields can all influence measurements. Controlling or compensating for these factors is crucial. For example, using a temperature-controlled environment or employing temperature compensation techniques.
- Observer errors: Parallax error (incorrect reading due to viewing angle), misinterpretation of scales, or incorrect recording of data can all lead to errors. Clear instructions, proper training, and using digital instruments can help reduce these errors.
Minimizing uncertainty involves a combination of techniques: using high-quality instruments, employing proper measurement techniques, carefully controlling the environment, calibrating instruments regularly, using statistical methods to analyze data, and documenting all procedures meticulously.
Q 3. What are the different types of calibration methods?
Calibration methods aim to compare a measurement instrument’s readings to a known standard. Common methods include:
- Direct comparison: The instrument is directly compared to a known standard using a comparator. This is often used for calibrating weights and other standards.
- Substitution method: The instrument’s reading is compared to the standard by substituting them in a measuring system.
- Indirect comparison: The instrument is calibrated using a known intermediary standard. This is common when a direct comparison isn’t feasible.
- Functional calibration: The instrument is calibrated by measuring a known physical property. For example, calibrating a thermometer using the melting point of ice or boiling point of water.
The choice of method depends on the type of instrument and the required accuracy level. Calibration certificates should detail the method used and its associated uncertainty.
Q 4. Explain the concept of traceability in measurement.
Traceability in measurement ensures that the results of a measurement can be linked to internationally recognized standards through an unbroken chain of comparisons. This chain establishes the reliability and comparability of measurements across different laboratories and organizations. Essentially, traceability provides confidence that your measurement is consistent with a globally accepted standard. This is crucial in various fields, particularly those with stringent quality control requirements.
Example: A laboratory measuring the concentration of a chemical substance needs to trace its calibration back to national standards maintained by national metrology institutes. These institutes, in turn, base their standards on international standards, ensuring consistency globally.
Q 5. How do you select appropriate measurement instruments for a specific application?
Selecting the right measurement instrument involves considering several factors:
- Required accuracy and precision: The instrument’s specifications must meet the needed accuracy and precision for the application. A high-precision application might need an instrument with a smaller measurement uncertainty.
- Measurement range: The instrument’s range should encompass the expected values. An instrument with a limited range might not be able to capture the full range of values.
- Resolution: The instrument’s resolution (the smallest increment it can measure) must be fine enough to provide the needed level of detail.
- Environmental conditions: The instrument must be suitable for the environmental conditions of the measurement site.
- Cost and availability: The instrument should be cost-effective and readily available.
- Ease of use and maintenance: User-friendliness and ease of maintenance are important considerations.
Example: Measuring the diameter of a fine wire requires a high-resolution micrometer, while measuring the length of a room only requires a standard measuring tape.
Q 6. What are the key characteristics of a good measurement standard?
A good measurement standard must possess several key characteristics:
- High accuracy and stability: The standard must maintain its value over time and have a minimal uncertainty.
- Traceability: The standard must be traceable to a higher-order national or international standard.
- Robustness and durability: The standard should be resistant to damage and environmental influences.
- Ease of use and handling: The standard should be easy to handle and use in measurement procedures.
- Well-documented specifications: The standard’s properties and associated uncertainties should be clearly documented.
These characteristics ensure the reliability and comparability of measurements performed using that standard.
Q 7. Describe your experience with different types of measurement sensors.
Throughout my career, I’ve worked extensively with various measurement sensors, including:
- Strain gauges: Used for measuring strain or deformation in materials, finding applications in structural health monitoring and load cells.
- Thermocouples: Employing the Seebeck effect, thermocouples accurately measure temperatures across a wide range.
- Accelerometers: Used for measuring acceleration and vibration, crucial in seismic monitoring, automotive applications, and motion control.
- Pressure sensors: Essential in numerous applications ranging from weather monitoring (barometric pressure) to industrial process control.
- Optical sensors: Such as photodiodes and phototransistors, these are widely used in light detection and measurement, including spectroscopy and optical fiber communication.
- Ultrasonic sensors: These sensors use ultrasonic waves for distance measurement, object detection, and flow measurement, common in automotive parking assistance systems and industrial automation.
My experience spans the selection, calibration, data acquisition, and analysis of data from these sensors. I am proficient in understanding their limitations and selecting appropriate sensors for specific measurement tasks. I’ve often had to troubleshoot issues related to sensor noise, drift, and calibration.
Q 8. How do you handle outliers in measurement data?
Handling outliers in measurement data requires a careful approach, as they can significantly skew results and lead to inaccurate conclusions. Outliers are data points that fall significantly outside the expected range of values. Identifying and addressing them is crucial for maintaining data integrity.
My strategy typically involves a multi-step process:
- Detection: I use visual methods like box plots and scatter plots to initially identify potential outliers. Statistical methods, such as the Z-score or Interquartile Range (IQR) method, are also employed to quantify the degree of deviation from the expected range. A Z-score above 3 or below -3, for instance, is often considered a strong indicator of an outlier.
- Investigation: Once identified, I investigate the potential causes of the outlier. Was there an error in the measurement process? Was there a malfunction of the equipment? Was there an anomaly in the sample being measured? Understanding the root cause is critical.
- Resolution: The method of dealing with outliers depends on the cause. If the outlier is due to a clear error (e.g., a misreading or equipment malfunction), it’s usually appropriate to remove or correct the data point. However, if the cause is unclear, I might transform the data (e.g., using logarithmic transformation) or use robust statistical methods less sensitive to outliers (e.g., median instead of mean).
Example: In a quality control setting, we measured the diameter of hundreds of manufactured parts. A few parts showed diameters far exceeding the expected range. Investigation revealed a tooling problem causing these outliers, which was then rectified. Simply removing the data without addressing the root cause would have masked a serious manufacturing defect.
Q 9. Explain your understanding of statistical process control (SPC) in measurement.
Statistical Process Control (SPC) is a collection of statistical methods used to monitor and control a process to ensure it operates within predetermined limits. In measurement, SPC helps to identify and prevent variations that could lead to inaccurate or unreliable results. It’s like having a ‘check engine’ light for your measurement process.
Key elements of SPC in measurement include:
- Control Charts: These graphical tools, such as X-bar and R charts (for average and range), are used to plot measurement data over time. They help visualize trends, detect shifts in the process mean or variation, and identify points outside control limits (indicating potential problems).
- Control Limits: These are statistically determined boundaries indicating the expected range of variation for a process. Data points falling outside these limits signal a potential problem requiring investigation.
- Process Capability Analysis: This assesses whether a process is capable of meeting specified tolerances or requirements. Metrics like Cp and Cpk are used to quantify the process’s capability.
Example: Imagine a lab measuring the concentration of a chemical solution. Using an X-bar and R chart, we monitor the average concentration and its variability over a series of measurements. If a point falls outside the control limits, we investigate potential sources of variation – maybe a faulty instrument, a change in the environment, or an error in the procedure.
Q 10. How do you assess the validity of measurement results?
Assessing the validity of measurement results involves ensuring they are accurate, precise, and reliable. It’s not just about getting a number; it’s about trusting that number.
My approach considers these aspects:
- Accuracy: How close the measured value is to the true value. This is often determined by comparing measurements to a known standard or reference. Calibration and traceability are crucial.
- Precision: How close repeated measurements of the same quantity are to each other. High precision indicates low variability in the measurement process. Repeatability and reproducibility studies are useful here.
- Reliability: The consistency of measurements over time and under different conditions. This involves considering factors like instrument drift, environmental effects, and operator influence.
- Traceability: This ensures that measurements can be linked back to national or international standards, establishing a chain of comparability and providing confidence in the results.
Example: A weight scale used in a pharmaceutical company needs to be regularly calibrated to a known standard mass to ensure accuracy and traceability. If the scale’s readings are consistently off, the measured weights of medications will be inaccurate and potentially dangerous.
Q 11. What are the common methods for error analysis in measurement systems?
Error analysis in measurement systems is crucial for understanding and minimizing uncertainties. It’s about identifying the sources of error and quantifying their impact on the overall measurement uncertainty.
Common methods include:
- Bias Analysis: Identifies systematic errors, or biases, that consistently shift the measurements away from the true value. This often involves comparing measurements to a known standard.
- Precision Analysis: Evaluates random errors, which cause variability in the measurements. This typically involves repeated measurements and analysis of the standard deviation or variance.
- Gauge R&R (Repeatability and Reproducibility) studies: These assess the variability introduced by the measurement instrument and the operator. It helps determine how much of the total variation is due to the measurement system itself versus the actual variation in the measured quantity.
- Uncertainty Analysis: Combines all identified sources of error (bias and precision) to calculate the overall uncertainty associated with a measurement. This provides a quantitative estimate of the range within which the true value likely lies.
Example: In a manufacturing process, a gauge R&R study might be conducted to determine the contribution of the measurement instrument and operators to the variability in measuring the dimensions of a component. This helps identify if the measurement system itself is contributing significant error, requiring improvement.
Q 12. Describe your experience with data acquisition and analysis software.
My experience with data acquisition and analysis software spans numerous platforms and applications. I’m proficient in using software like LabVIEW, MATLAB, and specialized data acquisition systems commonly found in industrial settings. I’m also comfortable working with statistical software packages such as Minitab and R.
My skills extend beyond simply collecting data; I can efficiently process, analyze, and visualize data to extract meaningful insights. This includes performing statistical analysis, generating reports, and creating custom visualizations to communicate findings effectively. I have experience with various data formats and am adept at troubleshooting issues related to data acquisition and analysis.
Example: In a previous role, I used LabVIEW to automate the data acquisition process from several sensors monitoring a complex manufacturing process. I then used MATLAB to analyze the data, identifying correlations between different sensor readings and optimizing process parameters for improved efficiency.
Q 13. How do you ensure the proper maintenance and calibration of measurement equipment?
Ensuring proper maintenance and calibration of measurement equipment is paramount for obtaining accurate and reliable results. It’s like regularly servicing your car to ensure it runs smoothly and safely.
My approach involves:
- Regular Calibration: Adhering to a rigorous calibration schedule based on the instrument’s specifications and the criticality of the measurements. Calibration involves comparing the instrument’s readings to a traceable standard and making adjustments as necessary.
- Preventive Maintenance: Performing routine checks and cleaning to maintain the instrument’s performance. This might involve checking for wear and tear, cleaning optical components, or lubricating mechanical parts.
- Documentation: Meticulously recording calibration results, maintenance activities, and any observed anomalies. This ensures traceability and aids in troubleshooting.
- Training: Ensuring that operators are properly trained on the safe and correct use of the equipment.
Example: In a quality control lab, we maintain a detailed calibration log for all instruments, including balances, thermometers, and spectrometers. We adhere to a strict calibration schedule, ensuring that instruments are calibrated at specified intervals or before critical measurements.
Q 14. Explain your understanding of tolerance and its importance in measurement.
Tolerance, in the context of measurement, refers to the permissible variation in a dimension or characteristic. It defines an acceptable range within which a measured value must fall to be considered compliant. Think of it as the margin of error that’s still acceptable.
The importance of tolerance stems from the fact that perfect precision is rarely achievable. Tolerances provide a practical way to balance the cost and effort of achieving higher precision with the functional requirements of a product or process. Tight tolerances demand higher precision and may increase costs, while loose tolerances allow more variation but might compromise performance or quality.
Example: A manufactured bolt might have a specified diameter of 10mm with a tolerance of ±0.1mm. This means that bolts with diameters between 9.9mm and 10.1mm are considered acceptable. If a bolt falls outside this range, it’s considered defective.
Q 15. What are the different types of measurement errors?
Measurement errors are deviations from the true value of a measured quantity. They can be broadly categorized into two main types: random errors and systematic errors.
- Random errors are unpredictable variations that occur due to uncontrollable factors. Think of them as the slight inconsistencies you get when repeatedly measuring the same thing with a ruler – your eyes might drift slightly each time, leading to small differences. These errors follow a statistical distribution, often a normal (Gaussian) distribution, and their effects can be minimized by averaging multiple measurements.
- Systematic errors, on the other hand, are consistent and repeatable deviations in one direction. These errors are caused by flaws in the measurement system itself, such as a miscalibrated instrument or a flawed measurement technique. For example, a consistently biased thermometer that reads 1°C higher than the true temperature always introduces a systematic error. Unlike random errors, averaging multiple readings won’t reduce systematic errors.
- Gross errors are mistakes made during measurement like reading a scale incorrectly or recording the data wrong. These errors should be identified and corrected by careful observation and record keeping. They are not usually considered within the scope of analyzing precision and accuracy, but detecting and correcting them is crucial.
Understanding the difference between these error types is vital for designing robust measurement systems and interpreting results accurately. Identifying and mitigating both random and systematic errors are critical for achieving measurement precision.
Career Expert Tips:
- Ace those interviews! Prepare effectively by reviewing the Top 50 Most Common Interview Questions on ResumeGemini.
- Navigate your job search with confidence! Explore a wide range of Career Tips on ResumeGemini. Learn about common challenges and recommendations to overcome them.
- Craft the perfect resume! Master the Art of Resume Writing with ResumeGemini’s guide. Showcase your unique qualifications and achievements effectively.
- Don’t miss out on holiday savings! Build your dream resume with ResumeGemini’s ATS optimized templates.
Q 16. How do you interpret measurement uncertainty reports?
Interpreting measurement uncertainty reports requires understanding that they quantify the range within which the true value of a measurement likely lies. These reports usually include a value, often expressed as a mean or average, plus or minus a stated uncertainty. This uncertainty accounts for both random and systematic errors. For example, a report might state: “The length of the component is 10.00 ± 0.05 cm (k=2)”.
Let’s break this down:
- 10.00 cm is the measured value (mean).
- ± 0.05 cm is the expanded uncertainty, meaning the true value is likely to be between 9.95 cm and 10.05 cm.
- k=2 indicates the coverage factor. This relates the expanded uncertainty to the standard uncertainty (a statistical measure of the dispersion of the measurements). A coverage factor of 2 means there’s a approximately 95% confidence that the true value falls within the stated range.
The higher the uncertainty, the lower the confidence in the reported value’s accuracy. When interpreting these reports, it’s crucial to consider the magnitude of uncertainty relative to the measured value. A ±0.05 cm uncertainty on a 10.00 cm measurement is quite good, whereas the same uncertainty on a 1.00 cm measurement would be much larger and more significant.
Q 17. Explain your experience with different types of measurement scales (e.g., nominal, ordinal, interval, ratio).
My experience encompasses working with all four levels of measurement scales: nominal, ordinal, interval, and ratio. Each possesses unique properties and limitations.
- Nominal scales simply categorize data; examples include colors (red, blue, green) or gender (male, female). These scales don’t provide any sense of order or magnitude.
- Ordinal scales categorize data and indicate order but not the magnitude of the difference between categories. Example: customer satisfaction levels (very satisfied, satisfied, neutral, dissatisfied, very dissatisfied). We know ‘very satisfied’ is better than ‘satisfied’, but we don’t know *how much* better.
- Interval scales indicate order and the magnitude of difference between values, but lack a true zero point. The classic example is the Celsius temperature scale: the difference between 20°C and 30°C is the same as the difference between 30°C and 40°C, but 0°C doesn’t represent the absence of temperature.
- Ratio scales have all the properties of interval scales, and crucially, possess a true zero point, representing the absence of the measured quantity. Weight, length, and time are all ratio scales – 0 kg means no weight, 0 m means no length, 0 s means no time. Ratio scales allow for meaningful ratios (e.g., one object weighs twice as much as another).
Choosing the appropriate measurement scale is essential for analysis. Inaccurate data analysis can easily occur if you treat nominal data as interval data, for instance.
Q 18. Describe a situation where you had to troubleshoot a measurement system.
In a previous role, we were experiencing inconsistent readings from a newly installed automated weighing system used for packaging pharmaceuticals. Initial investigations revealed that the variability wasn’t related to the product itself but to the system’s performance.
My troubleshooting approach involved a structured process:
- Data Collection: We gathered data from multiple runs, carefully documenting the conditions (temperature, humidity, etc.) for each measurement.
- Analysis: We plotted the data to visually identify trends and patterns. We found that the variability increased significantly when the system reached its maximum capacity.
- Hypothesis Generation: This led us to hypothesize that the system’s load cell (the sensor that measures weight) might be saturating at its upper limit, causing inaccurate readings.
- Verification: We tested this hypothesis by loading the system with weights close to its maximum capacity and observed the readings. Our findings confirmed the hypothesis – the system was indeed not performing reliably at higher weights.
- Solution Implementation: We explored various options including adjusting the system’s capacity settings, using a different load cell with a higher capacity, and improving calibration procedures. We opted for a new, higher-capacity load cell, ensuring thorough recalibration and retesting of the weighing system after implementation. The new system showed improved accuracy and repeatability.
This example demonstrates the importance of a systematic approach to troubleshooting measurement systems, emphasizing the use of data analysis and hypothesis testing to identify and resolve underlying problems.
Q 19. How do you ensure the accuracy of measurements in a production environment?
Ensuring measurement accuracy in a production environment requires a multi-faceted approach. It’s not a one-time event but an ongoing process.
- Regular Calibration and Verification: All measurement instruments must be calibrated against traceable standards at regular intervals, following established procedures. This ensures that the instruments are consistently providing accurate readings. The frequency of calibration depends on the criticality of the measurements and the instrument’s stability.
- Preventive Maintenance: Regular maintenance helps prevent issues before they impact accuracy. This includes cleaning equipment, inspecting for wear and tear, and lubricating moving parts as needed.
- Control Charts and Statistical Process Control (SPC): Implementing SPC techniques allows for continuous monitoring of measurement data and helps detect deviations from expected values, identifying potential problems early.
- Operator Training: Proper training is essential to ensure that operators use measurement equipment correctly and record data accurately. Training should cover proper handling, calibration procedures, and understanding of potential sources of error.
- Environmental Control: In many cases, environmental factors (temperature, humidity, vibrations) can impact measurement accuracy. Controlling these factors, where feasible, is vital for consistent results.
- Measurement System Analysis (MSA): Periodic MSA studies are crucial to evaluating the capability of the measurement system and identifying potential sources of error. MSA will assist in determining whether the measurement system is capable of meeting the requirements.
By implementing these procedures, businesses can maintain a high level of confidence in the accuracy and reliability of their measurements.
Q 20. What are some common challenges you face in maintaining measurement precision?
Maintaining measurement precision presents several challenges:
- Instrument Drift: Over time, even well-maintained instruments can experience drift, gradually deviating from their calibrated values. Regular calibration is crucial to mitigate this.
- Environmental Factors: Changes in temperature, humidity, or pressure can significantly impact measurement results. Controlling the environment or using appropriate compensation techniques is important.
- Operator Variability: Differences in how operators use instruments can introduce variations in measurements. Standardized procedures and proper training are necessary to minimize this.
- Wear and Tear: Equipment wears out over time, affecting its accuracy. Regular maintenance, including preventative maintenance and timely repairs, is vital.
- Cost of Calibration and Maintenance: Maintaining high precision often comes at a cost. Balancing accuracy requirements with budgetary constraints can be challenging.
Overcoming these challenges requires proactive management, careful planning, and a commitment to ongoing improvement. Effective strategies include implementing regular calibration and maintenance schedules, comprehensive operator training programs, and regular reviews of measurement processes.
Q 21. Explain your understanding of measurement system analysis (MSA).
Measurement System Analysis (MSA) is a collection of statistical techniques used to evaluate the capability of a measurement system to meet the requirements of a particular application. It’s crucial for ensuring that the measurements being taken are accurate and reliable enough to support decisions based on them.
A typical MSA study will assess various aspects of a measurement system, including:
- Accuracy: How close the measurements are to the true value.
- Precision: The consistency or repeatability of measurements.
- Bias: The systematic difference between the measurement system’s average reading and the true value.
- Linearity: Whether the measurement system’s response is linear across its range.
- Stability: How consistent the measurement system’s readings are over time.
- Repeatability and Reproducibility (R&R): Repeatability assesses the variation in measurements taken by the same operator using the same instrument, while reproducibility assesses the variation in measurements taken by different operators using the same instrument. R&R studies help quantify the proportion of variation attributed to the measurement system versus the actual variability of the product or process being measured.
MSA studies utilize various statistical methods, such as Gage R&R studies and analysis of variance (ANOVA), to quantify these aspects of measurement system performance. The results of an MSA provide valuable insights for making decisions about whether the measurement system is adequate for its intended purpose and whether adjustments or improvements are needed. A poorly performing measurement system will result in unreliable data, potentially leading to poor decisions in manufacturing or other settings.
Q 22. How do you manage and reduce measurement variability?
Managing and reducing measurement variability is crucial for ensuring data reliability. It involves understanding the sources of variation and implementing strategies to minimize their impact. Think of it like baking a cake – if you don’t measure ingredients precisely, each cake will turn out slightly differently. In measurement, this ‘difference’ is variability.
- Identifying Sources of Variation: This is the first step. We use tools like control charts (e.g., Shewhart charts, CUSUM charts) to visually identify patterns and trends in measurement data, indicating potential sources of error. For example, a control chart might reveal that measurements are consistently higher during the morning shift, suggesting a tool calibration issue or operator fatigue.
- Improving Measurement Techniques: This might include using more precise instruments, standardizing measurement procedures (creating detailed SOPs – Standard Operating Procedures), and ensuring proper training for personnel. For instance, switching from a ruler to a digital caliper can significantly improve precision in length measurements. Proper training ensures consistent application of the measurement technique.
- Environmental Control: Environmental factors such as temperature, humidity, and vibration can all affect measurements. Controlling these factors through climate-controlled environments or vibration isolation platforms can significantly reduce variability. Imagine measuring the length of a metal bar – changes in temperature will cause its length to fluctuate slightly.
- Statistical Process Control (SPC): Implementing SPC methods helps monitor processes and identify when variability exceeds acceptable limits. This allows for proactive intervention and prevents the production of defective products or inaccurate data. Control charts are a key element of SPC, allowing for continuous monitoring and timely corrections.
By systematically addressing these aspects, we can significantly reduce measurement variability and ensure data quality.
Q 23. Describe your experience with different calibration standards and their applications.
My experience encompasses a wide range of calibration standards, from simple weights and measures to complex metrological instruments. The choice of standard depends heavily on the specific measurement application and the required level of accuracy.
- National Standards: These are the most accurate standards, typically maintained by national metrology institutes. They form the basis for all other calibration standards. For example, national standards are used to calibrate the mass standards that are then used in laboratories to calibrate weights.
- Traceable Standards: These standards are calibrated against national standards or other traceable standards, establishing a chain of traceability. This chain demonstrates that measurements are linked back to a known, reliable source, ensuring consistency and comparability.
- Working Standards: These standards are used in day-to-day calibration activities. They are calibrated periodically against traceable standards to maintain their accuracy. These are the standards that a technician in a manufacturing plant might use to calibrate a digital micrometer.
For example, in a pharmaceutical manufacturing setting, we might use traceable standards to calibrate balances used for weighing active pharmaceutical ingredients. The accuracy of this weighing is critical for dosage consistency and patient safety.
Calibration involves comparing a working standard to a higher-order standard to establish its accuracy and uncertainty. Regular calibration is crucial to maintaining the validity of measurements.
Q 24. What methods do you use to verify the integrity of measurement data?
Verifying the integrity of measurement data involves several critical steps to ensure its accuracy, reliability, and traceability.
- Data Validation: This involves checking for inconsistencies, outliers, and errors in the data. Statistical methods like outlier detection and range checks can identify potential issues. For instance, checking if a measurement falls outside a reasonable range based on historical data.
- Calibration Verification: Regularly verifying the calibration of the measuring instruments ensures that they remain within acceptable tolerances. Calibration certificates provide evidence of this verification and establish traceability to national standards.
- Instrument Maintenance Logs: Maintain detailed records of instrument maintenance activities, including cleaning, repairs, and adjustments. This information helps to identify potential sources of measurement errors and ensures compliance with regulatory requirements. For example, noting the date and details of a balance’s cleaning could help diagnose if a measurement was off due to accumulated residue.
- Audit Trails: Maintaining comprehensive audit trails of all measurement activities provides traceability and accountability. This information includes who performed the measurement, when it was performed, and the associated equipment. The goal is to ensure that a measurement can be entirely traced back to its source.
- Statistical Analysis: Applying statistical methods helps assess the overall quality of the measurement data, including precision, accuracy, and uncertainty. Techniques like ANOVA (Analysis of Variance) can help detect significant differences between measurements obtained under varying conditions.
Combining these techniques ensures the reliability and credibility of the measurement data.
Q 25. How do you communicate complex measurement data to non-technical audiences?
Communicating complex measurement data to non-technical audiences requires simplifying the information without sacrificing accuracy. It’s about translating technical jargon into clear, understandable language.
- Visualizations: Using charts, graphs, and other visuals helps to convey information quickly and effectively. For instance, a simple bar chart can show the comparison between different measurement results far easier than a table of numbers.
- Analogies and Metaphors: Relating the data to familiar concepts or everyday experiences helps the audience connect with the information more easily. For example, comparing measurement uncertainty to the margin of error in a survey.
- Storytelling: Presenting the data within a context or narrative makes it more engaging and memorable. Rather than just presenting numbers, explaining the problem the data solved or the insights it revealed makes it more relevant.
- Focus on Key Findings: Highlight the most important results and avoid overwhelming the audience with excessive detail. Prioritize presenting only the most relevant information, rather than every single detail.
- Interactive Tools: Using interactive dashboards or presentations can allow the audience to explore the data at their own pace.
For example, instead of saying “the coefficient of variation is 5%,” I would explain that “the measurements are typically within 5% of the average value, indicating reasonable consistency.”
Q 26. Describe your experience with Root Cause Analysis (RCA) related to measurement issues.
Root Cause Analysis (RCA) is essential when investigating measurement issues. It’s a systematic approach to identifying the underlying cause of a problem, rather than just addressing the symptoms.
My experience with RCA related to measurement problems typically involves applying techniques like the 5 Whys, fishbone diagrams (Ishikawa diagrams), and Fault Tree Analysis (FTA).
- 5 Whys: This involves repeatedly asking “why” to drill down to the root cause. For example, if measurements are consistently inaccurate, we might ask: Why are the measurements inaccurate? (Because the instrument wasn’t calibrated). Why wasn’t it calibrated? (Because the calibration schedule wasn’t followed). And so on.
- Fishbone Diagrams: These visually map out potential causes categorized into different areas like people, methods, materials, equipment, environment, and measurements. This aids in brainstorming potential root causes systematically.
- Fault Tree Analysis: This is a more formal, deductive approach that uses Boolean logic to identify combinations of events leading to a system failure (in this case, inaccurate measurements). This is particularly useful for complex systems.
For example, if we consistently observe high variability in a length measurement, RCA might reveal that the problem stems from operator error due to insufficient training, rather than a faulty instrument.
The goal of RCA is to prevent similar issues from occurring in the future by addressing the root cause and implementing corrective actions.
Q 27. How would you determine the appropriate sample size for a measurement study?
Determining the appropriate sample size for a measurement study is crucial for ensuring the reliability and validity of the results. A sample that is too small may not accurately represent the population, while a sample that is too large can be unnecessarily costly and time-consuming.
Several factors influence the required sample size, including:
- Desired Precision: How accurately do you need to estimate the population parameter? A higher precision requires a larger sample size.
- Confidence Level: How confident do you want to be that the estimate falls within a certain range? A higher confidence level (e.g., 99% vs. 95%) requires a larger sample size.
- Population Variability: A more variable population requires a larger sample size to achieve a given level of precision.
- Expected Effect Size: The magnitude of the effect you are trying to detect influences the required sample size. Larger effects can be detected with smaller sample sizes.
Sample size calculation methods often use statistical formulas or software packages. Power analysis is a common approach used to determine the appropriate sample size needed to detect a statistically significant effect.
For example, if we are measuring the diameter of a component and want to be 95% confident that our estimate is within ±0.1mm of the true population mean, we would use a power analysis to determine the necessary sample size. This would take into account factors such as the expected variation in diameters.
Ignoring proper sample size determination can lead to inaccurate conclusions and unreliable results.
Key Topics to Learn for Measurement Precision Interview
- Understanding Error and Uncertainty: Grasping the different types of errors (systematic, random), uncertainty propagation, and methods for minimizing error in measurements.
- Calibration and Traceability: Understanding calibration procedures, traceability to national standards, and the importance of maintaining accurate instruments.
- Statistical Analysis of Measurement Data: Applying statistical methods like mean, standard deviation, and regression analysis to interpret measurement data and identify outliers.
- Measurement Systems Analysis (MSA): Familiarizing yourself with Gage R&R studies, process capability analysis, and other MSA tools used to assess measurement system performance.
- Practical Applications: Consider how precision measurement impacts various industries (e.g., manufacturing, healthcare, research) and be prepared to discuss specific examples.
- Problem-Solving in Measurement: Practice identifying and troubleshooting issues related to measurement inaccuracies, data interpretation, and instrument malfunction.
- Specific Measurement Techniques: Explore techniques relevant to your target role, such as dimensional metrology, optical metrology, or other specialized methods.
- Data Acquisition and Analysis Software: Familiarity with commonly used software for data logging, analysis, and reporting is beneficial.
Next Steps
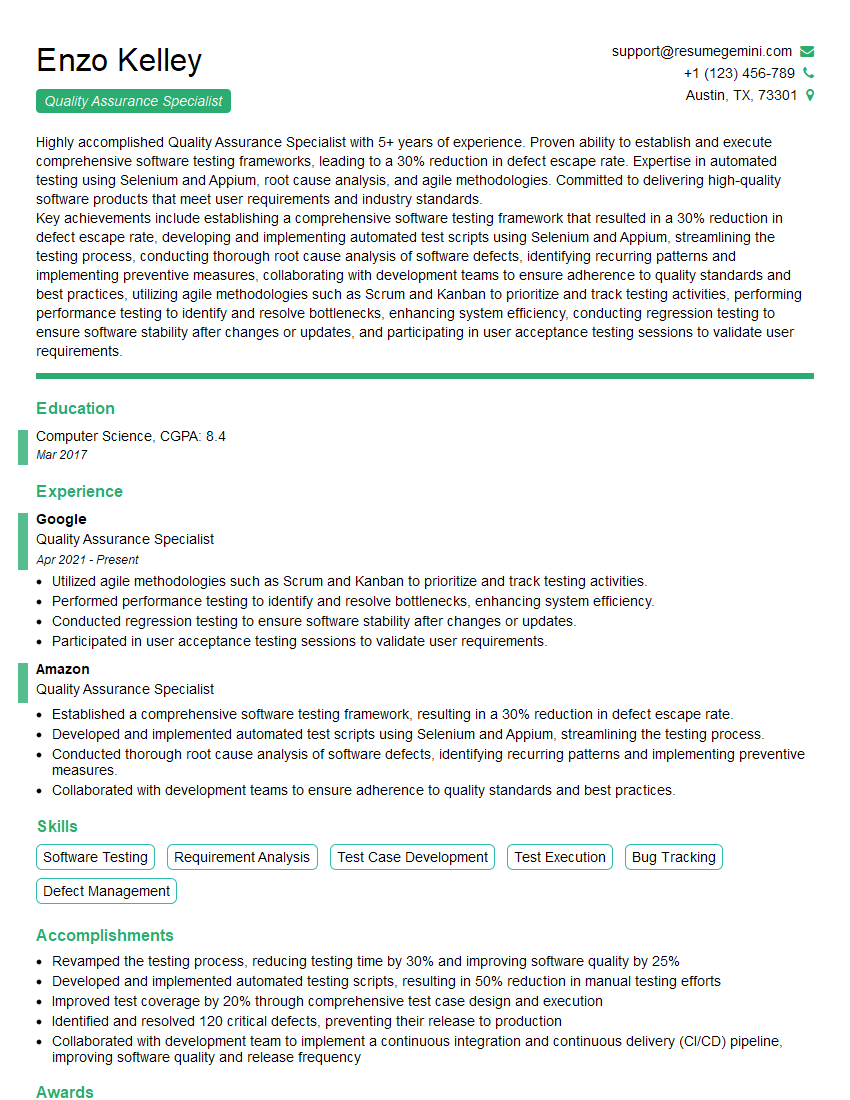
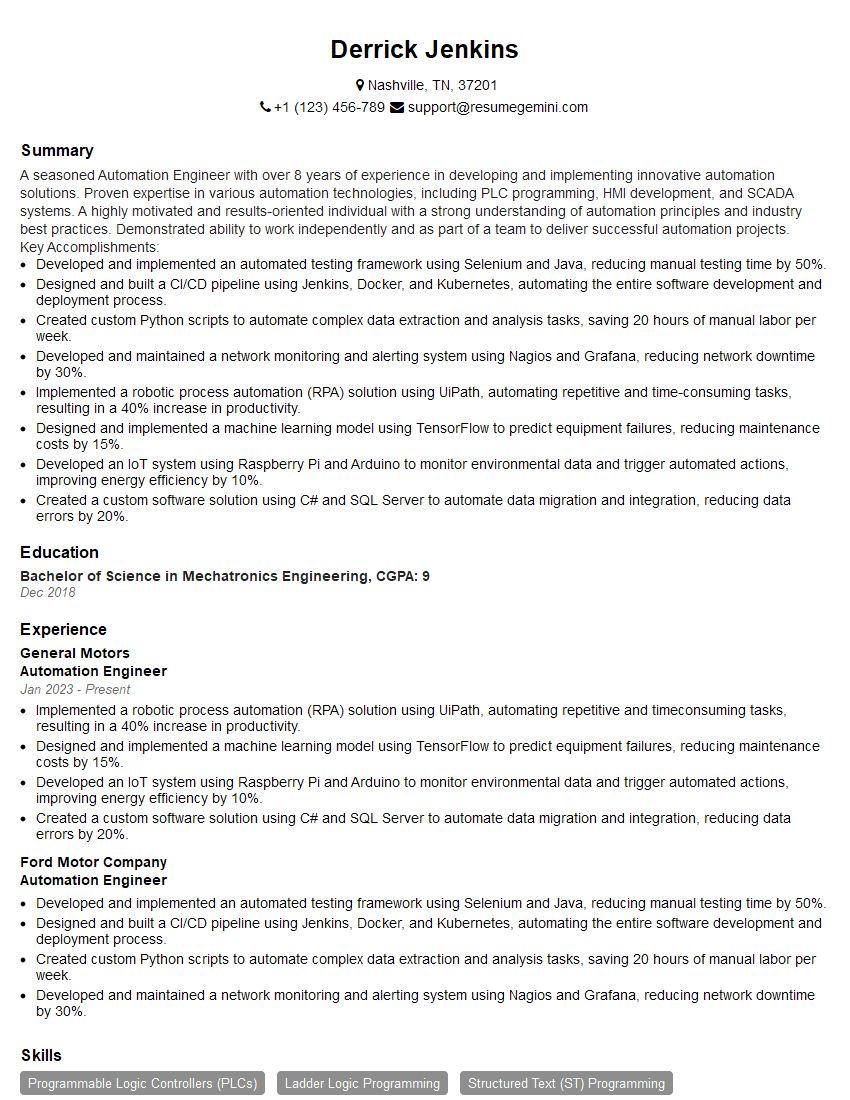
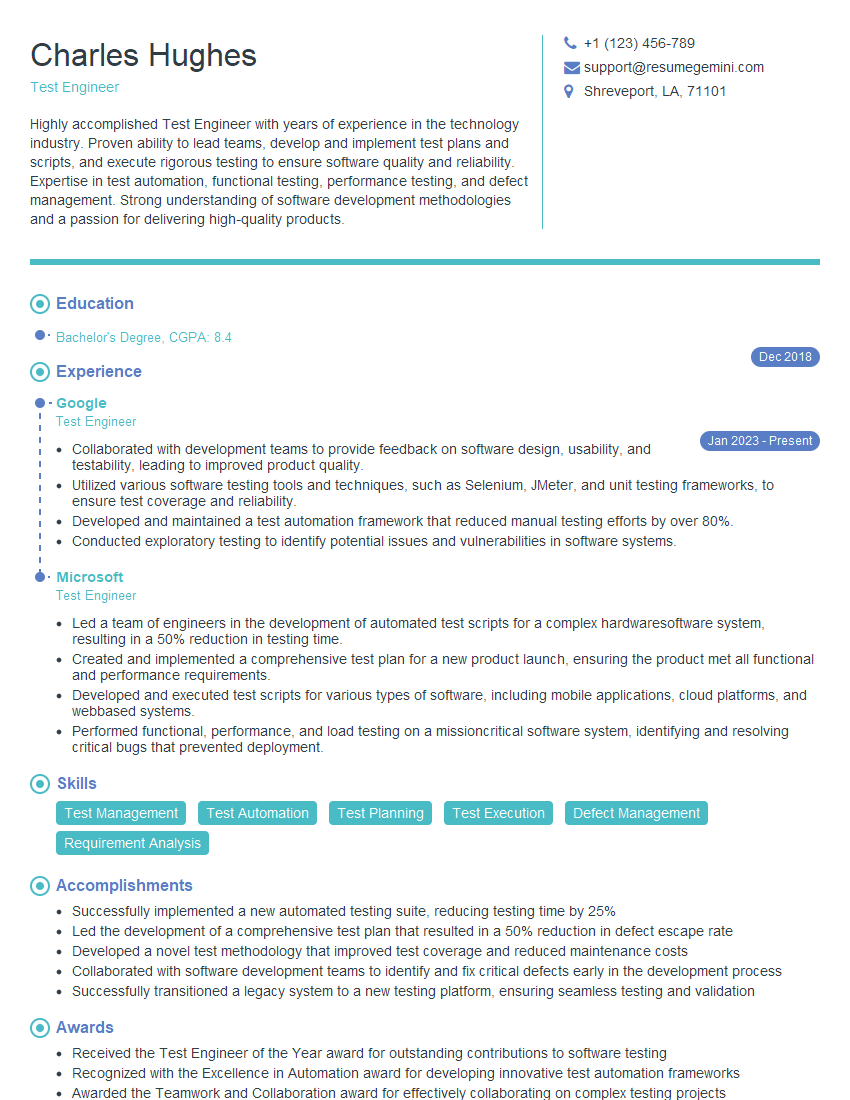
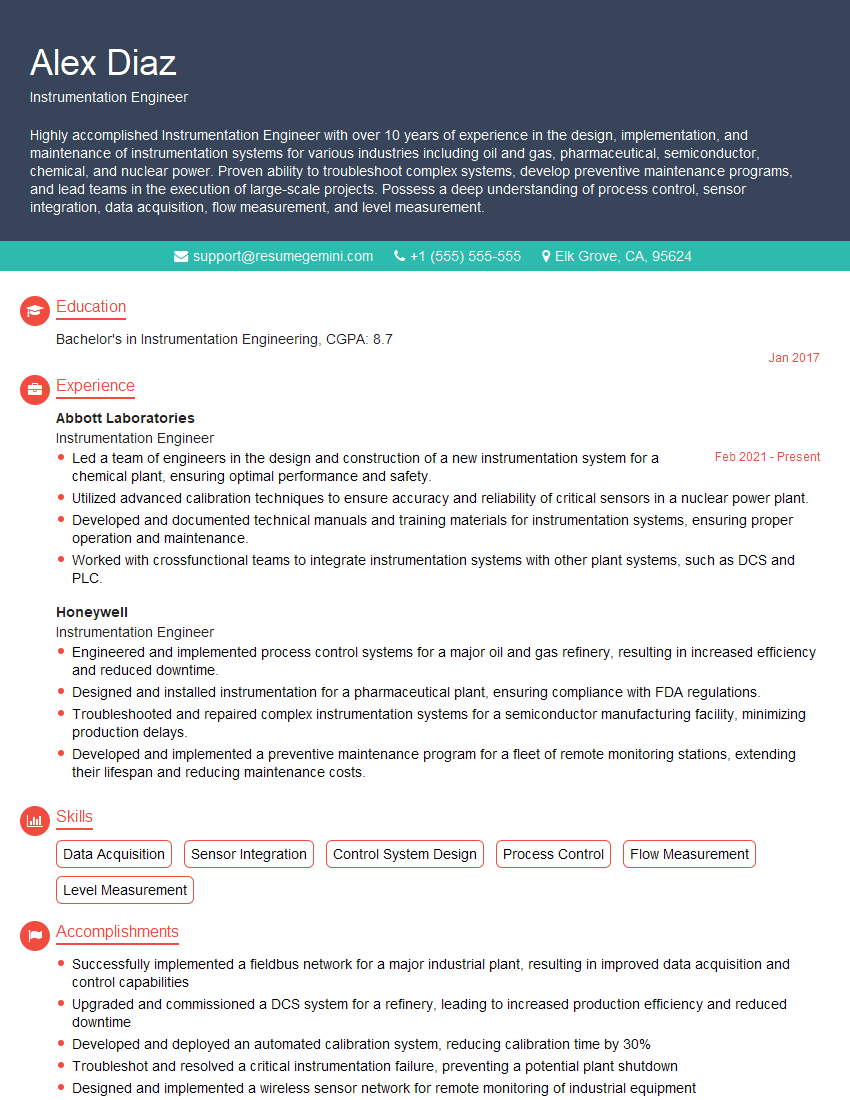
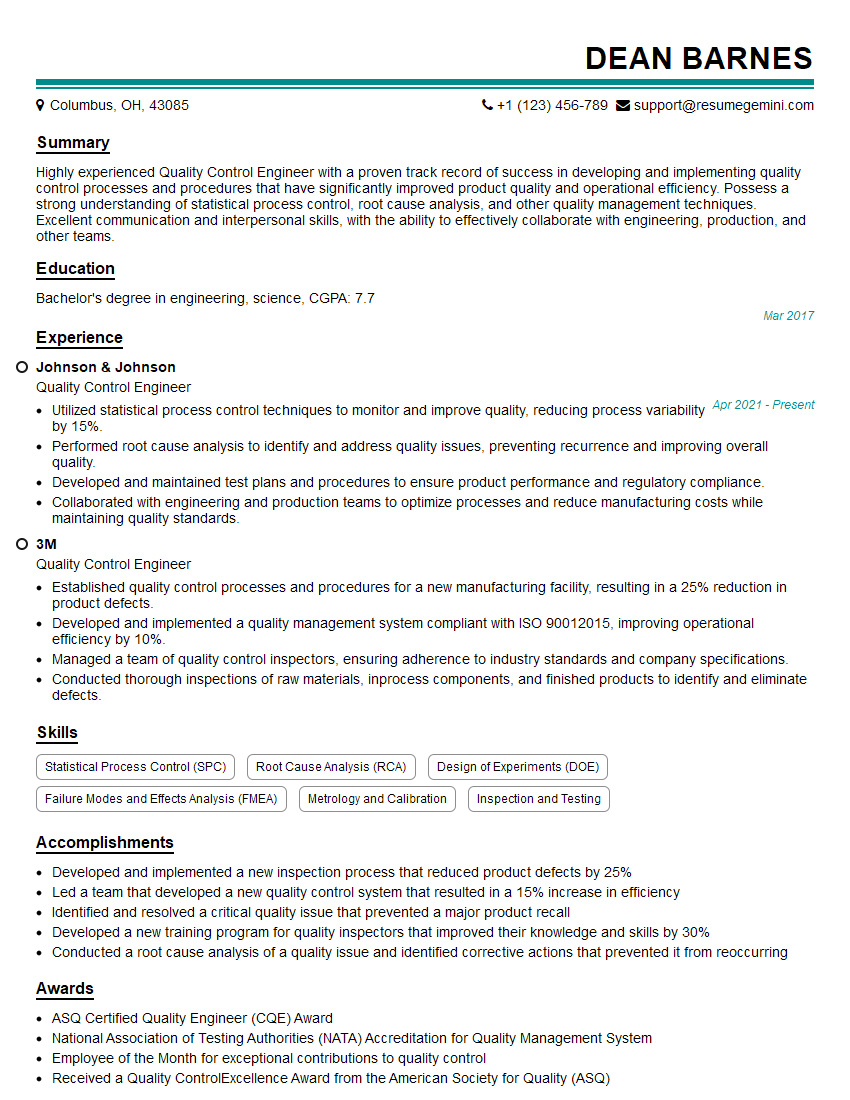
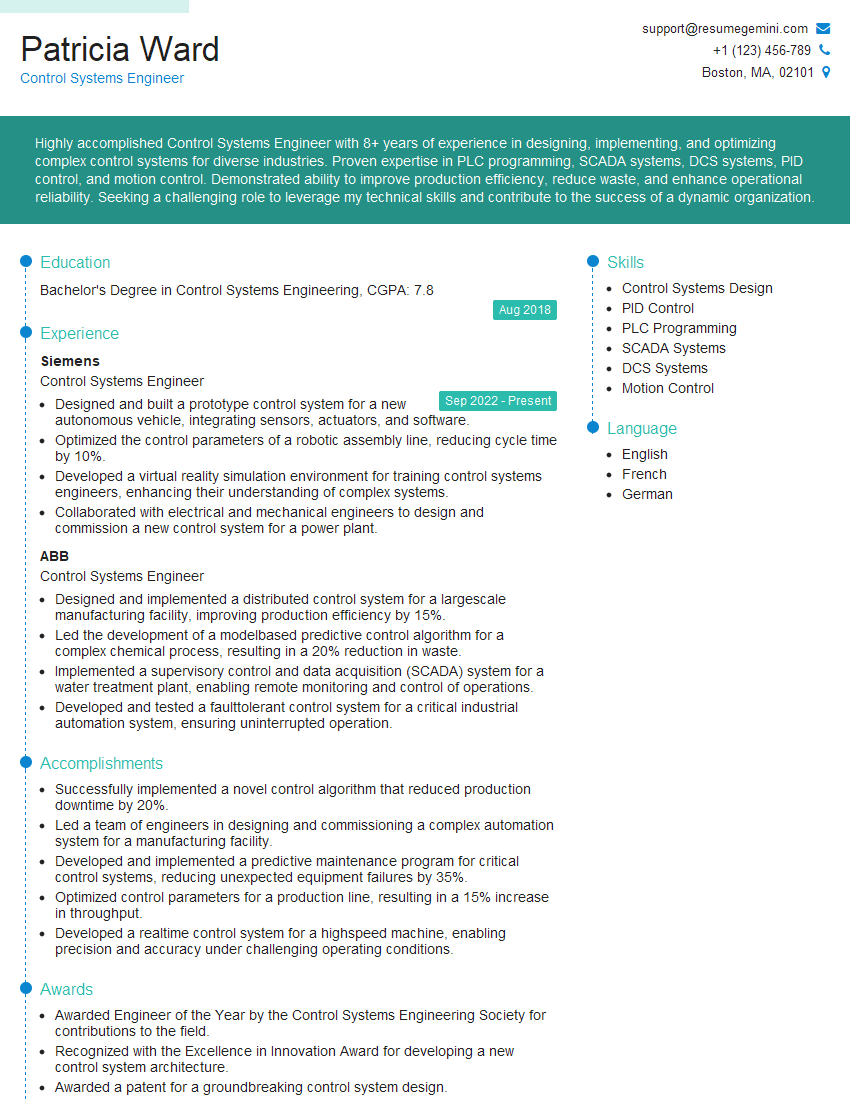
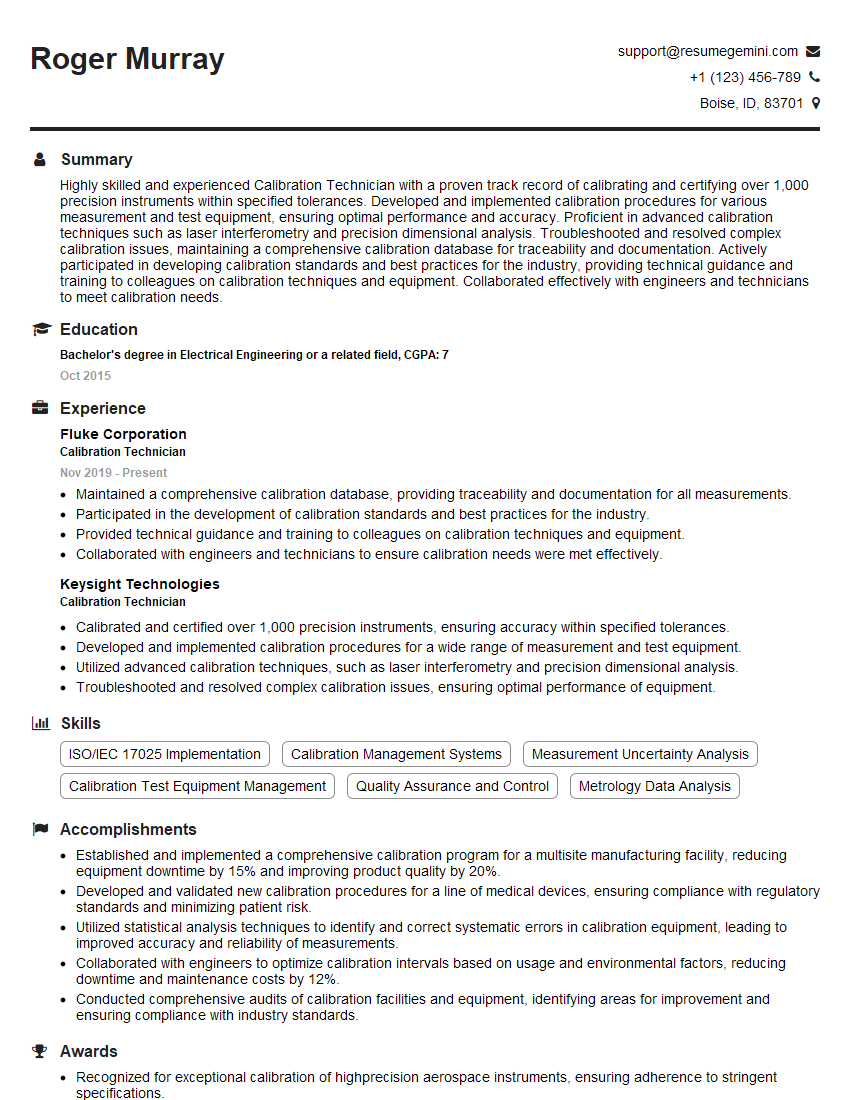
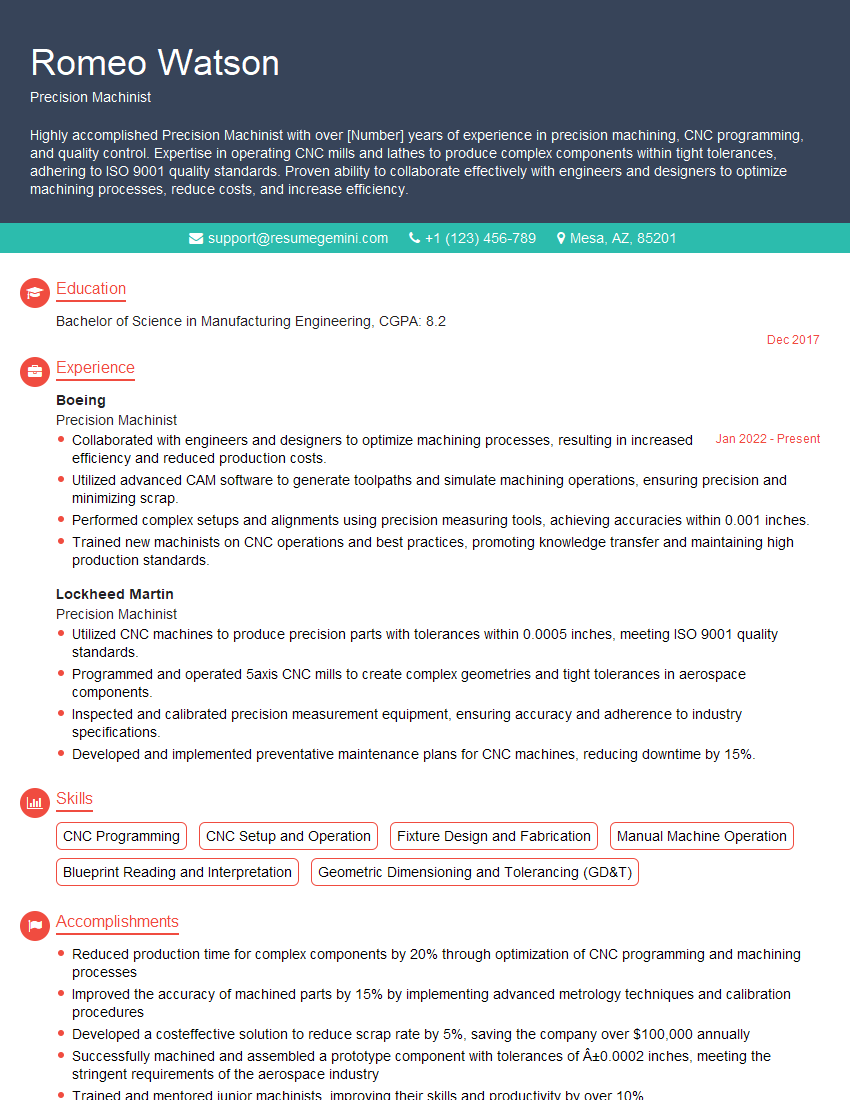
Mastering measurement precision is crucial for a successful career in many high-demand fields, opening doors to exciting opportunities and greater responsibility. A strong understanding of these principles demonstrates your analytical skills and attention to detail, highly valued attributes in today’s competitive job market. To maximize your job prospects, create an ATS-friendly resume that highlights your expertise. ResumeGemini is a trusted resource to help you build a professional and impactful resume. We provide examples of resumes tailored to Measurement Precision to guide you, ensuring your application stands out.
Explore more articles
Users Rating of Our Blogs
Share Your Experience
We value your feedback! Please rate our content and share your thoughts (optional).
What Readers Say About Our Blog
Hello,
We found issues with your domain’s email setup that may be sending your messages to spam or blocking them completely. InboxShield Mini shows you how to fix it in minutes — no tech skills required.
Scan your domain now for details: https://inboxshield-mini.com/
— Adam @ InboxShield Mini
Reply STOP to unsubscribe
Hi, are you owner of interviewgemini.com? What if I told you I could help you find extra time in your schedule, reconnect with leads you didn’t even realize you missed, and bring in more “I want to work with you” conversations, without increasing your ad spend or hiring a full-time employee?
All with a flexible, budget-friendly service that could easily pay for itself. Sounds good?
Would it be nice to jump on a quick 10-minute call so I can show you exactly how we make this work?
Best,
Hapei
Marketing Director
Hey, I know you’re the owner of interviewgemini.com. I’ll be quick.
Fundraising for your business is tough and time-consuming. We make it easier by guaranteeing two private investor meetings each month, for six months. No demos, no pitch events – just direct introductions to active investors matched to your startup.
If youR17;re raising, this could help you build real momentum. Want me to send more info?
Hi, I represent an SEO company that specialises in getting you AI citations and higher rankings on Google. I’d like to offer you a 100% free SEO audit for your website. Would you be interested?
Hi, I represent an SEO company that specialises in getting you AI citations and higher rankings on Google. I’d like to offer you a 100% free SEO audit for your website. Would you be interested?
good
