Interviews are opportunities to demonstrate your expertise, and this guide is here to help you shine. Explore the essential Advanced Research Techniques interview questions that employers frequently ask, paired with strategies for crafting responses that set you apart from the competition.
Questions Asked in Advanced Research Techniques Interview
Q 1. Explain your experience with various data analysis techniques.
My experience with data analysis techniques spans a wide range, encompassing both descriptive and inferential methods. Descriptive techniques, such as calculating means, medians, modes, and standard deviations, provide a summary of the data’s characteristics. I frequently use these to gain initial insights into datasets. For example, when analyzing customer demographics for a marketing campaign, I might calculate the average age and income to target specific groups.
Inferential methods allow me to draw conclusions about a population based on a sample. This includes techniques like regression analysis (linear, logistic, polynomial), where I can model the relationship between variables. For instance, I might use linear regression to predict sales based on advertising spend. I also have extensive experience with ANOVA (Analysis of Variance) to compare means across multiple groups and hypothesis testing using t-tests and chi-squared tests to assess statistical significance. Cluster analysis helps me group similar data points, which I’ve utilized for customer segmentation in market research projects. Finally, I frequently employ Principal Component Analysis (PCA) for dimensionality reduction, making complex datasets easier to manage and interpret.
Q 2. Describe your proficiency in statistical software packages (e.g., R, SPSS, SAS).
I’m proficient in several statistical software packages, most notably R and SPSS. R, with its extensive libraries like ggplot2 for visualization and dplyr for data manipulation, is my go-to for complex analyses and customizability. For example, I recently used R to perform a survival analysis on patient data using the survival package. SPSS is valuable for its user-friendly interface, particularly when working with larger datasets and conducting standard statistical tests. I frequently use SPSS for quick exploratory data analysis and generating reports for clients who may not be statistically savvy. I also possess working knowledge of SAS, particularly for its strengths in handling very large datasets and its applications in clinical trials analysis.
Q 3. How do you approach designing a research study?
Designing a research study is a methodical process that begins with a clear research question. This question must be specific, measurable, achievable, relevant, and time-bound (SMART). After defining the research question, I identify the appropriate research methodology (qualitative, quantitative, or mixed methods), considering the nature of the question and the type of data required. I then carefully define the population of interest and determine the sampling strategy to obtain a representative sample. The study design (e.g., experimental, observational, case-control) is crucial and depends on the research question and feasibility. A detailed data collection plan is also essential, including the methods for data collection (e.g., surveys, interviews, experiments) and the instruments to be used. Finally, a comprehensive data analysis plan outlines the statistical methods used to analyze the data and address the research question. Throughout the entire process, ethical considerations and potential biases are carefully addressed.
Q 4. What are the key steps involved in conducting a literature review?
Conducting a thorough literature review is paramount to any research project. I typically begin by identifying relevant keywords and search terms related to my research question. Then, I systematically search databases such as PubMed, Web of Science, and Google Scholar. I critically evaluate the quality and relevance of each study, focusing on the methodology, findings, and limitations. I use a range of tools to manage and organize the literature, such as citation management software (e.g., Zotero, Mendeley). A key part of this process involves synthesizing the findings of different studies to identify patterns, gaps in the literature, and potential areas for future research. I document the review process meticulously, ensuring transparency and reproducibility. The final literature review provides a solid foundation for my research, helping to contextualize my work and avoid repeating previous research.
Q 5. Explain your understanding of different research methodologies (e.g., qualitative, quantitative, mixed-methods).
Qualitative research explores complex social phenomena through in-depth understanding of experiences, perspectives, and meanings. It often involves methods like interviews and focus groups, leading to rich narrative data that is analyzed thematically. Quantitative research uses numerical data and statistical analysis to test hypotheses and establish relationships between variables. Examples include surveys and experiments. Mixed methods research combines both qualitative and quantitative approaches to gain a more comprehensive understanding of the research question. For example, I might conduct a quantitative survey to gather data on attitudes towards a new product, then conduct qualitative interviews to explore those attitudes in more depth. The choice of methodology depends on the research question and the type of insights needed.
Q 6. How do you handle missing data in your research?
Missing data is a common challenge in research. The best approach depends on the pattern of missing data (missing completely at random, missing at random, or missing not at random) and the extent of missingness. Simple methods include listwise deletion (removing cases with any missing data) which can lead to bias, especially with larger amounts of missing data. More sophisticated techniques include imputation, where missing values are replaced with estimated values based on other available data. This can be done using mean imputation, regression imputation, or multiple imputation. The choice of method depends on the nature of the missing data and the research question. A key step is to always document the strategy used to handle missing data and to assess the potential impact on the results.
Q 7. Describe your experience with hypothesis testing and statistical significance.
Hypothesis testing is a cornerstone of statistical inference. It involves formulating a null hypothesis (a statement of no effect or no difference) and an alternative hypothesis (a statement contradicting the null). I then use statistical tests (t-tests, ANOVA, chi-squared tests) to determine the probability of observing the obtained data if the null hypothesis were true (the p-value). If the p-value is below a pre-defined significance level (typically 0.05), we reject the null hypothesis and conclude that there is statistically significant evidence supporting the alternative hypothesis. It’s crucial to understand that statistical significance doesn’t necessarily imply practical significance. A small effect size might be statistically significant with a large sample size but lack practical importance. I always consider effect size alongside p-values when interpreting the results and ensuring a balanced interpretation of my findings.
Q 8. How do you ensure the validity and reliability of your research findings?
Ensuring the validity and reliability of research findings is paramount. Validity refers to whether the research measures what it intends to measure, while reliability refers to the consistency and repeatability of the results. I employ a multi-pronged approach to achieve this.
Rigorous Study Design: A well-defined research question, appropriate methodology (e.g., randomized controlled trials for causal inference, longitudinal studies for tracking changes over time), and a detailed protocol are crucial. For example, when studying the effectiveness of a new drug, a randomized controlled trial minimizes bias by randomly assigning participants to treatment and control groups.
Data Triangulation: I often use multiple data sources (e.g., surveys, interviews, observations) to corroborate findings. This helps to reduce the impact of potential biases inherent in any single data source. For instance, if a survey indicates a high level of customer satisfaction, I might validate it through customer interviews and reviews to get a holistic picture.
Statistical Analysis: Appropriate statistical tests are employed to assess the significance of findings. This includes checking for confounding variables and considering effect sizes. For example, a p-value below 0.05 generally indicates statistical significance, but the effect size tells us the practical importance of the findings.
Peer Review: Submitting research for peer review exposes the work to critical evaluation by experts in the field. This process helps identify weaknesses and improve the overall quality and rigor of the research.
Replication: Encouraging replication of studies allows independent researchers to verify the findings, strengthening confidence in the reliability of the results.
Q 9. Explain your understanding of different sampling techniques.
Sampling techniques are crucial for selecting a representative subset of a population for study. The choice of sampling method depends heavily on the research question and the characteristics of the population. Here are some common techniques:
Probability Sampling: Every member of the population has a known, non-zero chance of being selected. This includes:
- Simple Random Sampling: Each member has an equal chance of selection. Imagine drawing names out of a hat.
- Stratified Random Sampling: The population is divided into strata (e.g., age groups), and random samples are drawn from each stratum. This ensures representation from all relevant subgroups.
- Cluster Sampling: The population is divided into clusters (e.g., geographical areas), and a random sample of clusters is selected. All members within the selected clusters are included in the study.
Non-Probability Sampling: The probability of selection for each member is unknown. This includes:
- Convenience Sampling: Selecting participants who are readily available. This is easy but may not represent the population accurately.
- Quota Sampling: Similar to stratified sampling, but non-random selection is used within each stratum.
- Snowball Sampling: Participants recruit other participants, useful for studying hard-to-reach populations.
The choice of sampling method directly impacts the generalizability of the findings. Probability sampling methods offer stronger generalizability than non-probability sampling methods.
Q 10. How do you interpret and present complex research findings?
Interpreting and presenting complex research findings requires clear, concise communication. I focus on translating technical details into accessible language for the intended audience.
Summarization: Key findings are summarized clearly, avoiding technical jargon unless necessary. I use plain language summaries for non-technical audiences and more detailed reports for experts.
Data Visualization: Graphs, charts, and tables are used to visually represent complex data. This makes patterns and trends easier to understand. I choose the most appropriate visualization technique (e.g., bar charts for comparisons, line graphs for trends) based on the data and the message I want to convey.
Narrative: I weave the findings into a compelling narrative that tells a story about the research. This connects the results to the research questions and helps readers understand the implications of the findings.
Limitations and Future Research: I always acknowledge the limitations of the study and suggest directions for future research. This demonstrates transparency and encourages critical appraisal of the work.
For example, instead of saying ‘the regression model showed a statistically significant positive relationship (p < 0.05) between variable X and variable Y', I might say, 'Our analysis shows a strong link between X and Y, suggesting that as X increases, Y tends to increase as well'.
Q 11. Describe your experience with data visualization tools.
I have extensive experience with various data visualization tools, tailoring my choice to the specific data and the intended audience. My proficiency includes:
Tableau: Excellent for interactive dashboards and exploring large datasets. I use Tableau to create dynamic visualizations that allow users to interact with the data and uncover patterns on their own.
Power BI: Similar to Tableau, Power BI provides strong capabilities for creating reports and dashboards. I often use it for integrating data from diverse sources.
R (ggplot2): A powerful programming language with the ggplot2 package, allowing for highly customizable and publication-quality graphics. I use R for creating complex and precise visualizations when needed.
Python (Matplotlib, Seaborn): Python, with its libraries Matplotlib and Seaborn, offers another flexible option for data visualization, often integrated into my data analysis workflows.
The selection of a specific tool depends on the complexity of the data, the desired level of customization, and the audience. For instance, for a quick overview for a team meeting, a simple Power BI dashboard might suffice, while a publication would require the precision of ggplot2 in R.
Q 12. How do you ensure ethical considerations in your research?
Ethical considerations are paramount in all aspects of my research. I adhere strictly to established ethical guidelines, including:
Informed Consent: Participants are fully informed about the study’s purpose, procedures, risks, and benefits before they consent to participate. They have the right to withdraw at any time without penalty.
Confidentiality and Anonymity: Participant data is protected through secure storage and anonymization techniques to maintain privacy. I follow strict data protection protocols.
Data Integrity: Data is collected and analyzed accurately and transparently. Any potential biases are acknowledged and addressed.
Avoiding Harm: The study is designed to minimize any potential risks to participants, both physical and psychological. If risks are identified, appropriate mitigation strategies are implemented.
Institutional Review Board (IRB) Approval: All research involving human participants undergoes IRB review to ensure ethical compliance.
For example, in a study involving sensitive personal information, I would obtain informed consent, anonymize data, and ensure data security by following all relevant data protection regulations.
Q 13. What is your experience with advanced statistical modeling techniques?
My experience with advanced statistical modeling encompasses a wide range of techniques, depending on the research question and the nature of the data. I frequently utilize:
Regression Analysis: Linear, logistic, and generalized linear models are used to study relationships between variables. I am adept at diagnosing model assumptions, selecting appropriate model specifications and interpreting the results.
Time Series Analysis: ARIMA, SARIMA, and other time series models are applied to analyze data collected over time, identifying trends, seasonality, and other patterns. This is crucial for forecasting and understanding dynamic systems.
Survival Analysis: Techniques like Cox proportional hazards models are used to analyze time-to-event data, common in medical research and other fields where the duration of an event is of interest.
Machine Learning Algorithms: I have experience with various machine learning algorithms, such as regression trees, random forests, support vector machines and neural networks, for predictive modeling and pattern recognition.
Structural Equation Modeling (SEM): SEM is utilized to test complex causal relationships among multiple variables.
Model selection is not arbitrary. I use model selection criteria like AIC and BIC to compare different models and choose the one that best fits the data while avoiding overfitting.
Q 14. How do you manage large datasets efficiently?
Managing large datasets efficiently requires a combination of technical skills and strategic planning. My approach involves:
Data Storage and Management: Utilizing cloud-based storage solutions like AWS S3 or Google Cloud Storage for scalability and cost-effectiveness. Data is often organized in a database management system (DBMS) like PostgreSQL or MySQL for efficient querying and manipulation.
Data Cleaning and Preprocessing: Employing scripting languages such as Python or R with libraries like Pandas and Dplyr to clean, transform, and preprocess data before analysis. This includes handling missing values, outlier detection, and data transformation.
Parallel Processing and Distributed Computing: Leveraging parallel processing techniques and distributed computing frameworks like Apache Spark to perform computationally intensive tasks on large datasets in a reasonable timeframe.
Database Optimization: Optimizing database queries and indexing strategies to reduce query times and improve overall data access speed.
Data Sampling and Subsetting: When computationally infeasible to work with the entire dataset, employing appropriate sampling techniques to select a representative subset for analysis.
For instance, working with a terabyte-sized dataset, I might use Spark to parallelize the analysis, ensuring quick processing while also employing data sampling techniques to optimize model training if necessary.
Q 15. Describe your experience with specific research techniques, such as regression analysis or machine learning algorithms.
My experience with research techniques is extensive, encompassing both linear and non-linear methods. Regression analysis, a cornerstone of statistical modeling, is a frequent tool in my arsenal. I’ve used it extensively to model relationships between variables, for instance, predicting customer churn based on factors like usage patterns and demographics. I often employ multiple linear regression to account for several predictors simultaneously and assess their individual and combined effects. Beyond this, my expertise extends to various machine learning algorithms. For instance, I’ve successfully applied Support Vector Machines (SVMs) for classification tasks, such as identifying fraudulent transactions, and Random Forests for predictive modeling in areas like predicting crop yields. Deep learning techniques, including recurrent neural networks (RNNs) for time-series analysis and convolutional neural networks (CNNs) for image recognition, are also within my skillset. The selection of a specific technique is always driven by the research question, the nature of the data, and the desired outcome. For instance, when dealing with high dimensionality data with complex interactions, Random Forests often outperform linear models due to their ability to handle non-linear relationships.
For example, in a recent project analyzing social media sentiment, I utilized a combination of NLP techniques (natural language processing) to extract sentiment scores from text data, followed by applying a recurrent neural network to predict future trends based on past sentiment. The RNN’s ability to handle sequential data made it ideal for this time-series prediction problem. The results were significantly more accurate than using simpler methods like linear regression.
Career Expert Tips:
- Ace those interviews! Prepare effectively by reviewing the Top 50 Most Common Interview Questions on ResumeGemini.
- Navigate your job search with confidence! Explore a wide range of Career Tips on ResumeGemini. Learn about common challenges and recommendations to overcome them.
- Craft the perfect resume! Master the Art of Resume Writing with ResumeGemini’s guide. Showcase your unique qualifications and achievements effectively.
- Don’t miss out on holiday savings! Build your dream resume with ResumeGemini’s ATS optimized templates.
Q 16. How do you select the appropriate statistical test for your research question?
Selecting the appropriate statistical test hinges on several crucial factors: the type of data (categorical, continuous, ordinal), the research question (difference between groups, association between variables, prediction), and the assumptions of the test. It’s a bit like choosing the right tool for a job – a hammer won’t fix a leaky faucet.
For example, if we want to compare the average height of two groups (e.g., men and women), an independent samples t-test would be suitable if the data are normally distributed. If the data aren’t normally distributed or the sample sizes are small, a non-parametric alternative like the Mann-Whitney U test would be preferred. If we are looking at the association between two categorical variables, a Chi-square test would be appropriate. If we are predicting a continuous outcome based on several predictors, multiple linear regression might be the way to go. However, if we have non-linear relationships or interactions between variables we might use other methods such as random forest or gradient boosting. Careful consideration of these factors ensures that the chosen test is robust and yields meaningful results. There are many resources including statistical textbooks, online calculators, and software packages (such as R or SPSS) that provide guidelines on test selection.
Q 17. How do you identify and mitigate potential biases in your research?
Bias is a significant threat to research validity. Identifying and mitigating bias requires a proactive and multi-faceted approach, beginning at the design stage.
- Sampling bias: This arises when the sample isn’t representative of the population. Techniques like stratified random sampling, where the sample reflects the population’s proportions of key characteristics, can help mitigate this.
- Confirmation bias: This occurs when researchers seek out or interpret data confirming pre-existing beliefs. Using pre-registered protocols, where the study design and analysis plan are defined before data collection, helps minimize this.
- Measurement bias: Inaccurate or imprecise measurement instruments can lead to biased results. Using validated instruments and rigorous quality control procedures are crucial.
- Publication bias: Positive results are more likely to be published, creating a skewed view of the literature. Techniques like meta-analysis, which combines results from multiple studies, can help alleviate this.
Addressing these biases often involves careful planning, robust methodologies, and a critical approach to interpreting data. For instance, in a study evaluating a new drug, blinding (where participants and researchers are unaware of treatment assignment) helps minimize bias related to expectations.
Q 18. How do you communicate your research findings to both technical and non-technical audiences?
Effective communication is crucial for translating research findings into action. I tailor my communication style to the audience. For technical audiences (e.g., colleagues, conferences), I provide detailed explanations, statistical analyses, and advanced methodologies. For non-technical audiences (e.g., the general public, policymakers), I employ clear, concise language, visuals (graphs, charts), and real-world examples.
For instance, when presenting research on climate change to policymakers, I use charts to display trends in temperature and sea level, avoiding complex statistical jargon. But when discussing the same data with climatologists, I delve into advanced modeling techniques and uncertainties. The key is to focus on the story – what are the key findings, their implications, and the next steps? A strong narrative helps connect with all audiences.
Q 19. What experience do you have with peer review and publication processes?
I have extensive experience with peer review and publication. I’ve served as a reviewer for several leading journals in my field, providing constructive feedback on manuscripts to improve their quality and rigor. This involves evaluating the methodology, the analysis, the interpretation of results, and the overall clarity of the presentation. I understand the importance of thoroughness, objectivity, and timeliness in the peer review process.
Furthermore, I have successfully published numerous articles in peer-reviewed journals. The process of manuscript preparation, submission, revision, and acceptance has honed my ability to present research clearly, address reviewer comments effectively, and navigate the complexities of academic publishing.
Q 20. Describe your experience with grant writing or proposal development.
Grant writing is a critical skill for securing funding for research projects. I have a proven track record of successfully writing and submitting grant proposals to various funding agencies. My approach involves a thorough understanding of the agency’s priorities, a clear articulation of the research question and its significance, a well-defined methodology, a realistic budget, and a compelling narrative that highlights the potential impact of the research. I focus on crafting proposals that showcase the feasibility, innovation, and potential societal benefits of the proposed research. The proposal writing process includes careful literature review, development of strong hypotheses and research design, clear articulation of methods, and a comprehensive budget justification.
For example, in a successful grant application for a project on developing early detection methods for a specific disease, I highlighted the significant public health implications and demonstrated the feasibility of the proposed methods through preliminary data and pilot studies.
Q 21. How do you stay up-to-date with advancements in your field of research?
Staying current in a rapidly evolving field like advanced research techniques necessitates a multifaceted approach. I regularly read peer-reviewed journals, attend conferences and workshops, and actively participate in online communities and forums. I also follow leading researchers and institutions on social media and utilize online resources like preprint servers to get early access to the latest research findings. Furthermore, I actively participate in collaborative research projects, exchanging ideas and insights with colleagues from different institutions and backgrounds.
Continuous learning is essential. I engage in online courses and workshops to enhance my skills in specific areas, such as new statistical software or advanced machine learning techniques. Keeping up with advancements is not just about reading papers; it’s about engaging with the community and actively participating in its progress.
Q 22. Describe a situation where your research faced unexpected challenges. How did you overcome them?
During a research project investigating the impact of social media on political polarization, we encountered unexpected challenges when our initial survey methodology yielded low response rates and a skewed demographic representation. This threatened the generalizability of our findings. To overcome this, we implemented a multi-pronged strategy. First, we revised our survey design to be more concise and engaging, incorporating multimedia elements. Second, we expanded our recruitment channels to include diverse online platforms and community groups, targeting underrepresented demographics. Finally, we employed weighted statistical techniques to account for the initial sampling bias in our data analysis. This combination of improved data collection and advanced statistical methods allowed us to gather a more representative dataset and successfully complete the project.
Q 23. How do you evaluate the quality and credibility of research sources?
Evaluating research sources requires a critical and multi-faceted approach. I assess credibility through several key lenses: Author Expertise: I examine the author’s credentials, publications, and experience in the relevant field. Is this person recognized as an expert? Peer Review: Has the research undergone peer review by other experts in the field? Peer-reviewed articles published in reputable journals hold more weight. Methodology: I scrutinize the research methods employed. Is the methodology rigorous, transparent, and appropriate for the research question? Are biases minimized? Data Source and Analysis: I examine the data sources used and the statistical methods applied. Are the data reliable and valid? Are the statistical analyses appropriate and correctly interpreted? Reputable Source: Is the research published in a respected journal or book by a trusted publisher? Are there multiple studies supporting the same conclusion? Considering these factors collectively provides a robust assessment of research quality and credibility. A single weak point can raise a red flag, demanding further investigation.
Q 24. Explain your understanding of different types of research biases.
Research biases are systematic errors that can distort the results of a study. Several types exist:
- Confirmation Bias: The tendency to favor information that confirms pre-existing beliefs while ignoring contradictory evidence. For example, selectively searching for evidence supporting a hypothesis and dismissing conflicting findings.
- Selection Bias: A bias in the selection of participants or data that leads to an unrepresentative sample. A classic example is selecting participants for a study based solely on their availability, leading to a non-random sample.
- Publication Bias: The tendency for studies with positive or significant results to be published more frequently than those with null or negative results, leading to an incomplete picture of the evidence.
- Observer Bias: The researcher’s expectations or biases influencing the observation and recording of data. For instance, a researcher might unconsciously interpret ambiguous data in a way that supports their hypothesis.
- Funding Bias: Bias introduced by the source of funding for the research project. For example, a study funded by a company with a vested interest in a particular outcome might be influenced to produce favorable results.
Understanding these biases is crucial for designing robust research studies and critically evaluating existing literature. Employing rigorous methodologies, transparent data collection, and blinded analysis can help mitigate their impact.
Q 25. What are your strengths and weaknesses as a researcher?
My strengths as a researcher include my meticulous attention to detail, a strong analytical capability, and my ability to synthesize complex information effectively. I am adept at identifying and addressing potential biases in research design and data analysis. I also thrive in collaborative settings and enjoy sharing my knowledge with others. However, one area I am continually working on is time management, especially when juggling multiple projects with competing deadlines. I am actively implementing project management techniques like agile methodologies to improve my efficiency and prioritize tasks more effectively.
Q 26. How do you handle conflicting research results?
Conflicting research results necessitate a thorough and systematic investigation. My approach involves several steps: Review Methodologies: I critically examine the methodologies of the conflicting studies, looking for differences in sample size, participant selection, data collection techniques, and statistical analyses. Identify Potential Biases: I assess each study for potential sources of bias, such as publication bias, selection bias, or funding bias. Contextualize Findings: I consider the context of each study, including the year of publication, population studied, and specific research question. Synthesize Evidence: If possible, I conduct a meta-analysis to combine the findings of multiple studies and assess the overall effect size. Seek Further Research: If the conflict remains unresolved, I may recommend further research to address the inconsistencies or explore additional factors that might explain the differing results. This systematic approach helps in understanding the nuances of conflicting findings and drawing informed conclusions.
Q 27. Describe your experience with collaborative research projects.
I have extensive experience in collaborative research projects, both as a team leader and a team member. In one project investigating the effects of climate change on coastal ecosystems, I collaborated with marine biologists, ecologists, and data scientists. My role was to integrate and analyze the data gathered from various sources, developing statistical models to predict future ecosystem changes. Effective collaboration requires clear communication, mutual respect, and a shared understanding of the project goals. I believe in fostering an inclusive environment where all team members feel empowered to contribute their expertise. Regular meetings, clear task assignments, and transparent communication are crucial for successful collaborative research. Tools like shared online platforms for data storage and project management are invaluable for streamlining workflow and maintaining project transparency.
Q 28. How do you prioritize multiple research tasks effectively?
Prioritizing multiple research tasks requires a structured approach. I employ several strategies: Prioritization Matrix: I use a matrix to categorize tasks based on their urgency and importance (e.g., Eisenhower Matrix). High-urgency, high-importance tasks are tackled first. Time Blocking: I allocate specific time blocks for dedicated work on individual tasks to enhance focus and manage time effectively. Project Management Tools: I leverage project management software to track progress, set deadlines, and allocate resources efficiently. This ensures that all aspects of multiple ongoing projects are visible and manageable. Realistic Goal Setting: Setting achievable goals for each task prevents burnout and helps maintain focus. Regular review and adjustment of priorities based on project demands is essential for managing multiple tasks concurrently. Employing these techniques promotes efficient task management and minimizes conflicts or delays in completing multiple research projects.
Key Topics to Learn for Advanced Research Techniques Interview
- Research Design & Methodology: Understanding various research paradigms (qualitative, quantitative, mixed methods), selecting appropriate research designs, and justifying methodological choices based on research questions.
- Data Collection & Analysis: Mastering techniques for data gathering (surveys, interviews, experiments, observations), proficiently using statistical software (e.g., SPSS, R, Python) for data analysis, and interpreting results effectively.
- Advanced Statistical Modeling: Familiarity with regression analysis, ANOVA, factor analysis, structural equation modeling, and other advanced statistical techniques relevant to your field of research.
- Literature Review & Synthesis: Critically evaluating existing research, identifying gaps in knowledge, and synthesizing findings to build a coherent narrative and contribute meaningfully to the field.
- Ethical Considerations in Research: Understanding and applying ethical principles in research design, data collection, analysis, and dissemination of findings, including informed consent and data privacy.
- Data Visualization & Presentation: Effectively communicating research findings through clear and concise visualizations (graphs, charts, tables) and compelling presentations.
- Problem-Solving & Critical Thinking: Demonstrating the ability to identify research problems, formulate hypotheses, design appropriate research strategies, interpret results, and draw sound conclusions.
- Specific Techniques Relevant to Your Field: Deepen your knowledge of techniques specific to your area of specialization within advanced research techniques (e.g., qualitative coding methods for sociology, experimental design for psychology, etc.).
Next Steps
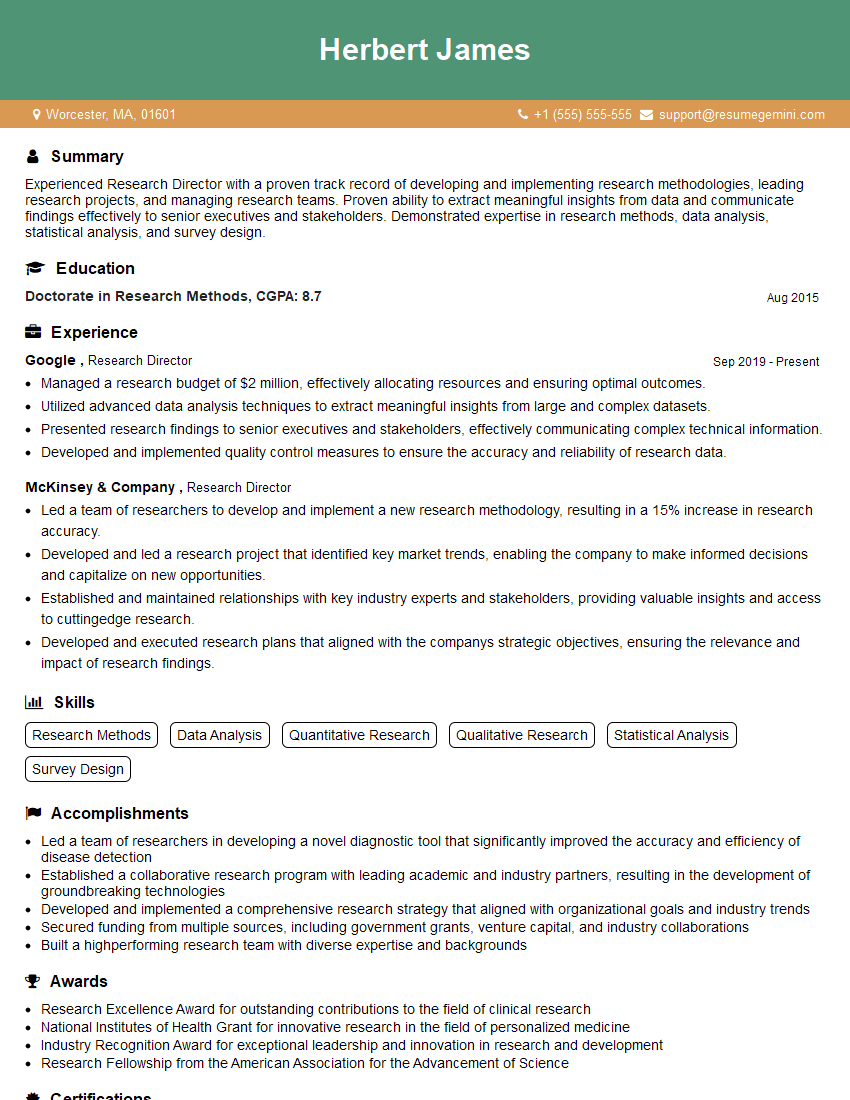
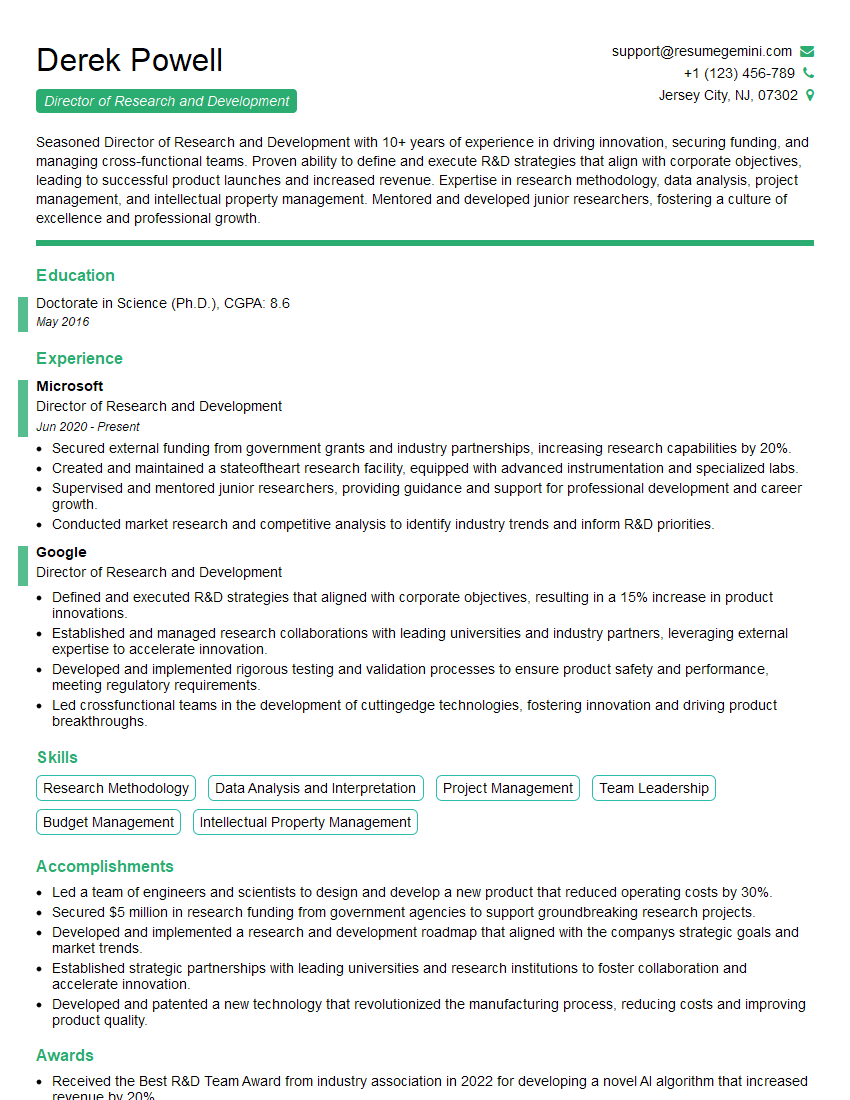
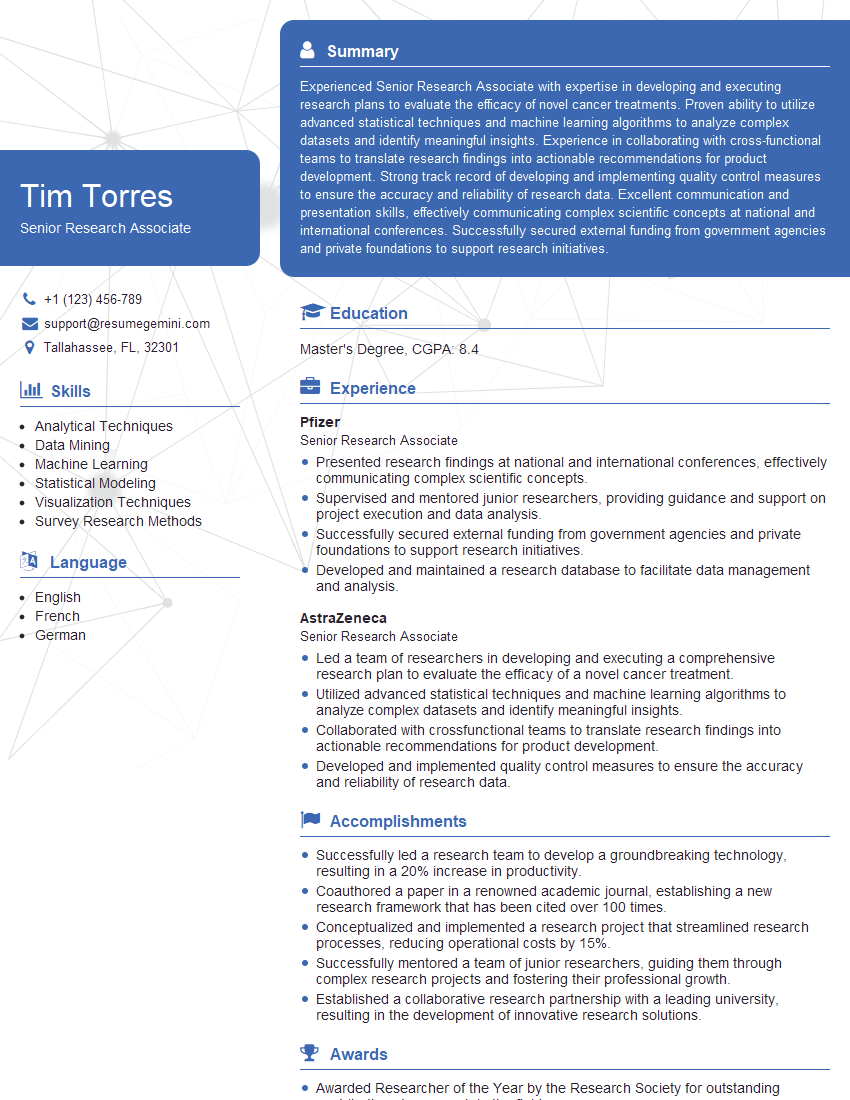
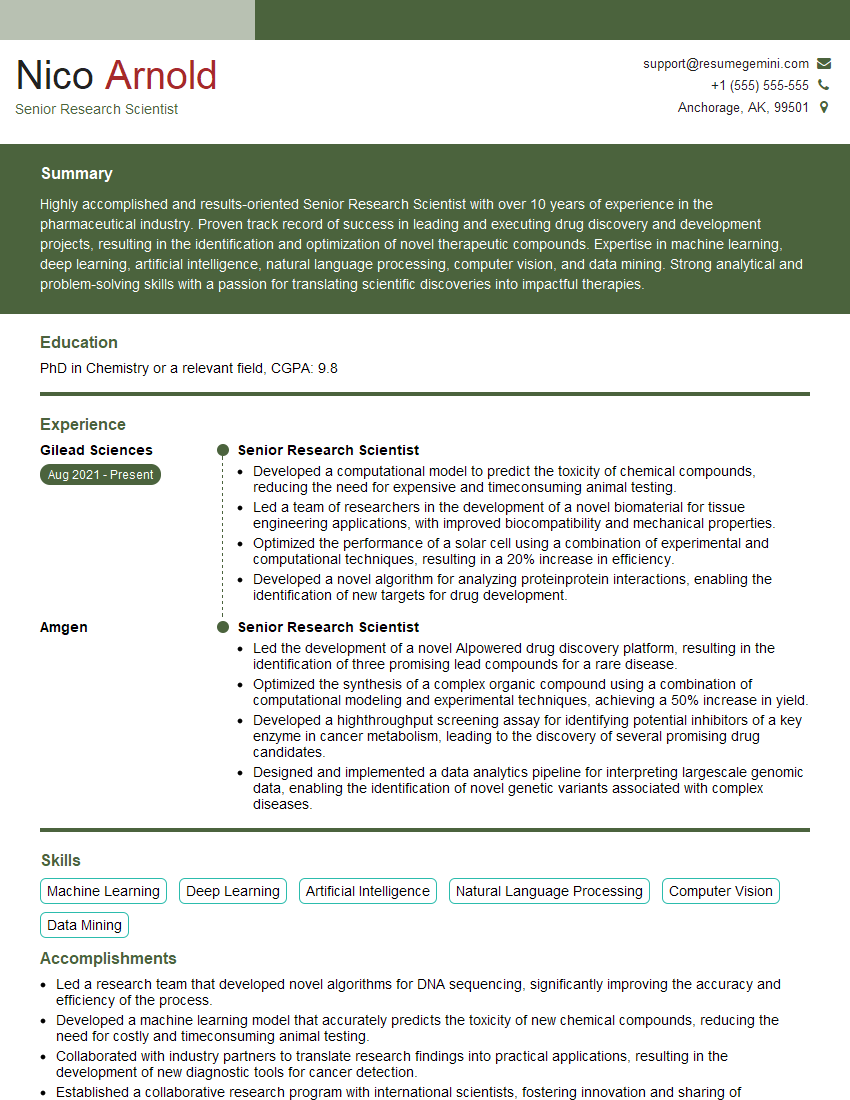
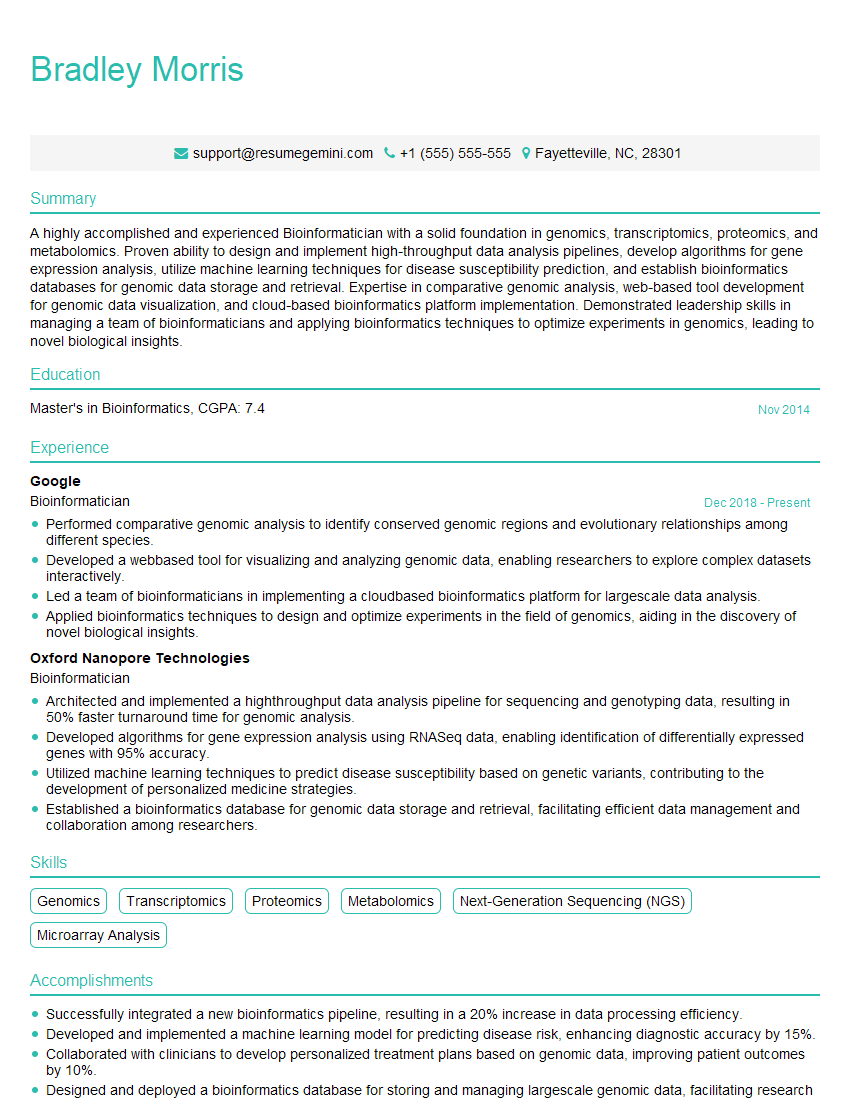
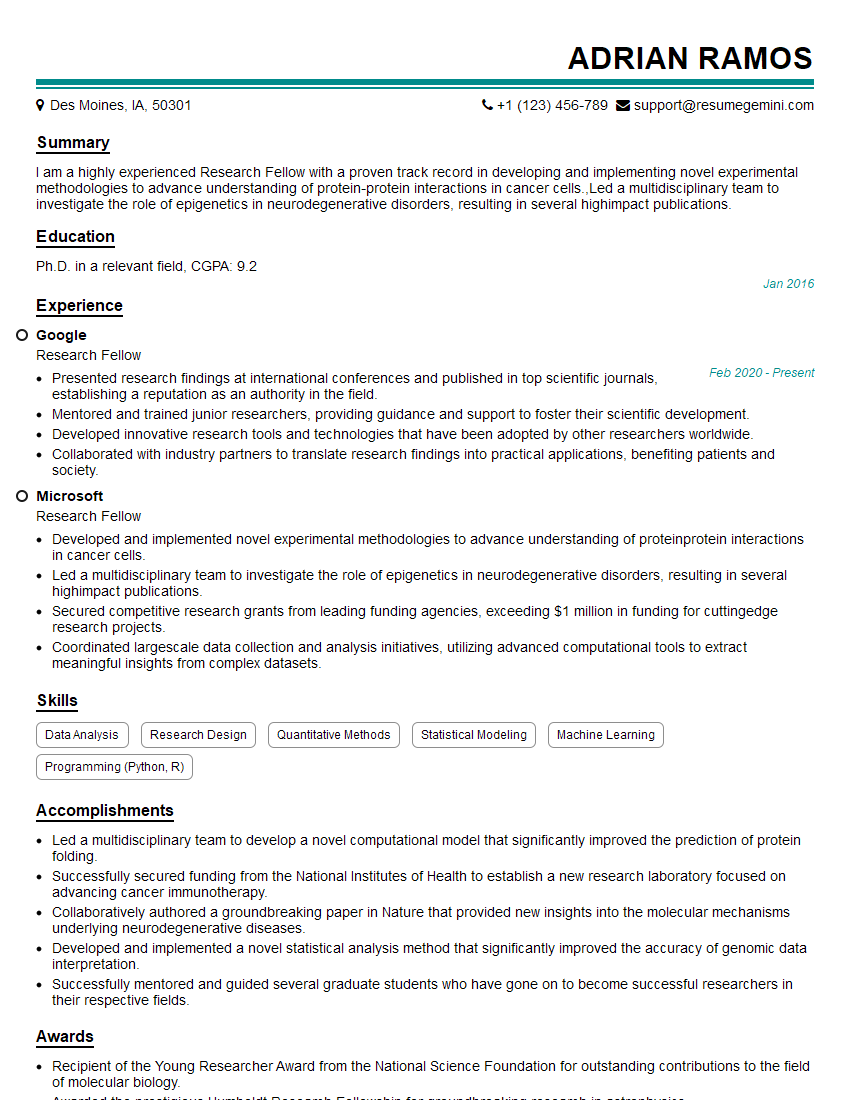
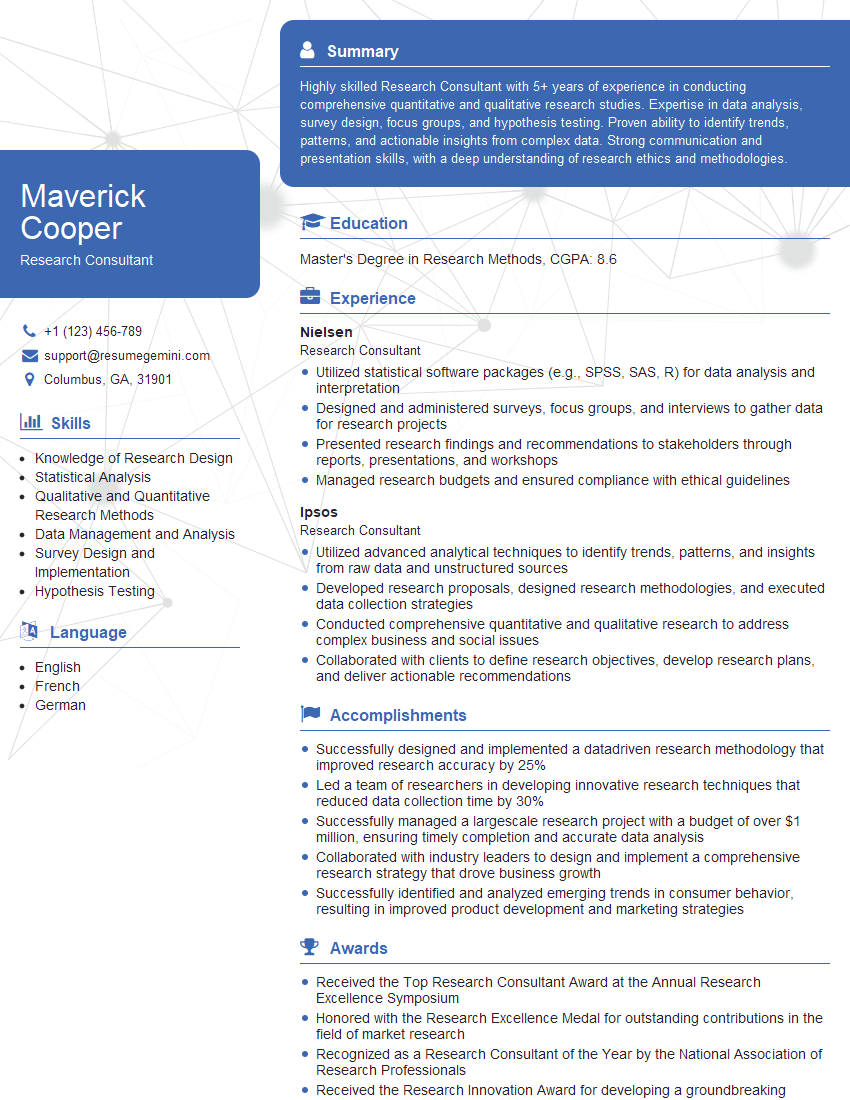
Mastering advanced research techniques is crucial for career advancement, opening doors to exciting opportunities in academia, industry, and government. A strong command of these techniques demonstrates your capability for independent and collaborative research, problem-solving, and critical thinking – highly valued skills in today’s competitive job market. To significantly boost your job prospects, focus on building an ATS-friendly resume that effectively showcases your expertise. ResumeGemini is a trusted resource to help you craft a compelling and professional resume that highlights your skills and experience. Examples of resumes tailored to showcasing expertise in Advanced Research Techniques are available within ResumeGemini to further guide your efforts.
Explore more articles
Users Rating of Our Blogs
Share Your Experience
We value your feedback! Please rate our content and share your thoughts (optional).
What Readers Say About Our Blog
Hello,
We found issues with your domain’s email setup that may be sending your messages to spam or blocking them completely. InboxShield Mini shows you how to fix it in minutes — no tech skills required.
Scan your domain now for details: https://inboxshield-mini.com/
— Adam @ InboxShield Mini
Reply STOP to unsubscribe
Hi, are you owner of interviewgemini.com? What if I told you I could help you find extra time in your schedule, reconnect with leads you didn’t even realize you missed, and bring in more “I want to work with you” conversations, without increasing your ad spend or hiring a full-time employee?
All with a flexible, budget-friendly service that could easily pay for itself. Sounds good?
Would it be nice to jump on a quick 10-minute call so I can show you exactly how we make this work?
Best,
Hapei
Marketing Director
Hey, I know you’re the owner of interviewgemini.com. I’ll be quick.
Fundraising for your business is tough and time-consuming. We make it easier by guaranteeing two private investor meetings each month, for six months. No demos, no pitch events – just direct introductions to active investors matched to your startup.
If youR17;re raising, this could help you build real momentum. Want me to send more info?
Hi, I represent an SEO company that specialises in getting you AI citations and higher rankings on Google. I’d like to offer you a 100% free SEO audit for your website. Would you be interested?
Hi, I represent an SEO company that specialises in getting you AI citations and higher rankings on Google. I’d like to offer you a 100% free SEO audit for your website. Would you be interested?
good
