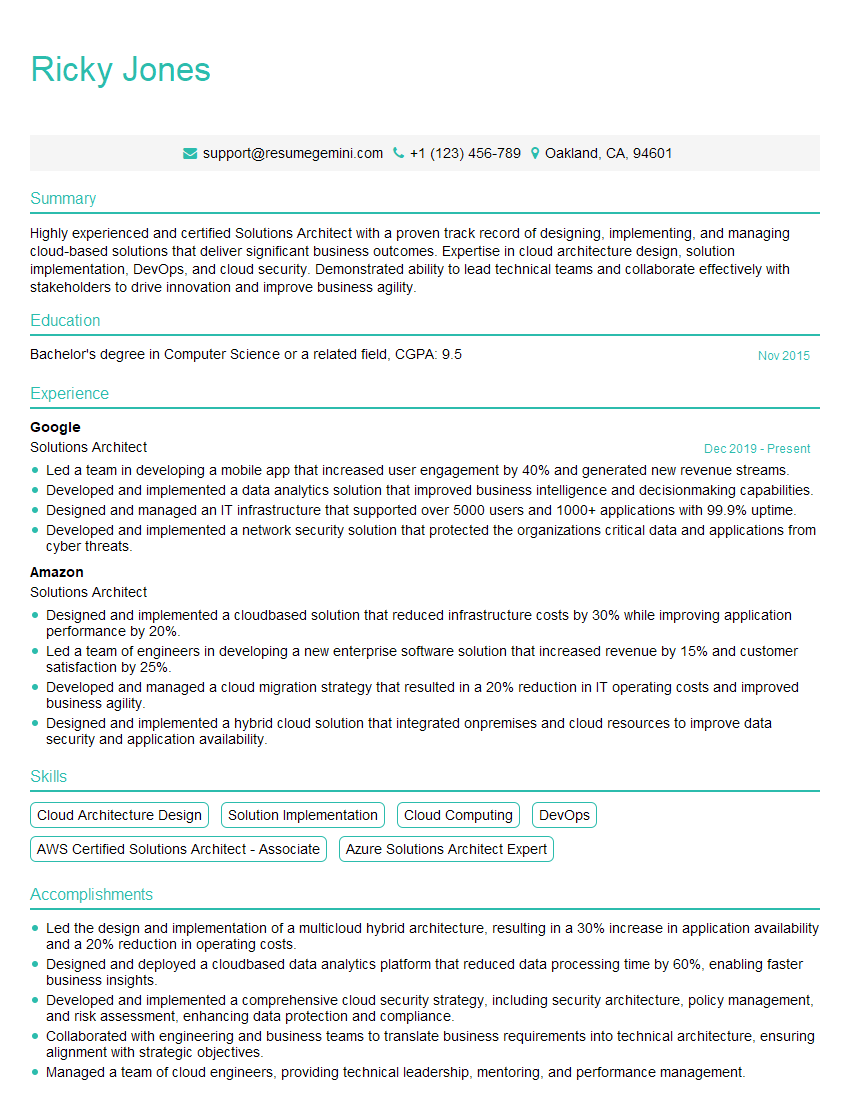
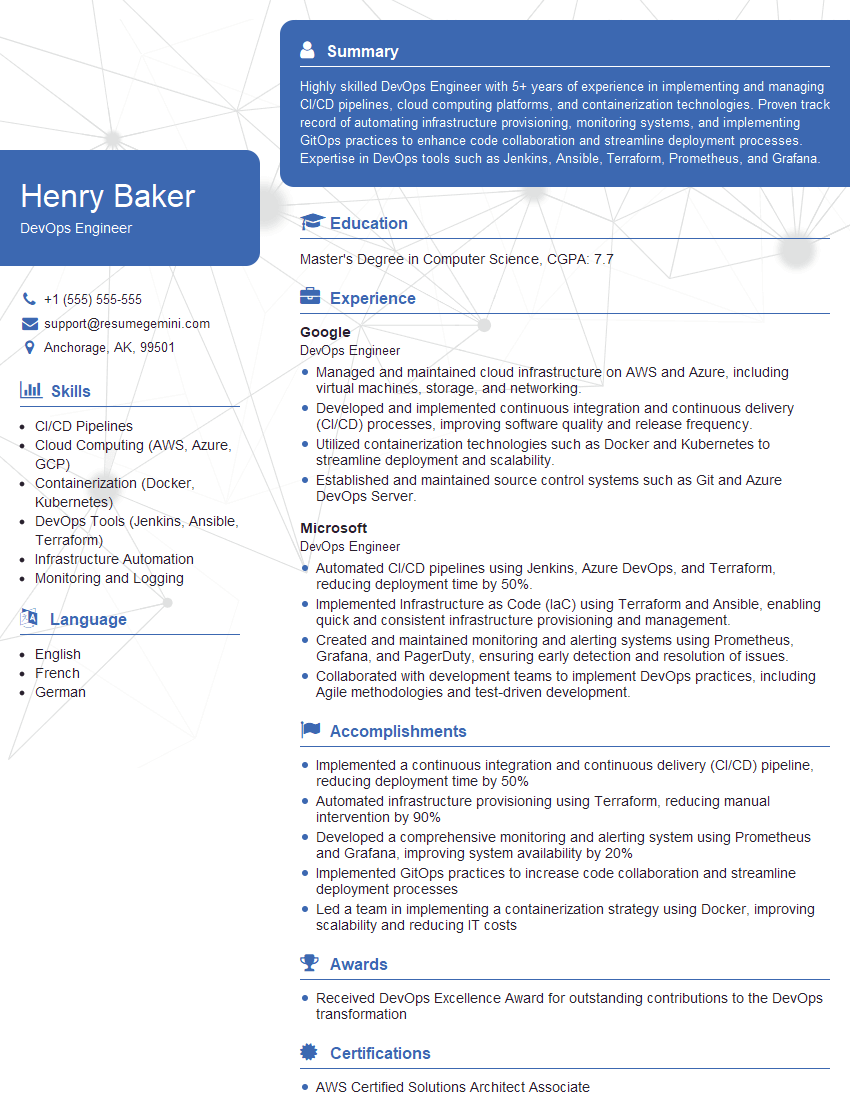
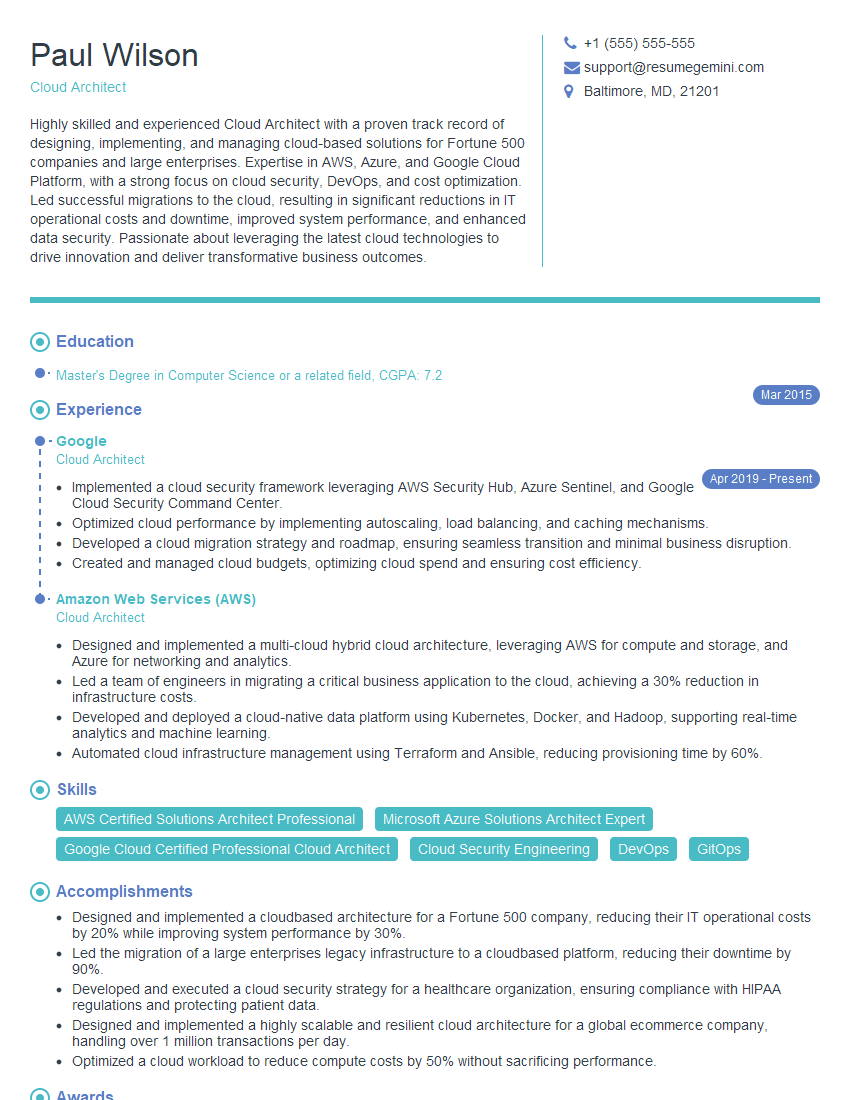
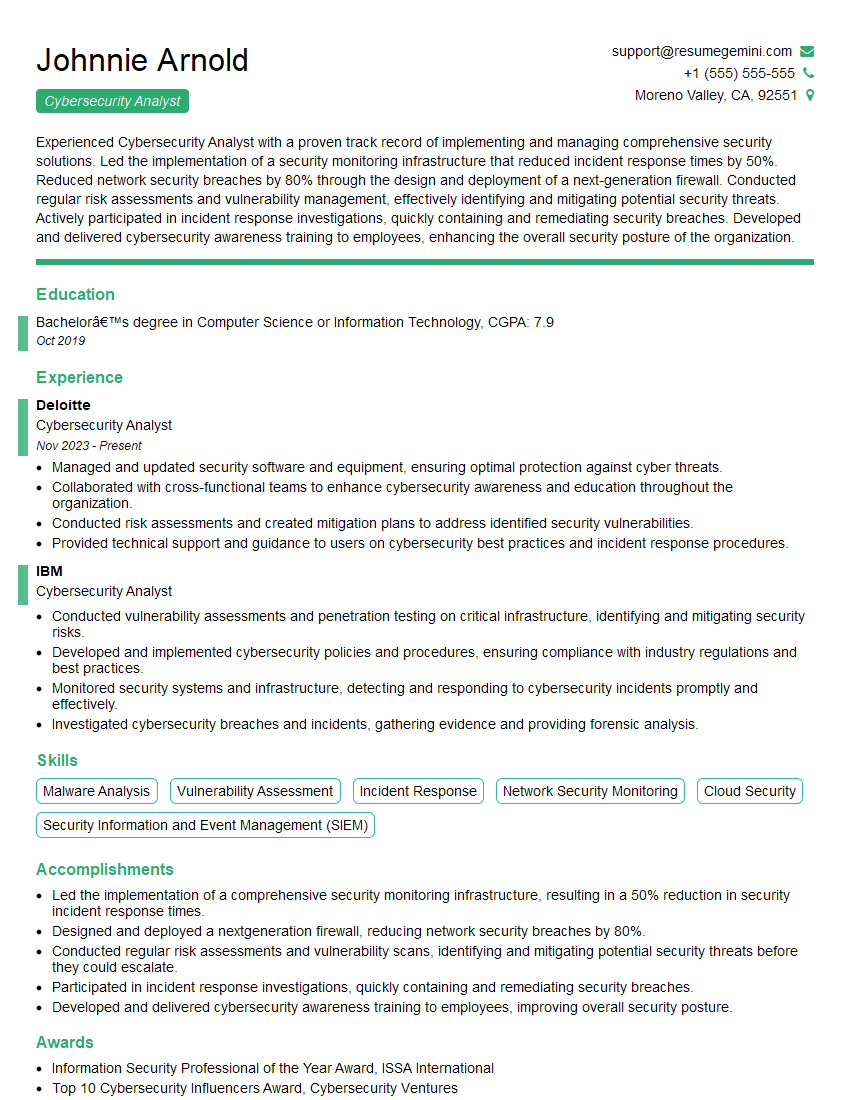
Are you ready to stand out in your next interview? Understanding and preparing for Analytical and Technical Aptitude interview questions is a game-changer. In this blog, we’ve compiled key questions and expert advice to help you showcase your skills with confidence and precision. Let’s get started on your journey to acing the interview.
Questions Asked in Analytical and Technical Aptitude Interview
Q 1. Explain the difference between correlation and causation.
Correlation and causation are two distinct concepts in statistics. Correlation describes the relationship between two variables; it indicates whether they tend to change together. Causation, on the other hand, implies that one variable directly influences or causes a change in another. Just because two variables are correlated doesn’t mean one causes the other. There could be a third, unseen variable influencing both.
Example: Ice cream sales and crime rates are often positively correlated – they both tend to increase during summer. However, this doesn’t mean that eating ice cream causes crime, or vice versa. The underlying cause is the warmer weather, which leads to more people being outside (both buying ice cream and potentially committing crimes).
To establish causation, you need to demonstrate a direct link between the variables, often through controlled experiments or rigorous statistical analysis that accounts for confounding factors. Correlation is a starting point for investigation, but it’s never sufficient proof of causation.
Q 2. Describe a time you had to analyze a large dataset. What techniques did you use?
In a previous role, I analyzed a large dataset of customer transactions to identify patterns and predict future sales. The dataset contained millions of records with details like purchase date, product category, customer demographics, and purchase amount. Because of the sheer size, I couldn’t load the entire dataset into memory at once.
My approach involved several techniques:
- Sampling: I initially worked with a representative random sample of the data to explore patterns and test different analytical methods. This allowed for faster processing and experimentation without needing the entire dataset.
- Data Cleaning and Preprocessing: I addressed missing values and outliers using appropriate techniques like imputation (filling missing data) and winsorization (capping extreme values). I also performed data transformations like log transformations to handle skewed data.
- Dimensionality Reduction: To handle the many variables, I utilized Principal Component Analysis (PCA) to reduce the number of features while retaining most of the important information. This simplified the analysis and improved model performance.
- Regression Modeling: I built various regression models (linear, polynomial, etc.) to predict sales based on identified features. I compared the performance of different models using metrics such as R-squared and Mean Squared Error (MSE).
- Big Data Technologies: To process the full dataset efficiently, I employed tools like Apache Spark or Hadoop, which allow for distributed computing across multiple machines.
This approach allowed me to effectively analyze the vast dataset and deliver actionable insights to guide business decisions.
Q 3. How would you approach troubleshooting a complex technical issue?
My approach to troubleshooting complex technical issues is systematic and methodical. I follow a structured process:
- Reproduce the Problem: The first step is to consistently reproduce the issue. This often involves documenting the steps to reproduce the error, including the system environment, relevant inputs, and the precise error message.
- Gather Information: I collect as much relevant information as possible. This includes logs, error messages, system specifications, and any other data that might shed light on the problem. I also talk to other team members who might have encountered similar issues.
- Isolate the Problem: I attempt to isolate the root cause by systematically eliminating potential sources of error. This often involves breaking the problem down into smaller, more manageable parts.
- Formulate Hypotheses: Based on the collected information, I develop potential hypotheses about the cause of the problem. I prioritize the most likely causes based on my experience and the available evidence.
- Test Hypotheses: I systematically test each hypothesis through experimentation, simulation, or further analysis. This might involve modifying code, changing system configurations, or running specific tests.
- Implement Solution: Once the root cause is identified and verified, I implement a solution and thoroughly test it to ensure that the problem is resolved and doesn’t reoccur.
- Document Findings: Finally, I document the problem, the troubleshooting steps, and the implemented solution to aid future debugging efforts.
This structured approach helps me to efficiently solve complex problems while minimizing the time spent on trial-and-error.
Q 4. What are your preferred methods for data visualization?
My preferred methods for data visualization depend heavily on the type of data and the insights I’m trying to convey. However, I frequently use:
- Bar charts and histograms: For comparing categorical data or showing the distribution of a numerical variable.
- Scatter plots: For visualizing the relationship between two numerical variables and identifying correlations.
- Line charts: For showing trends over time.
- Box plots: For comparing the distribution of a numerical variable across different categories.
- Heatmaps: To visualize correlations between many variables or to display data density.
- Interactive dashboards: For exploring large datasets and allowing users to filter and drill down into specific aspects of the data.
Beyond the specific chart type, I prioritize clarity, accuracy, and effective communication of the data. I ensure that the visualizations are well-labeled, easy to understand, and tailored to the audience. Tools like Tableau or Python libraries (Matplotlib, Seaborn) are frequently employed.
Q 5. Explain your understanding of statistical significance.
Statistical significance refers to the probability that an observed result is not due to random chance. It’s typically expressed as a p-value. A small p-value (commonly below 0.05) suggests that the observed effect is unlikely to be due to chance and provides evidence in favor of the alternative hypothesis.
Example: Imagine testing a new drug. If the p-value for the drug’s effectiveness is 0.01, it means there’s only a 1% chance that the observed improvement in the treatment group is due to random variation. We would consider this statistically significant.
It’s crucial to understand that statistical significance doesn’t automatically imply practical significance. A small p-value might indicate a statistically significant effect, but the magnitude of that effect could be too small to be practically relevant.
Furthermore, the choice of significance level (e.g., 0.05) is arbitrary, and a result just barely below the threshold might not be robust. It’s always advisable to consider the effect size and the context of the results along with statistical significance.
Q 6. How do you handle conflicting priorities in a project?
Handling conflicting priorities requires a proactive and collaborative approach. My strategy involves:
- Clearly Define Priorities: I begin by clearly understanding all project goals and their relative importance. This may involve discussions with stakeholders to establish a common understanding of priorities.
- Prioritization Framework: I use a prioritization framework (e.g., MoSCoW method – Must have, Should have, Could have, Won’t have) to rank tasks based on their impact and urgency. This framework helps make objective decisions when resources are limited.
- Communication and Collaboration: Open communication is crucial. I proactively discuss conflicting priorities with the team and stakeholders, explaining the rationale behind the prioritization decisions.
- Negotiation and Compromise: When necessary, I’m willing to negotiate and compromise to find mutually acceptable solutions. This might involve adjusting timelines, adjusting scope, or identifying alternative approaches.
- Documentation and Tracking: I meticulously track decisions made regarding conflicting priorities and ensure that they are clearly documented. This transparency is crucial for accountability and helps to prevent misunderstandings.
By using a structured approach and fostering open communication, I can effectively manage conflicting priorities and ensure that the project stays on track and meets the most critical objectives.
Q 7. Describe your experience with SQL or other database query languages.
I have extensive experience using SQL for data manipulation and retrieval. I’m proficient in writing complex queries involving joins, subqueries, aggregations, and window functions. I’m also familiar with various database systems, including MySQL, PostgreSQL, and SQL Server.
Example: Let’s say I need to find the total sales for each product category in the last month. I might use a query like this:
SELECT product_category, SUM(sales_amount) AS total_sales FROM sales_table WHERE order_date >= DATE_SUB(CURDATE(), INTERVAL 1 MONTH) GROUP BY product_category;This query selects the product category and sums the sales amount, filtering for orders in the last month and grouping the results by product category.
Beyond basic queries, I’m skilled in optimizing queries for performance, working with large datasets, and ensuring data integrity. I’ve also used SQL to create stored procedures, views, and triggers to improve database efficiency and maintainability. My experience extends to using other database query languages as needed for specific projects, demonstrating adaptability and a willingness to learn new tools.
Q 8. What programming languages are you proficient in?
My core programming proficiency lies in Python and Java. Python’s versatility makes it ideal for data analysis, machine learning, and scripting, while Java’s robustness and scalability are crucial for building large-scale applications. I also have working knowledge of SQL for database management and R for statistical computing. My choice of language always depends on the specific project requirements and its constraints.
For instance, I’d choose Python for a quick data analysis script needing efficient library support like Pandas and NumPy. Conversely, for a high-performance, distributed system, I’d opt for Java’s multithreading capabilities and its rich ecosystem.
Q 9. How would you explain a complex technical concept to a non-technical audience?
Explaining complex technical concepts to a non-technical audience requires careful planning and simplification. I usually start by establishing a relatable analogy, using everyday experiences to build a common understanding. Then, I break down the concept into smaller, easily digestible chunks, avoiding jargon and using clear, concise language. Visual aids, like diagrams or charts, are extremely helpful in conveying information more effectively.
For example, explaining cloud computing might involve comparing it to a utility service like electricity: you don’t need to own a power plant to use electricity, just like you don’t need to own servers to use cloud services. I would then gradually introduce terms like ‘servers’ and ‘data storage’ within this context, ensuring each term is explained clearly.
Q 10. Walk me through your problem-solving process.
My problem-solving process follows a structured approach:
- Understanding the problem: I begin by clearly defining the problem, identifying its constraints and desired outcomes. This often involves asking clarifying questions to ensure complete comprehension.
- Developing a plan: Once the problem is understood, I devise a plan by breaking it down into smaller, manageable tasks. This could involve sketching a flowchart or outlining a step-by-step process.
- Implementing the plan: I then execute the plan, meticulously testing each step to identify and rectify any errors or inefficiencies. This iterative process involves debugging and refining the solution.
- Testing and validation: Once the solution is implemented, I rigorously test it against the defined requirements and constraints, ensuring it functions correctly and efficiently.
- Refinement and optimization: Based on the testing results, I refine the solution to enhance its performance, maintainability, and scalability.
This methodical approach allows me to address complex problems effectively and efficiently, delivering robust and reliable solutions.
Q 11. Describe a time you identified a critical flaw in a system or process.
In a previous project involving a large-scale data processing pipeline, I identified a critical flaw in the error handling mechanism. The system was designed to process vast amounts of data, but the error handling was inadequate, causing the entire pipeline to crash when encountering even minor errors. This resulted in significant downtime and data loss.
I proposed a solution that involved implementing a more robust error logging and recovery system. This included adding exception handling to individual components, implementing automated retry mechanisms, and creating a centralized error monitoring dashboard. This improvement minimized downtime and ensured data integrity, preventing costly failures.
Q 12. How do you stay up-to-date with the latest advancements in your field?
Staying current in this rapidly evolving field requires a multi-pronged approach. I actively participate in online communities and forums, such as Stack Overflow and relevant subreddits, to engage in discussions and learn from other experts. I regularly follow industry blogs, publications, and podcasts dedicated to analytical and technical advancements. Furthermore, I dedicate time to online courses and workshops to delve into specific technologies and enhance my skillset.
Attending conferences and webinars, when possible, provides invaluable networking opportunities and access to cutting-edge research. Finally, actively experimenting with new tools and techniques on personal projects helps solidify my understanding and practical application of the latest advancements.
Q 13. What are some common algorithms and data structures you use?
My work frequently uses a variety of algorithms and data structures. Some common ones include:
- Algorithms: Sorting algorithms (merge sort, quick sort), searching algorithms (binary search, breadth-first search), graph traversal algorithms (depth-first search, Dijkstra’s algorithm), dynamic programming algorithms.
- Data Structures: Arrays, linked lists, trees (binary trees, AVL trees), graphs, hash tables, heaps.
The selection of the appropriate algorithm and data structure is crucial for optimization. For example, using a hash table for fast lookups versus a sorted array for efficient range queries. Understanding the trade-offs between different data structures and algorithms is key to building efficient systems.
Q 14. Explain the concept of Big O notation.
Big O notation describes the upper bound of the time or space complexity of an algorithm as the input size grows. It’s a way to measure how efficiently an algorithm performs in terms of resources as the input data increases. It doesn’t measure the exact execution time, but rather provides a comparative measure of how the time or space requirements scale with the input size.
For example, O(n) represents linear time complexity – the execution time increases linearly with the input size (n). O(1) represents constant time complexity – the execution time remains constant regardless of the input size. O(n^2) represents quadratic time complexity – the execution time increases proportionally to the square of the input size. Understanding Big O notation helps in choosing algorithms that perform optimally for different input sizes and resource constraints.
Q 15. Describe your experience with version control systems (e.g., Git).
Version control systems, like Git, are essential for managing code and collaborating effectively on projects. Think of it as a sophisticated ‘undo’ button for your entire project, allowing you to track changes, revert to previous versions, and collaborate seamlessly with others. My experience spans several years, primarily using Git for managing diverse projects, from small individual tasks to large-scale collaborative efforts involving multiple developers. I’m proficient in branching strategies (like Gitflow), merging, resolving conflicts, and using remote repositories like GitHub and GitLab. For instance, in a recent project involving a machine learning model, Git allowed us to track every iteration of the model’s architecture and hyperparameters, enabling us to easily revert to previous versions if needed and compare performance across different iterations. I understand the importance of clear commit messages, robust branching strategies, and regular pushes to maintain a clean and organized repository.
I’m also familiar with using Git for non-code assets, versioning data files and documentation alongside the codebase ensuring the entire project history is preserved. This is particularly crucial for reproducibility and auditability.
Career Expert Tips:
- Ace those interviews! Prepare effectively by reviewing the Top 50 Most Common Interview Questions on ResumeGemini.
- Navigate your job search with confidence! Explore a wide range of Career Tips on ResumeGemini. Learn about common challenges and recommendations to overcome them.
- Craft the perfect resume! Master the Art of Resume Writing with ResumeGemini’s guide. Showcase your unique qualifications and achievements effectively.
- Don’t miss out on holiday savings! Build your dream resume with ResumeGemini’s ATS optimized templates.
Q 16. How do you ensure data quality and accuracy?
Data quality is paramount for reliable analysis and informed decision-making. My approach involves a multi-faceted strategy focusing on prevention and detection. Prevention starts with defining clear data requirements and validation rules upfront, ensuring data is captured correctly at the source. This may involve working closely with data entry personnel to establish clear procedures and standardized data formats. Then, I employ automated checks and validation techniques throughout the data pipeline to detect anomalies and inconsistencies early. This could involve using data profiling tools to identify outliers, invalid data types, or missing values. Detection employs robust techniques like data visualization and statistical analysis to identify patterns indicative of poor data quality, which are then investigated to determine the root cause.
For example, in a customer analysis project, I discovered inconsistencies in customer address data using a combination of data visualization (identifying clusters of unusual addresses) and data validation (detecting invalid zip codes). This led us to identify an error in the data entry process that was promptly corrected. Regular audits and data cleaning steps are critical to maintain data quality, and I utilize scripting languages like Python with libraries such as Pandas to automate these processes efficiently and consistently.
Q 17. Explain your understanding of different data mining techniques.
Data mining techniques are used to extract meaningful patterns and insights from large datasets. My understanding encompasses various techniques, broadly categorized into supervised and unsupervised learning methods.
- Supervised learning involves training a model on labeled data to predict outcomes. This includes techniques like regression (predicting continuous variables like sales revenue) and classification (predicting categorical variables like customer churn). Examples include linear regression, logistic regression, support vector machines, and decision trees.
- Unsupervised learning involves discovering patterns in unlabeled data. This includes clustering (grouping similar data points together, like customer segmentation based on purchase behavior) and dimensionality reduction (reducing the number of variables while preserving important information, like principal component analysis).
- Association rule mining is used to discover relationships between variables, often used in market basket analysis (identifying products frequently purchased together).
The choice of technique depends heavily on the specific problem and the characteristics of the data. For example, if I need to predict customer satisfaction, I’d likely use a supervised learning method like regression. If the goal is to segment customers into different groups, I’d use an unsupervised clustering technique. Throughout, rigorous evaluation metrics are vital to ensure model reliability.
Q 18. How would you handle missing data in a dataset?
Handling missing data is crucial because it can significantly bias results and reduce the accuracy of analysis. The approach depends on the nature and extent of the missing data and the specific analytical goals.
- Deletion: Listwise or pairwise deletion removes entire rows or columns with missing values. This is simple but can lead to significant data loss, particularly if missingness is not random.
- Imputation: This involves filling in missing values with estimated values. Common methods include mean/median imputation (replacing missing values with the average or median of the observed values), k-nearest neighbor imputation (using the values of similar data points to estimate missing values), and model-based imputation (using a statistical model to predict missing values).
The best method depends on the context. For example, if the missing data is minimal and randomly distributed, simple imputation methods might suffice. However, if the missing data is substantial or non-random, more sophisticated methods like model-based imputation or multiple imputation (generating multiple plausible imputed datasets) are more appropriate. Always document the approach and evaluate its impact on the analysis.
Q 19. Describe your experience with A/B testing.
A/B testing, also known as split testing, is a controlled experiment used to compare two versions of a webpage, app, or other digital feature to determine which performs better. My experience involves designing, implementing, and analyzing A/B tests to optimize user experience and conversion rates. The process typically involves randomly assigning users to different groups (A and B), exposing each group to a different version of the feature, and then comparing key metrics (e.g., click-through rates, conversion rates, engagement time). Statistical significance tests are crucial to ensure observed differences aren’t merely due to chance. For example, I once conducted an A/B test on a website’s landing page, comparing two different button designs. The results revealed that one design significantly increased conversion rates, leading to a measurable improvement in business outcomes. Careful attention must be paid to sample size, randomization, and the selection of appropriate metrics to ensure reliable and actionable results.
Q 20. Explain your understanding of hypothesis testing.
Hypothesis testing is a statistical method used to make inferences about a population based on sample data. It involves formulating a null hypothesis (a statement of no effect or no difference) and an alternative hypothesis (a statement contradicting the null hypothesis). We then use statistical tests to determine the probability of observing the obtained data if the null hypothesis were true (the p-value). If the p-value is below a predetermined significance level (alpha, often 0.05), we reject the null hypothesis in favor of the alternative hypothesis. For instance, in a clinical trial, the null hypothesis might be that a new drug has no effect on a particular disease, while the alternative hypothesis is that it does have an effect. The choice of statistical test depends on the type of data and the research question. Understanding the limitations of hypothesis testing, such as type I and type II errors, is crucial for interpreting results correctly. A type I error is rejecting the null hypothesis when it’s true, while a type II error is failing to reject the null hypothesis when it’s false.
Q 21. How would you identify and address bias in data?
Bias in data can significantly distort analysis and lead to erroneous conclusions. Identifying and addressing bias requires a critical and systematic approach. Common sources of bias include sampling bias (when the sample doesn’t accurately represent the population), measurement bias (errors in data collection or measurement), and reporting bias (selective reporting of results). Detection involves careful examination of data collection methods, exploring potential sources of bias, and visualizing data to identify unusual patterns or outliers that might suggest bias.
Addressing bias depends on the type and source of the bias. Techniques might include adjusting for confounding variables (using statistical methods to account for the influence of other factors), using more representative sampling methods, employing rigorous data collection protocols, and incorporating multiple data sources to triangulate results. For example, if I found a gender bias in a salary dataset, I would investigate the data collection process, potentially analyze additional factors like experience and education, and employ statistical techniques like regression analysis to adjust for potential confounding variables to arrive at a more fair and accurate conclusion. Transparency and careful documentation of bias detection and mitigation strategies are vital for the credibility of any analysis.
Q 22. What are some common ethical considerations in data analysis?
Ethical considerations in data analysis are paramount. They ensure fairness, transparency, and responsible use of data, preventing potential harm. Key areas include:
- Data Privacy: Protecting sensitive personal information according to regulations like GDPR and CCPA. This involves anonymization, pseudonymization, and secure data storage. For example, I would never use personally identifiable information without explicit consent or a legitimate business need, and I’d always implement robust security measures.
- Bias and Fairness: Algorithms and data can reflect existing societal biases, leading to unfair or discriminatory outcomes. Careful data cleaning, model selection, and ongoing monitoring are essential to mitigate this. For example, if I’m building a loan application scoring model, I’d rigorously check for biases based on race, gender, or zip code to ensure equitable access to credit.
- Transparency and Explainability: Users should understand how data is collected, used, and analyzed. Explainable AI (XAI) techniques help make models more transparent and accountable. For instance, if I’m presenting findings to stakeholders, I make sure to clearly explain the methodology and any limitations of the analysis.
- Data Security: Protecting data from unauthorized access, use, disclosure, disruption, modification, or destruction. Strong passwords, encryption, access controls, and regular security audits are crucial. I always adhere to best practices for data security and follow company policies.
- Data Integrity: Ensuring data accuracy, completeness, and consistency. This involves careful data validation, cleaning, and error handling. I’ve experienced situations where inaccurate data led to flawed conclusions. Hence, I always prioritize data quality checks.
Q 23. Describe your experience with cloud computing platforms (e.g., AWS, Azure, GCP).
I have extensive experience with cloud computing platforms, primarily AWS and Azure. On AWS, I’ve worked extensively with S3 for data storage, EC2 for computation, and EMR for large-scale data processing using Spark. I’m proficient in utilizing AWS Lambda for serverless functions and have experience with RDS for relational database management. In Azure, my work has focused on Azure Blob Storage, Azure Databricks for big data analytics, and Azure SQL Database for relational data. I understand the benefits of each platform and can adapt my approach based on the specific project requirements.
For example, in a recent project, we migrated a large on-premise data warehouse to AWS. We used a combination of S3 for data storage, EMR for ETL processing, and Redshift for the data warehouse itself. This involved careful planning, data migration strategies, and performance optimization to ensure a seamless transition with minimal downtime. In another project using Azure, I leveraged Azure Databricks to build and deploy a machine learning model for fraud detection, benefiting from its scalability and integration with other Azure services.
Q 24. Explain your experience with different types of databases (e.g., relational, NoSQL).
My experience encompasses both relational and NoSQL databases. Relational databases, like MySQL, PostgreSQL, and SQL Server, are structured, using tables with rows and columns, and are excellent for managing structured data with well-defined schemas. I’m proficient in SQL and can write complex queries for data retrieval and manipulation. NoSQL databases, such as MongoDB, Cassandra, and Redis, are more flexible and handle unstructured or semi-structured data effectively, scaling better for large volumes of data. I’ve used MongoDB for document storage and Redis for caching in various projects.
For instance, in one project, we used a relational database to store customer information with well-defined attributes. This allowed for easy data retrieval and updates using SQL. In another project, we used MongoDB to store social media posts, which have a less structured format, and this proved highly effective in handling the variety and volume of data.
Q 25. How do you prioritize tasks when working on multiple projects?
Prioritizing tasks across multiple projects requires a structured approach. I typically use a combination of methods including:
- Project Prioritization Matrix: I assess each project’s importance and urgency, using a matrix that categorizes tasks as high-impact/urgent, high-impact/not urgent, low-impact/urgent, and low-impact/not urgent. This helps focus on the most critical tasks first.
- Time Blocking: I allocate specific time blocks to work on individual projects, preventing context switching and improving focus. This is particularly useful for managing tasks with tight deadlines.
- Agile Methodologies: I find Agile frameworks like Scrum highly effective for managing multiple projects concurrently. The iterative approach allows for flexibility and prioritization based on changing needs and feedback.
- Communication and Collaboration: Regular communication with stakeholders is crucial to keep projects aligned and manage priorities effectively.
For example, if I’m working on a high-priority project with an impending deadline alongside a longer-term project, I’ll allocate more time to the high-priority one during critical phases. I also communicate these priorities to stakeholders to ensure everyone is aligned and expectations are managed.
Q 26. Describe your approach to risk management in a technical project.
My approach to risk management in technical projects involves proactive identification, assessment, and mitigation of potential issues. I typically follow these steps:
- Risk Identification: This involves brainstorming potential problems that could impact the project’s success, considering technical, operational, and business risks. This often involves using checklists, SWOT analysis, or reviewing past project experiences.
- Risk Assessment: Evaluating the likelihood and impact of each identified risk. This helps prioritize risks based on their severity.
- Risk Mitigation: Developing strategies to reduce the likelihood or impact of each risk. This can include implementing contingency plans, using robust technology, or incorporating redundancy.
- Risk Monitoring and Control: Regularly monitoring the identified risks and tracking the effectiveness of the mitigation strategies. This ensures proactive adjustments as the project progresses.
For example, in a recent project, we identified the risk of data loss. To mitigate this, we implemented a robust backup and recovery system, using multiple backups across different locations. We also conducted regular data integrity checks and implemented strict access control measures.
Q 27. How do you handle pressure and deadlines?
Handling pressure and deadlines effectively involves a combination of planning, organization, and stress management techniques. I prioritize tasks based on urgency and importance, breaking down large tasks into smaller, manageable chunks. I also utilize time management techniques like time blocking and the Pomodoro Technique to maintain focus and avoid burnout. Open communication with my team and stakeholders is essential to keep everyone informed and manage expectations effectively.
When facing intense pressure, I focus on deep breathing exercises and mindfulness techniques to stay calm and clear-headed. I also believe in seeking support from colleagues or mentors when needed, fostering a collaborative environment where we can support each other during challenging times. Prioritizing self-care, including sufficient rest and breaks, is crucial to maintain both productivity and well-being.
Q 28. What are your long-term career goals in this field?
My long-term career goals involve becoming a recognized expert in the field of data science, specializing in advanced analytics and machine learning. I aim to contribute to the development and application of innovative solutions that solve complex real-world problems using data-driven insights. This includes staying current with the latest advancements in the field, pursuing advanced certifications, and potentially contributing to open-source projects or academic research. I also aspire to lead and mentor teams of data scientists, fostering a culture of collaboration and innovation.
Ultimately, I strive to make a significant impact in industries that benefit from data-driven decision making, contributing to solutions in areas such as healthcare, finance, or environmental sustainability.
Key Topics to Learn for Analytical and Technical Aptitude Interview
- Logical Reasoning: Understanding deductive, inductive, and abductive reasoning; applying these to solve complex problems and draw insightful conclusions. Practical application: Analyzing data sets to identify trends and patterns.
- Data Interpretation: Extracting meaningful information from various data formats (tables, charts, graphs); identifying key insights and making informed decisions. Practical application: Presenting data-driven recommendations to stakeholders.
- Problem-Solving Techniques: Mastering systematic approaches like root cause analysis, breaking down complex problems into smaller, manageable parts, and evaluating potential solutions. Practical application: Developing efficient algorithms or troubleshooting technical issues.
- Quantitative Analysis: Demonstrating proficiency in mathematical concepts and their application to real-world scenarios. Practical application: Building financial models or conducting statistical analysis.
- Technical Proficiency (Specific to Role): This will vary greatly depending on the specific job, but generally involves demonstrating understanding of relevant programming languages, tools, and technologies. Practical application: Coding challenges, algorithm design, or system architecture discussions.
- Algorithmic Thinking: Designing efficient and optimized algorithms to solve problems; understanding time and space complexity. Practical application: Developing solutions for large-scale data processing or improving application performance.
- Data Structures and Algorithms (DSA): Understanding fundamental data structures (arrays, linked lists, trees, graphs) and algorithms (searching, sorting, graph traversal) and their applications. Practical application: Optimizing code for speed and efficiency.
Next Steps
Mastering analytical and technical aptitude is crucial for career advancement in today’s data-driven world. These skills are highly valued across various industries, opening doors to exciting opportunities and higher earning potential. To maximize your chances of landing your dream job, it’s essential to present your skills effectively through a well-crafted, ATS-friendly resume. ResumeGemini is a trusted resource that can help you build a professional and impactful resume, showcasing your analytical and technical strengths to recruiters. Examples of resumes tailored to Analytical and Technical Aptitude roles are available within ResumeGemini to help guide you.
Explore more articles
Users Rating of Our Blogs
Share Your Experience
We value your feedback! Please rate our content and share your thoughts (optional).
What Readers Say About Our Blog
Hello,
We found issues with your domain’s email setup that may be sending your messages to spam or blocking them completely. InboxShield Mini shows you how to fix it in minutes — no tech skills required.
Scan your domain now for details: https://inboxshield-mini.com/
— Adam @ InboxShield Mini
Reply STOP to unsubscribe
Hi, are you owner of interviewgemini.com? What if I told you I could help you find extra time in your schedule, reconnect with leads you didn’t even realize you missed, and bring in more “I want to work with you” conversations, without increasing your ad spend or hiring a full-time employee?
All with a flexible, budget-friendly service that could easily pay for itself. Sounds good?
Would it be nice to jump on a quick 10-minute call so I can show you exactly how we make this work?
Best,
Hapei
Marketing Director
Hey, I know you’re the owner of interviewgemini.com. I’ll be quick.
Fundraising for your business is tough and time-consuming. We make it easier by guaranteeing two private investor meetings each month, for six months. No demos, no pitch events – just direct introductions to active investors matched to your startup.
If youR17;re raising, this could help you build real momentum. Want me to send more info?
Hi, I represent an SEO company that specialises in getting you AI citations and higher rankings on Google. I’d like to offer you a 100% free SEO audit for your website. Would you be interested?
Hi, I represent an SEO company that specialises in getting you AI citations and higher rankings on Google. I’d like to offer you a 100% free SEO audit for your website. Would you be interested?
good


