Every successful interview starts with knowing what to expect. In this blog, we’ll take you through the top Biomedical Research Methods interview questions, breaking them down with expert tips to help you deliver impactful answers. Step into your next interview fully prepared and ready to succeed.
Questions Asked in Biomedical Research Methods Interview
Q 1. Explain the difference between a retrospective and prospective study design.
The key difference between retrospective and prospective study designs lies in the direction of time. A retrospective study, also known as a case-control study, examines existing data from the past to identify risk factors or outcomes. Imagine a researcher studying the link between smoking and lung cancer; they would look back at the medical records of individuals with lung cancer (cases) and compare them to a group without lung cancer (controls) to see if there’s a higher prevalence of smoking in the case group. In contrast, a prospective study, often a cohort study, follows a group of individuals over time to observe the occurrence of a particular outcome. For example, researchers might follow a cohort of smokers and non-smokers for 20 years to see who develops lung cancer and to analyze the incidence rate among each group. Retrospective studies are faster and cheaper, but they’re susceptible to recall bias (inaccurate memories) and limitations in data quality. Prospective studies are more expensive and time-consuming, but offer stronger evidence of causality as they directly observe the progression of events.
Q 2. Describe the strengths and weaknesses of randomized controlled trials.
Randomized controlled trials (RCTs) are considered the gold standard in biomedical research because they minimize bias and strengthen causal inference. Strengths include the random assignment of participants to treatment and control groups, which balances known and unknown confounding factors. This reduces selection bias, allowing researchers to confidently attribute observed differences to the intervention. Blinding (masking the treatment assignment from participants and researchers) further reduces bias, such as placebo effects. The rigorous design allows for robust statistical analysis, enabling researchers to estimate treatment effects with precision.
However, RCTs also have weaknesses. They can be expensive and time-consuming, requiring substantial resources and participant recruitment. They may not be feasible for all research questions, especially those involving rare diseases or long latency periods. Strict inclusion/exclusion criteria can limit generalizability of the findings to the broader population. Lastly, ethical concerns may arise if a potentially beneficial treatment is withheld from the control group.
Q 3. What are the ethical considerations in conducting biomedical research?
Ethical considerations are paramount in biomedical research. They revolve around the principles of beneficence (maximizing benefits and minimizing harms), respect for persons (autonomy and informed consent), and justice (fair distribution of benefits and burdens). Key ethical issues include:
- Informed consent: Participants must be fully informed about the study’s purpose, procedures, risks, and benefits before agreeing to participate.
- Confidentiality and privacy: Protecting participant data and ensuring anonymity is crucial.
- Vulnerable populations: Special considerations are needed for individuals with cognitive impairments, children, or those in vulnerable social situations.
- Data integrity and research misconduct: Researchers have a responsibility to maintain data integrity, avoid fabrication or falsification, and adhere to research ethics guidelines.
- Animal welfare: When using animals in research, humane treatment and adherence to relevant guidelines are essential.
Institutional Review Boards (IRBs) play a vital role in overseeing research ethics and ensuring that studies are conducted ethically.
Q 4. How do you determine the appropriate sample size for a study?
Determining the appropriate sample size is crucial for achieving statistically significant results and avoiding both type I (false positive) and type II (false negative) errors. Several factors influence sample size calculation:
- The desired level of statistical power (1-β): This reflects the probability of detecting a true effect if it exists (typically 80% or higher).
- The significance level (α): The probability of rejecting the null hypothesis when it is true (typically 0.05).
- The effect size: The magnitude of the difference or relationship being studied.
- The variability in the data: Measured by the standard deviation.
Power analysis software or statistical formulas are commonly used to calculate the required sample size. For example, G*Power is a widely used free software that can help with this calculation. Incorrect sample size calculation can lead to inconclusive results or wasted resources, highlighting the importance of careful planning.
Q 5. Explain the concept of statistical significance and its importance in research.
Statistical significance refers to the probability of observing the obtained results (or more extreme results) if there were no real effect (null hypothesis). It’s typically expressed as a p-value. A p-value less than a pre-determined significance level (e.g., 0.05) indicates that the results are unlikely to have occurred by chance alone, and thus, the null hypothesis is rejected. Importance: Statistical significance helps to determine whether observed results are likely due to a genuine effect or merely random variation. However, it’s important to remember that statistical significance does not necessarily imply clinical or practical significance. A statistically significant finding might be too small to be meaningful in a real-world setting. Considering both statistical and clinical significance is essential for sound interpretation.
Q 6. What are the different types of bias that can affect research results?
Various biases can affect research results, leading to inaccurate conclusions. Some common types include:
- Selection bias: Systematic error in the selection of participants, leading to a non-representative sample.
- Measurement bias: Inconsistent or inaccurate measurement of variables.
- Recall bias: Differences in accuracy of recall of past events between study groups.
- Observer bias: The observer’s expectations influencing their observations.
- Publication bias: The tendency for studies with positive results to be published more often than those with negative results.
- Confounding bias: A third variable distorts the association between the exposure and outcome of interest.
Understanding these biases is crucial for critically evaluating research findings and designing studies that minimize their impact. This often involves careful study design, rigorous data collection methods, and appropriate statistical analysis.
Q 7. How do you control for confounding variables in a study?
Confounding variables are extraneous factors that influence both the exposure and the outcome, creating a spurious association. Controlling for confounding variables is critical for drawing valid causal inferences. Several methods can be employed:
- Randomization: Randomly assigning participants to treatment groups helps to balance confounders across groups in RCTs.
- Restriction: Restricting the study population to individuals with similar characteristics on the confounder(s).
- Matching: Matching participants in the exposure and comparison groups on potential confounders.
- Stratification: Analyzing the data separately for different levels of the confounder.
- Statistical adjustment: Using multivariate statistical techniques such as regression analysis to adjust for confounders.
The choice of method depends on the specific study design and the nature of the confounders. A combination of methods is often used to effectively control for confounding and strengthen causal inference.
Q 8. Describe your experience with different statistical software packages (e.g., R, SAS, SPSS).
My experience with statistical software packages is extensive. I’m highly proficient in R, a powerful and flexible language ideal for complex statistical analyses and data visualization. I regularly use R for everything from basic descriptive statistics to advanced modeling techniques like linear mixed-effects models and survival analysis. For instance, I recently used R’s ggplot2 package to create publication-quality figures illustrating the relationship between gene expression and patient survival. I’m also proficient in SAS, known for its strength in handling large datasets and its robust procedures for clinical trials analysis. I’ve used SAS extensively in analyzing data from randomized controlled trials, leveraging its PROC MIXED procedure for analyzing repeated measures data. Finally, I have experience with SPSS, particularly for its user-friendly interface and its ease of use for conducting basic statistical tests and creating descriptive statistics. I find each package has its strengths, and I choose the most appropriate tool depending on the specific project requirements and dataset characteristics.
Q 9. Explain the process of data cleaning and preprocessing.
Data cleaning and preprocessing are critical steps before any meaningful analysis can be performed. Think of it as preparing ingredients before cooking a gourmet meal – you wouldn’t start cooking without washing and chopping your vegetables! This process involves several key stages. First, data inspection involves identifying errors, inconsistencies, and outliers. This often involves generating summary statistics, histograms, and box plots to visualize the data and look for anomalies. Next, data cleaning addresses these issues: correcting typos, handling missing values (discussed in the next question), removing duplicates, and transforming variables as needed. For example, I might recode categorical variables into numerical representations suitable for statistical modeling. Finally, data transformation might involve standardizing or normalizing variables to improve the performance of certain statistical models, such as those sensitive to scale differences. For example, I might transform skewed data using logarithmic transformations to achieve normality. A clean, preprocessed dataset ensures the reliability and validity of subsequent analyses.
Q 10. How do you handle missing data in a dataset?
Missing data is a common challenge in biomedical research. The best approach depends on the pattern and extent of missing data, and the nature of the variables involved. Simple methods include listwise deletion (removing any observations with missing data), which is easy to implement but can lead to a significant loss of information and bias, especially if data is not missing completely at random (MCAR). More sophisticated methods include imputation, where missing values are replaced with estimated values. Common imputation techniques include mean imputation (replacing with the average value), regression imputation (predicting missing values based on other variables), and multiple imputation (creating multiple plausible datasets with imputed values and combining results). The choice of method depends on the type of missing data and the research question. For example, if missingness is likely related to the outcome variable, multiple imputation is a preferable method to reduce bias. I always carefully consider the potential biases introduced by different missing data handling techniques and justify my chosen method based on the characteristics of the data and the goals of the study.
Q 11. What are the different types of validity in research?
Validity refers to how accurately a study measures what it intends to measure. There are several types: Content validity assesses whether the instrument covers the full range of the concept being measured. For example, a depression questionnaire should cover the full spectrum of depressive symptoms. Criterion validity evaluates the relationship between the measure and an external criterion; for example, a new blood pressure monitor should correlate highly with established, reliable blood pressure readings. Construct validity examines whether the measure accurately reflects the underlying theoretical construct. This is often assessed using confirmatory factor analysis. For example, a scale measuring self-esteem should demonstrate a strong association with measures of self-confidence and self-worth, but not with measures of aggressiveness. Ensuring validity is paramount in producing credible and trustworthy research findings.
Q 12. Explain the concept of reliability in research.
Reliability refers to the consistency and stability of a measure. A reliable measure will produce similar results under consistent conditions. We assess reliability using several methods. Test-retest reliability assesses the consistency of results over time. Inter-rater reliability examines the agreement between different raters or observers. Internal consistency reliability (e.g., Cronbach’s alpha) measures the consistency of items within a scale or instrument. For example, a reliable questionnaire measuring anxiety should yield similar scores if administered to the same person on different occasions (test-retest) and if scored by multiple independent researchers (inter-rater). High reliability is crucial; if a measure is not reliable, it cannot be valid. Think of it like a scale: if the scale consistently gives different readings for the same weight, we can’t trust its accuracy (validity).
Q 13. Describe your experience with different research methodologies (e.g., qualitative, quantitative, mixed methods).
I have substantial experience with various research methodologies. My quantitative experience includes designing and conducting randomized controlled trials, cohort studies, and cross-sectional studies, utilizing statistical methods to analyze numerical data. I frequently employ regression analysis, ANOVA, and other statistical techniques to test hypotheses and quantify relationships between variables. My qualitative experience involves conducting in-depth interviews and thematic analysis to understand the lived experiences and perspectives of participants. For instance, I recently conducted qualitative interviews with patients to explore their experiences with a new treatment, providing a richer understanding of the treatment’s impact beyond just numerical outcomes. I also have experience with mixed methods designs, combining quantitative and qualitative approaches to gain a more comprehensive understanding of a research problem. Using mixed methods allows for triangulation of findings, strengthening the robustness of research conclusions.
Q 14. How do you interpret p-values and confidence intervals?
P-values and confidence intervals are crucial for interpreting statistical results. The p-value represents the probability of observing the obtained results (or more extreme results) if there were no effect (null hypothesis is true). A small p-value (typically less than 0.05) suggests strong evidence against the null hypothesis, suggesting statistical significance. However, it does not indicate the magnitude or practical significance of the effect. Confidence intervals provide a range of plausible values for a population parameter (e.g., mean difference, effect size). For example, a 95% confidence interval means that if the study were repeated many times, 95% of the resulting confidence intervals would contain the true population parameter. A narrower confidence interval indicates greater precision in the estimate. I always interpret p-values in conjunction with confidence intervals and effect sizes to gain a complete understanding of the results. Focusing solely on p-values can be misleading, particularly with small sample sizes or large effects.
Q 15. Explain the difference between correlation and causation.
Correlation and causation are two distinct concepts in research. Correlation simply refers to a statistical relationship between two or more variables – when one changes, the other tends to change as well. This relationship can be positive (both variables increase together), negative (one increases while the other decreases), or zero (no relationship). Causation, however, implies a cause-and-effect relationship; one variable directly influences or causes a change in another.
Think of it this way: ice cream sales and drowning incidents are often positively correlated – both increase during summer. However, this correlation doesn’t mean that buying ice cream *causes* drowning. The underlying cause is the hot weather, which drives both ice cream consumption and swimming activities, leading to a higher incidence of drowning.
In biomedical research, establishing causation is crucial. We need rigorous study designs, like randomized controlled trials (RCTs), to demonstrate that an intervention (e.g., a new drug) directly impacts an outcome (e.g., disease remission). Observational studies, while useful for identifying correlations, are limited in their ability to prove causation due to the potential for confounding variables.
Career Expert Tips:
- Ace those interviews! Prepare effectively by reviewing the Top 50 Most Common Interview Questions on ResumeGemini.
- Navigate your job search with confidence! Explore a wide range of Career Tips on ResumeGemini. Learn about common challenges and recommendations to overcome them.
- Craft the perfect resume! Master the Art of Resume Writing with ResumeGemini’s guide. Showcase your unique qualifications and achievements effectively.
- Don’t miss out on holiday savings! Build your dream resume with ResumeGemini’s ATS optimized templates.
Q 16. What are the key elements of a well-written research proposal?
A well-written research proposal is the blueprint for a successful study. It needs to clearly articulate the research question, methodology, and expected outcomes. Key elements include:
- Introduction: This section sets the stage, introducing the research problem, its significance, and a concise literature review highlighting gaps in knowledge.
- Research Question/Hypothesis: A clear and focused statement outlining what the study aims to investigate. The hypothesis should be testable and falsifiable.
- Methodology: A detailed description of the study design (e.g., RCT, cohort study, case-control study), participant selection criteria, data collection methods, and statistical analysis plan.
- Timeline and Resources: A realistic schedule for completion and a budget outlining the necessary resources (personnel, equipment, materials).
- Ethical Considerations: A comprehensive section outlining how the study will adhere to ethical guidelines, including informed consent, data privacy, and animal welfare (if applicable).
- Expected Outcomes and Dissemination Plan: A clear explanation of the expected results and how the findings will be shared (e.g., publication in peer-reviewed journals, presentations at conferences).
A strong proposal convinces reviewers of the study’s feasibility, rigor, and potential impact.
Q 17. Describe your experience with literature reviews.
I have extensive experience conducting comprehensive literature reviews. My approach is systematic and rigorous, ensuring that I capture the relevant and up-to-date evidence for my research. This involves:
- Defining Search Terms and Databases: I carefully select keywords and utilize multiple databases (PubMed, Web of Science, Scopus) to identify relevant articles.
- Screening and Selection: I systematically screen titles and abstracts, followed by a full-text review, to identify studies that meet pre-defined inclusion and exclusion criteria.
- Data Extraction: I meticulously extract key information from the selected studies, using standardized forms to maintain consistency.
- Quality Assessment: I assess the methodological quality of included studies using validated tools, such as the Cochrane risk-of-bias tool, to identify potential limitations.
- Synthesis and Interpretation: I synthesize the findings from the included studies, identifying patterns, trends, and areas of agreement or disagreement. I critically interpret the evidence in the context of the existing literature and any limitations of the included studies.
For example, in my recent work on the efficacy of a novel cancer therapy, I conducted a systematic review that involved screening over 500 articles, resulting in the inclusion of 25 high-quality studies that shaped my understanding of the therapy’s effectiveness and side effects.
Q 18. How do you manage and analyze large datasets?
Managing and analyzing large datasets requires proficiency in statistical software and computational techniques. I’m experienced in using tools such as R and Python with packages like pandas, numpy, and scikit-learn for data manipulation, cleaning, and analysis.
My approach typically involves:
- Data Cleaning and Preprocessing: Identifying and handling missing data, outliers, and inconsistencies using appropriate methods.
- Exploratory Data Analysis (EDA): Visualizing and summarizing the data to gain insights into its structure and characteristics. This often includes creating histograms, scatter plots, and box plots.
- Statistical Modeling: Applying appropriate statistical methods depending on the research question and data type. This could involve regression analysis, machine learning algorithms, or survival analysis.
- Data Visualization: Creating informative visualizations to communicate findings effectively.
For instance, I recently analyzed a large genomic dataset using R, applying principal component analysis (PCA) to reduce dimensionality and identify key patterns in gene expression associated with a particular disease. My experience encompasses working with both structured and unstructured data, adapting my strategies to the specific characteristics of each dataset.
Q 19. What are the common challenges in conducting biomedical research?
Biomedical research presents numerous challenges. Some common ones include:
- Funding Limitations: Securing adequate funding for research projects can be highly competitive and challenging.
- Data Availability and Quality: Obtaining access to high-quality, reliable data can be difficult, and data quality issues can compromise research validity.
- Ethical Considerations: Balancing the potential benefits of research with ethical considerations related to human and animal subjects is crucial and requires careful planning and oversight.
- Reproducibility and Replicability: Ensuring that research findings can be reliably reproduced by other researchers is a significant challenge, particularly with complex experiments and large datasets.
- Translation to Clinical Practice: Translating promising research findings into effective clinical interventions can take years and often faces significant hurdles.
Overcoming these challenges requires meticulous planning, collaboration, and adherence to rigorous scientific standards.
Q 20. How do you ensure the accuracy and integrity of research data?
Ensuring data accuracy and integrity is paramount in biomedical research. My approach relies on a multi-faceted strategy:
- Data Management Plan: Developing a comprehensive data management plan from the outset, detailing how data will be collected, stored, managed, and shared. This includes using version control systems for code and data.
- Data Validation and Cleaning: Implementing rigorous checks at each stage of data collection and processing to identify and correct errors or inconsistencies.
- Data Security and Privacy: Protecting sensitive data through secure storage and access control measures, complying with relevant regulations (e.g., HIPAA).
- Auditable Trails: Maintaining detailed records of all data processing steps to allow for verification and reproducibility.
- Collaboration and Peer Review: Working collaboratively with others, including seeking feedback from peers, to ensure data quality and validity.
For example, I always use appropriate statistical software to document all steps undertaken in the analysis, which is critical for reproducibility and transparency.
Q 21. Describe your experience with data visualization techniques.
Effective data visualization is essential for communicating research findings clearly and concisely. My experience encompasses a wide range of techniques, including:
- Scatter plots: Visualizing the relationship between two continuous variables.
- Histograms: Showing the distribution of a single continuous variable.
- Box plots: Comparing the distribution of a variable across different groups.
- Bar charts: Displaying the frequency or proportion of categorical data.
- Heatmaps: Representing correlations or other relationships between multiple variables.
- Interactive dashboards: Creating interactive visualizations for exploring large datasets and communicating complex relationships.
I choose the most appropriate visualization techniques based on the type of data and the message I want to convey. For instance, in a recent presentation, I used an interactive dashboard to illustrate the temporal trends of disease prevalence across different geographic regions, allowing the audience to explore the data dynamically.
Q 22. Explain your understanding of different experimental designs (e.g., crossover, parallel group).
Experimental designs are the blueprints for how we collect and analyze data in biomedical research. They dictate how participants are assigned to different groups and how measurements are taken. Two common designs are crossover and parallel group designs.
Parallel Group Design: In this design, participants are randomly assigned to different treatment groups (e.g., a drug group and a placebo group) and remain in that group throughout the study. Think of it like parallel tracks; each group follows its own path. This is simple to implement and analyze but may be less powerful if there’s substantial individual variation.
Example: A clinical trial comparing the effectiveness of two different blood pressure medications. Patients are randomly assigned to either medication A or medication B, and their blood pressure is monitored over time.
Crossover Design: Here, each participant receives all treatments over time. The order of treatments is randomized. Think of it like switching tracks during the study. This design is more efficient as each participant serves as their own control, reducing the impact of individual variations. However, it’s not suitable for all treatments, especially those with lasting effects.
Example: Investigating the effects of two different pain relief ointments. Patients use ointment A for a period, then switch to ointment B after a washout period (to eliminate lingering effects). Their pain levels are compared across both treatment periods.
Choosing between these designs depends on factors like the nature of the treatment, the duration of the study, and the resources available. Other designs include randomized controlled trials (RCTs), cohort studies, and case-control studies, each with its own strengths and weaknesses.
Q 23. What are the key considerations in selecting appropriate statistical tests?
Selecting the right statistical test is crucial for drawing valid conclusions. The choice depends on several key factors:
- Type of data: Is your data continuous (e.g., weight, blood pressure), categorical (e.g., gender, treatment group), or ordinal (e.g., pain scale)?
- Number of groups: Are you comparing two groups or more than two?
- Type of hypothesis: Are you testing for a difference between groups (e.g., is drug A better than drug B?) or an association between variables (e.g., is there a relationship between age and blood pressure)?
- Distribution of data: Is your data normally distributed (bell-shaped curve)? Non-parametric tests are used if data is not normally distributed.
- Sample size: Sufficient sample size is needed for accurate statistical power.
Example: If comparing the mean blood pressure between two groups with normally distributed data, an independent samples t-test would be appropriate. If comparing the proportions of patients experiencing side effects in two treatment groups, a chi-square test would be more suitable.
Incorrect test selection can lead to inaccurate conclusions. Consulting with a statistician is always recommended, especially for complex designs or analyses.
Q 24. How do you interpret results from different statistical tests?
Interpreting statistical test results involves understanding p-values, confidence intervals, and effect sizes. A p-value represents the probability of obtaining the observed results if there is no real effect (the null hypothesis is true). A commonly used threshold is p < 0.05, meaning there's less than a 5% chance the results are due to random chance. However, p-values alone are insufficient; they don't indicate the magnitude of the effect.
Confidence intervals provide a range of values within which the true population parameter (e.g., mean difference) likely lies. A narrower confidence interval indicates greater precision.
Effect size measures the magnitude of the effect. It’s important because a statistically significant result (small p-value) doesn’t always mean a clinically meaningful effect. A large effect size indicates a substantial difference, while a small effect size may be statistically significant but not practically important.
For example, a study might show a statistically significant difference in blood pressure between two drug groups (p < 0.05). However, the confidence interval might be wide, suggesting considerable uncertainty about the true difference, and the effect size might be small, indicating a clinically insignificant reduction in blood pressure.
Always consider the clinical context when interpreting results, combining statistical significance with practical relevance to determine the true meaning of findings.
Q 25. Describe your experience with grant writing or funding applications.
I have extensive experience in grant writing and funding applications, having successfully secured funding for several research projects from various sources, including the NIH and private foundations. My approach involves a thorough understanding of the funding agency’s priorities and a well-structured proposal that clearly articulates the research question, methodology, potential impact, and budget.
My grant writing process typically involves:
- Identifying funding opportunities: Thoroughly researching relevant funding calls and aligning my research interests with their priorities.
- Developing a strong research proposal: This includes a compelling narrative that highlights the significance of the research, innovative aspects, and potential societal impact. The methodology section is crucial and includes a detailed description of the experimental design, statistical analysis plan, and feasibility considerations.
- Budget justification: Creating a detailed and realistic budget that aligns with the project scope and demonstrates responsible resource management.
- Collaboration and feedback: Collaborating with colleagues and mentors to refine the proposal and obtain constructive feedback.
- Submission and follow-up: Submitting the application timely and professionally and following up with the funding agency as needed.
One success story involved securing a grant to investigate the role of inflammation in Alzheimer’s disease. The funding allowed us to purchase advanced imaging equipment and hire research personnel, leading to significant advancements in our understanding of the disease.
Q 26. Explain your understanding of regulatory guidelines for biomedical research (e.g., ICH-GCP).
Regulatory guidelines for biomedical research are crucial to ensure ethical conduct, data integrity, and patient safety. ICH-GCP (International Council for Harmonisation – Good Clinical Practice) provides a standardized framework for conducting clinical trials, encompassing ethical considerations, data management, and quality assurance. Key aspects include informed consent, monitoring of trial conduct, data integrity, and reporting of adverse events.
Other crucial regulations include those related to:
- Institutional Review Boards (IRBs): IRBs review research protocols to ensure ethical treatment of human subjects.
- Data Privacy and Security: Regulations like HIPAA (Health Insurance Portability and Accountability Act) in the US protect patient privacy and confidentiality.
- Animal Welfare: Regulations governing the use of animals in research emphasize humane treatment and minimization of animal suffering.
- Intellectual Property: Protecting intellectual property rights, such as patents and copyrights related to research discoveries.
Adherence to these guidelines is paramount. Failure to comply can result in serious consequences, including publication retractions, loss of funding, and legal repercussions.
Q 27. How do you stay current with the latest advancements in biomedical research methods?
Staying current in biomedical research methods requires a multi-faceted approach:
- Regularly reading scientific literature: I subscribe to leading journals in my field and regularly scan relevant databases (e.g., PubMed) for the latest publications.
- Attending conferences and workshops: Conferences offer opportunities to learn about cutting-edge research methods and network with other researchers.
- Participating in online courses and webinars: Numerous online platforms provide training in advanced statistical methods, experimental designs, and data analysis techniques.
- Mentorship and collaboration: Learning from experienced researchers through collaborations and mentorship.
- Following key researchers and institutions: Staying updated on the work of leading researchers and institutions in my field.
Staying abreast of new developments ensures my research stays at the forefront of innovation and allows me to adopt the most appropriate and efficient methods.
Key Topics to Learn for Biomedical Research Methods Interview
- Experimental Design: Understanding different study designs (e.g., randomized controlled trials, cohort studies, case-control studies), their strengths, weaknesses, and appropriate applications in biomedical research. Consider the ethical implications of each design.
- Data Analysis & Statistics: Proficiency in descriptive and inferential statistics, including hypothesis testing, regression analysis, and appropriate statistical software (e.g., R, SPSS, SAS). Be prepared to discuss your experience with data visualization and interpretation.
- Bioinformatics & Data Management: Knowledge of databases, data mining techniques, and the handling of large datasets common in genomics, proteomics, and other “-omics” fields. Demonstrate understanding of data quality control and validation.
- Research Ethics & Integrity: A thorough understanding of ethical considerations in research, including informed consent, data privacy, and plagiarism. Be prepared to discuss relevant regulations and guidelines (e.g., IRB protocols).
- Literature Review & Critical Appraisal: Ability to critically evaluate scientific literature, identify biases, and synthesize information from multiple sources. Practice summarizing complex research findings concisely and accurately.
- Scientific Writing & Communication: Experience in writing scientific reports, grant proposals, or manuscripts. Be ready to discuss your ability to communicate complex scientific concepts clearly and effectively to both scientific and non-scientific audiences.
- Specific Methodologies: Depending on your area of expertise, be prepared to discuss specific research methods in detail. This could include techniques like PCR, ELISA, microscopy, cell culture, animal models, etc.
Next Steps
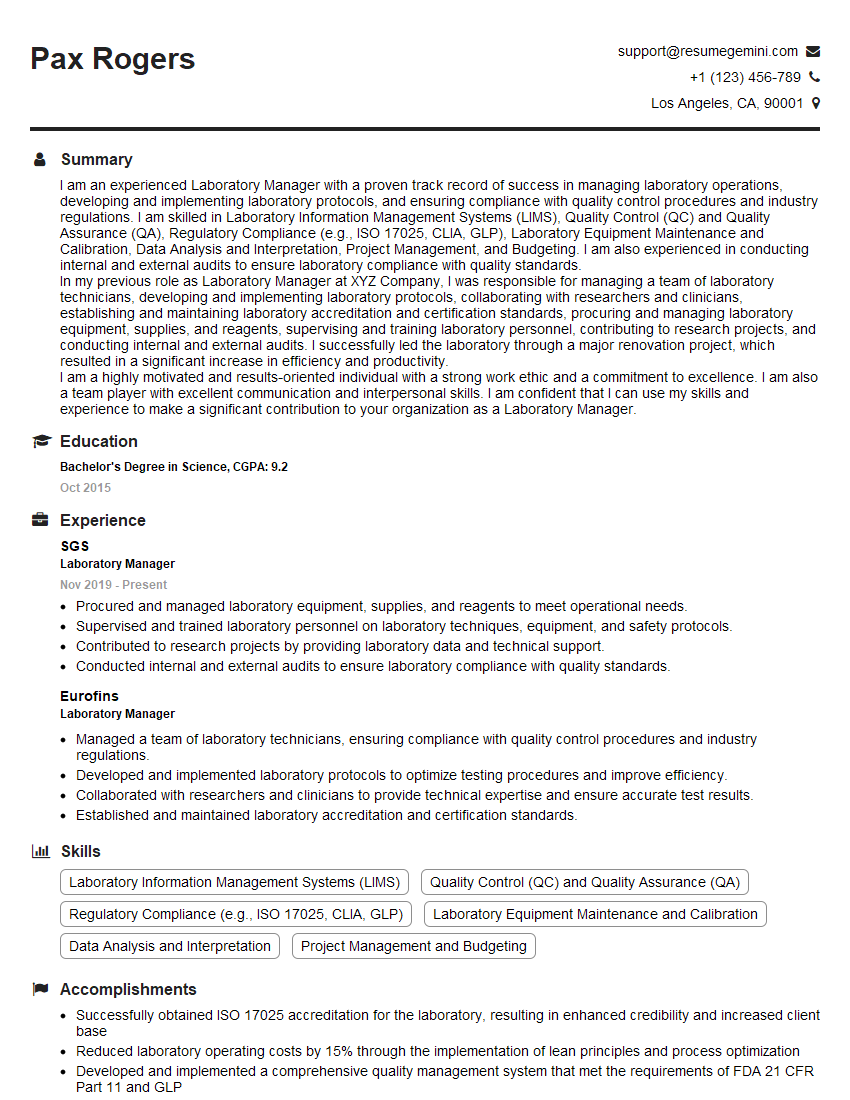
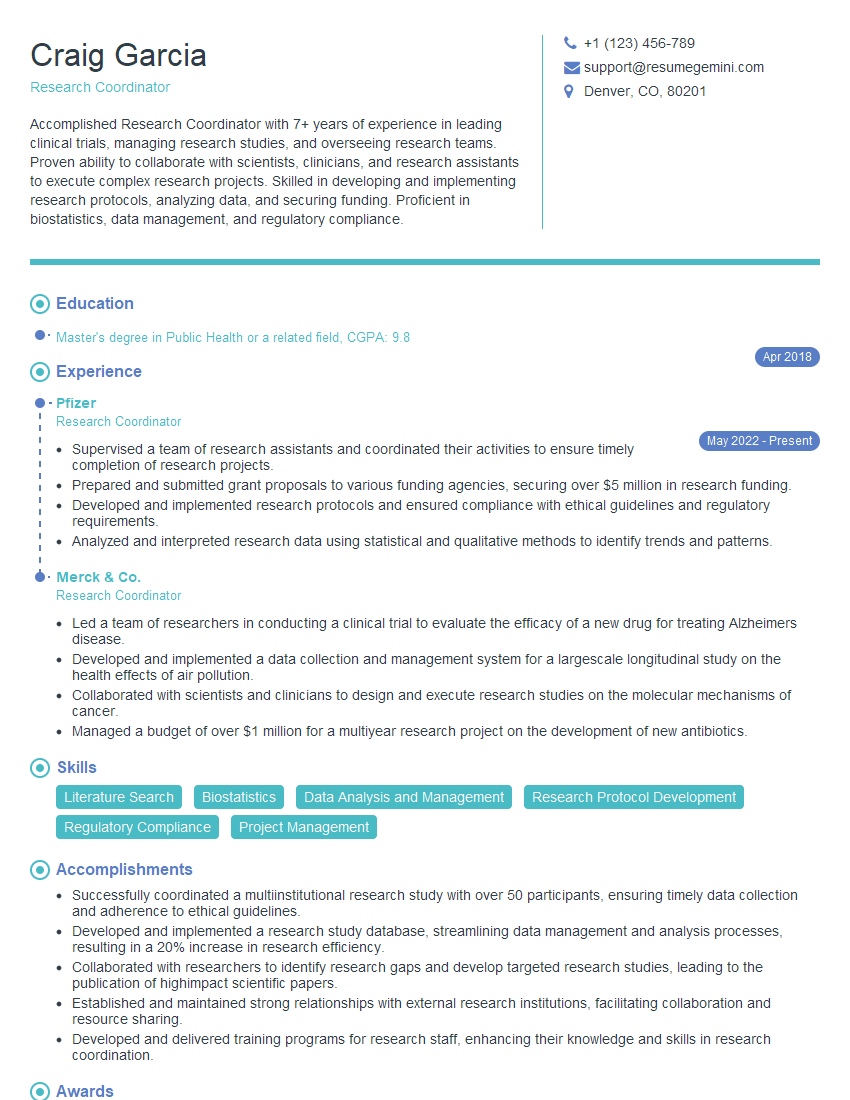
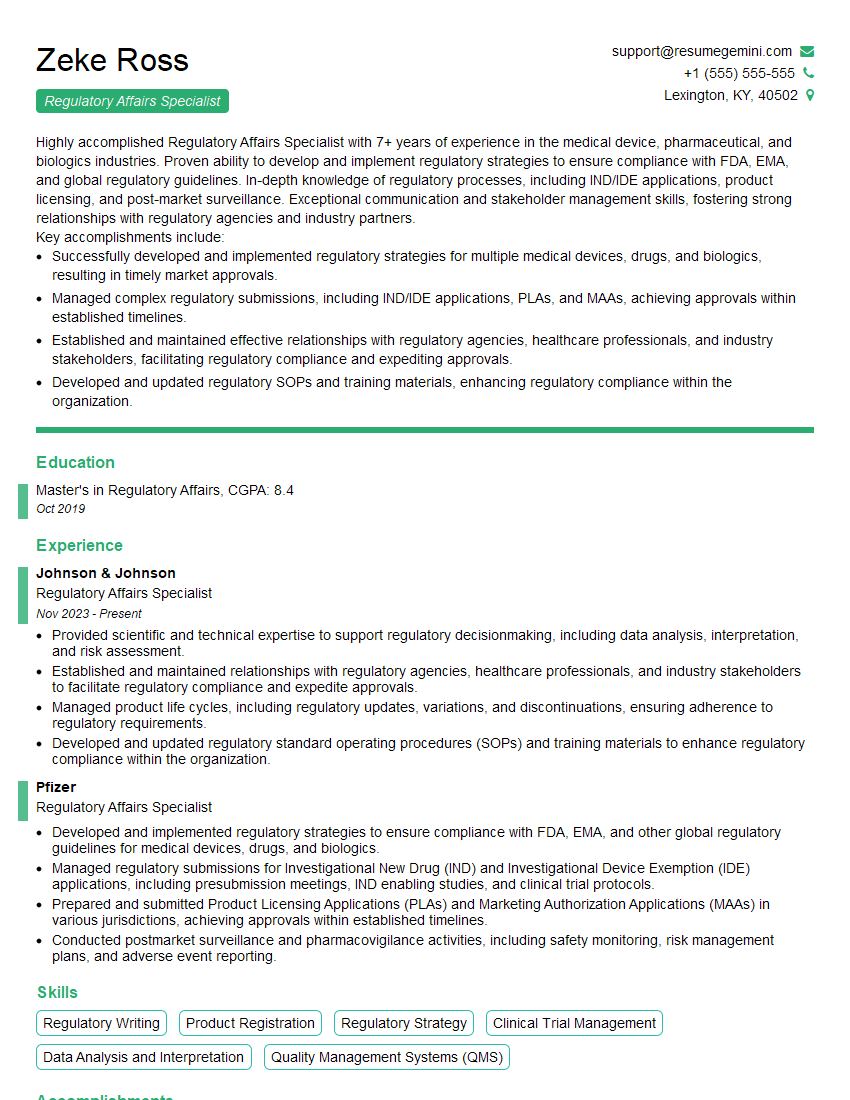
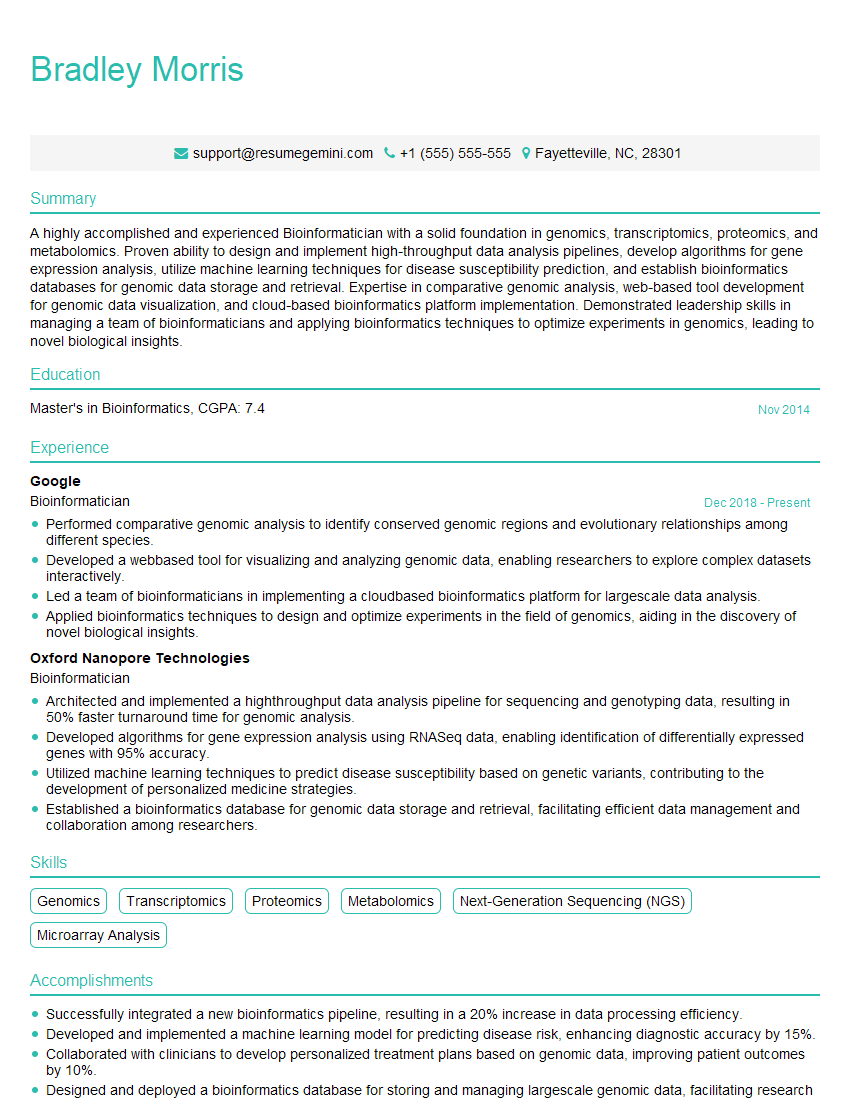
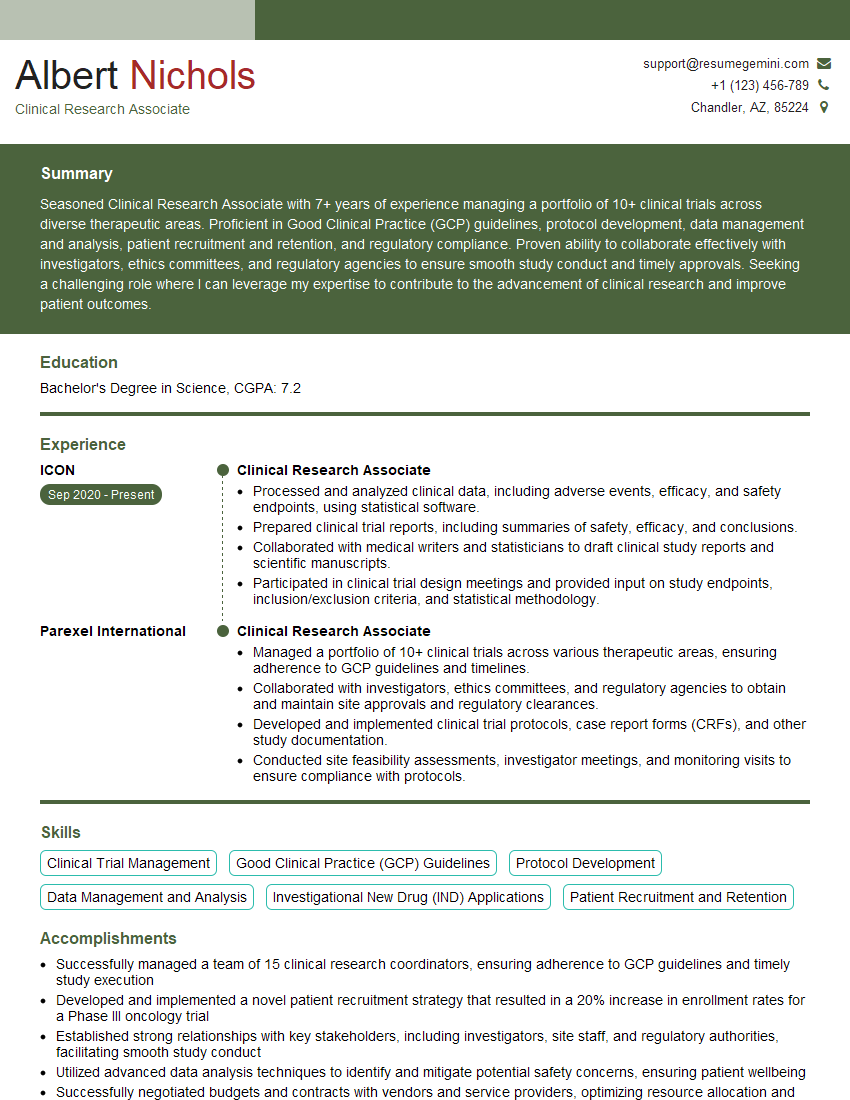
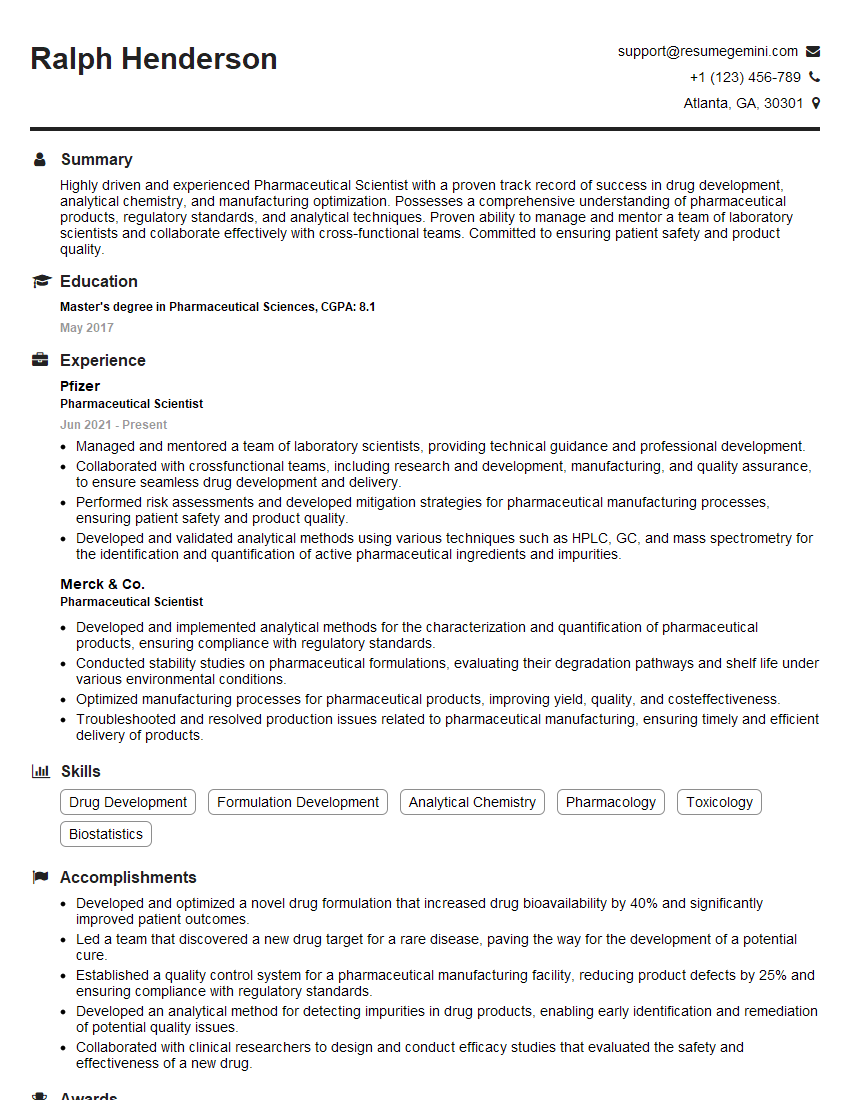
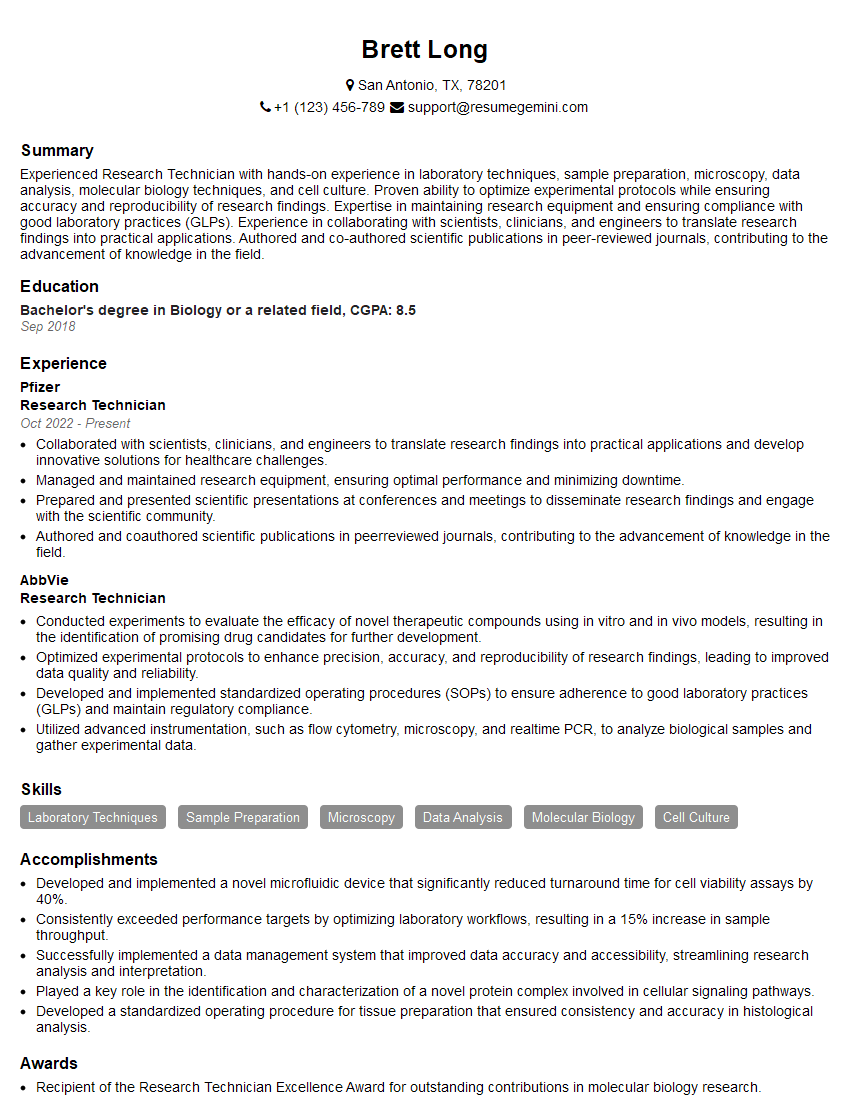
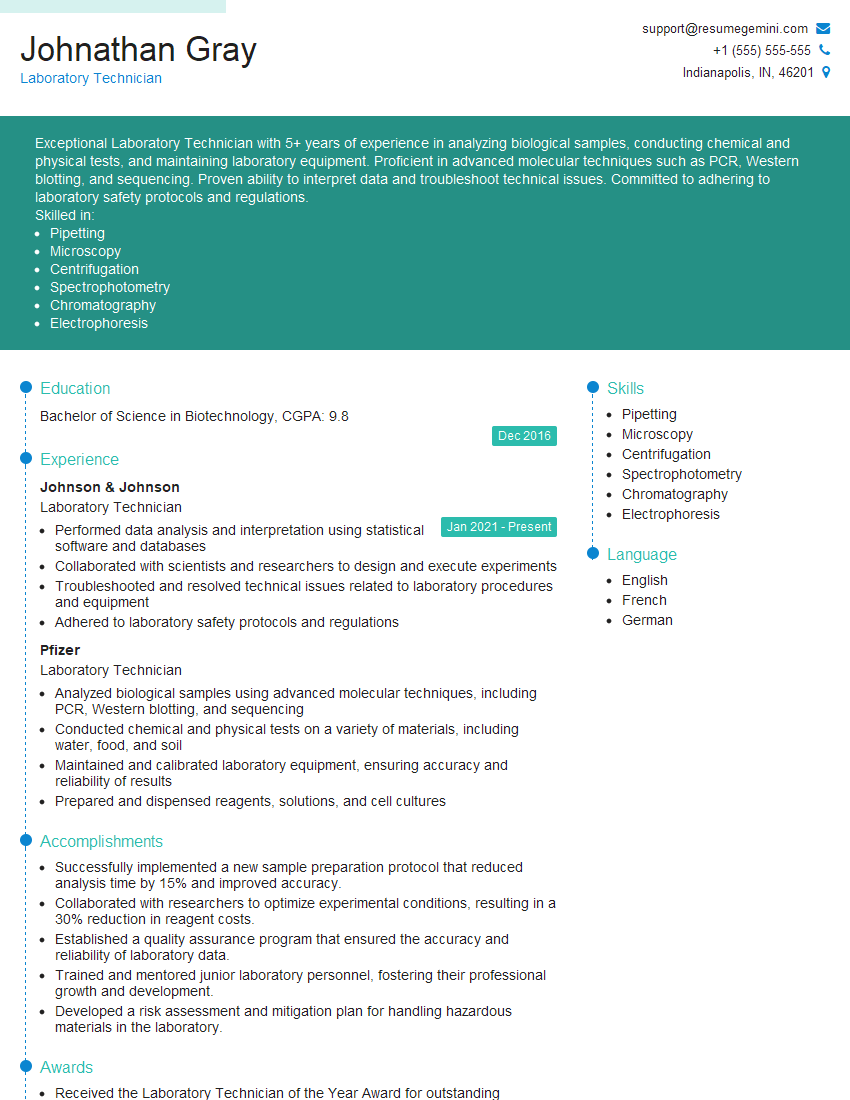
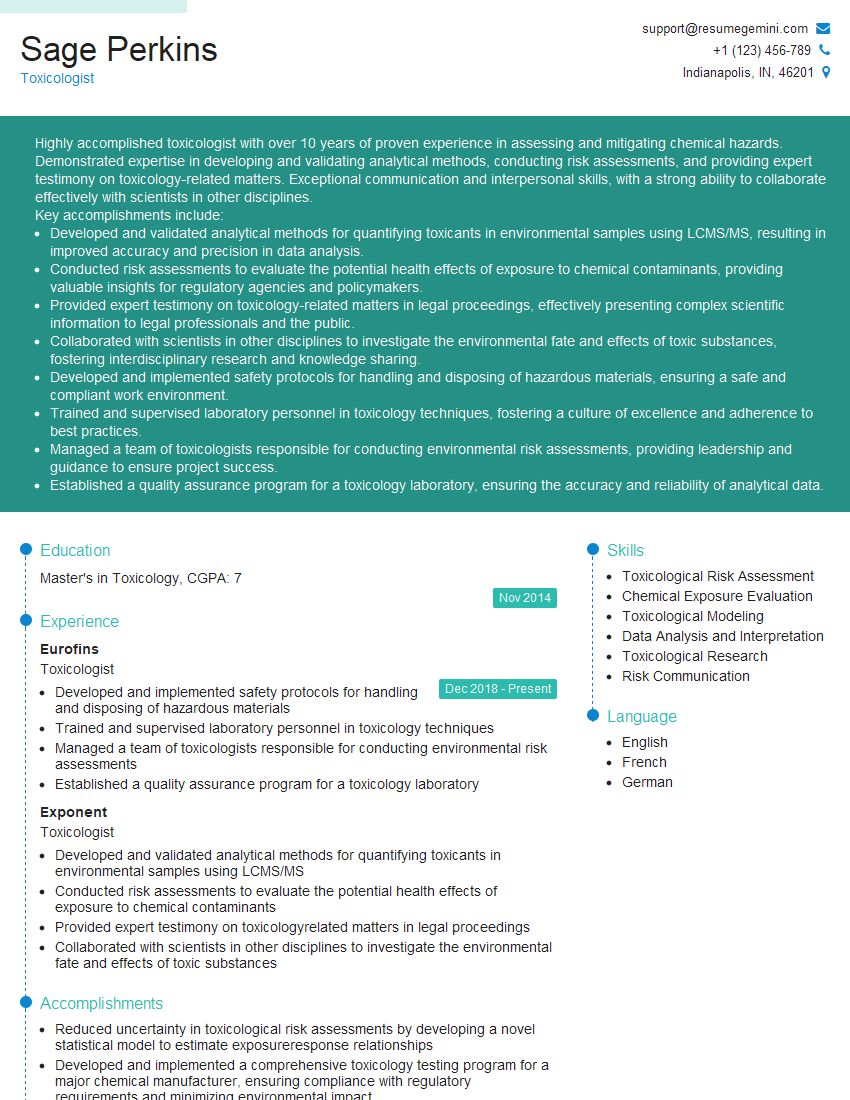
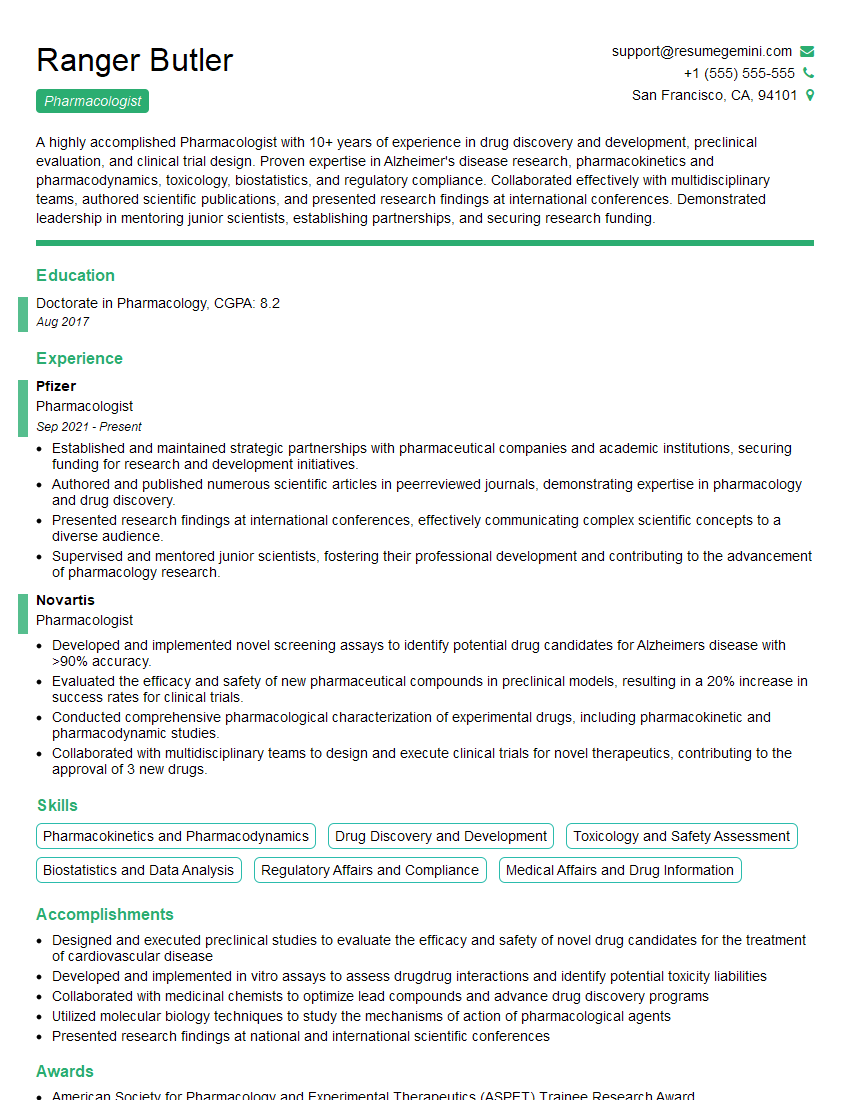
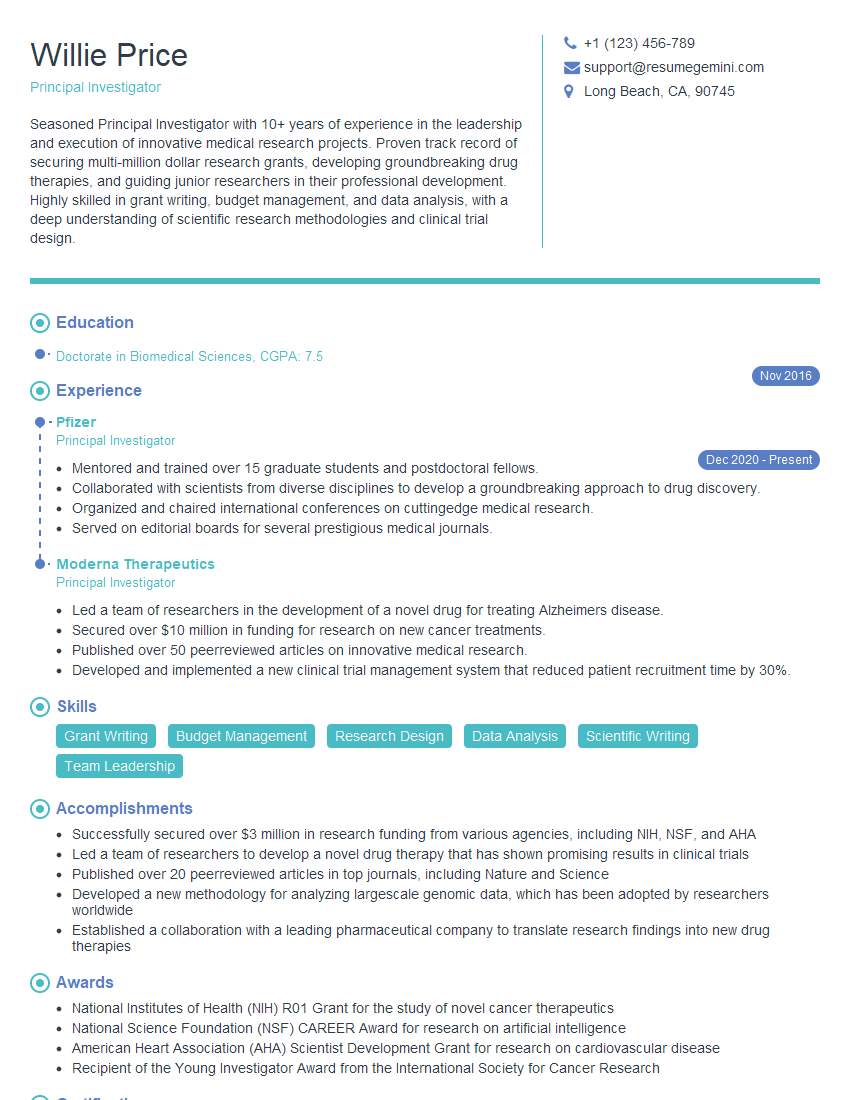
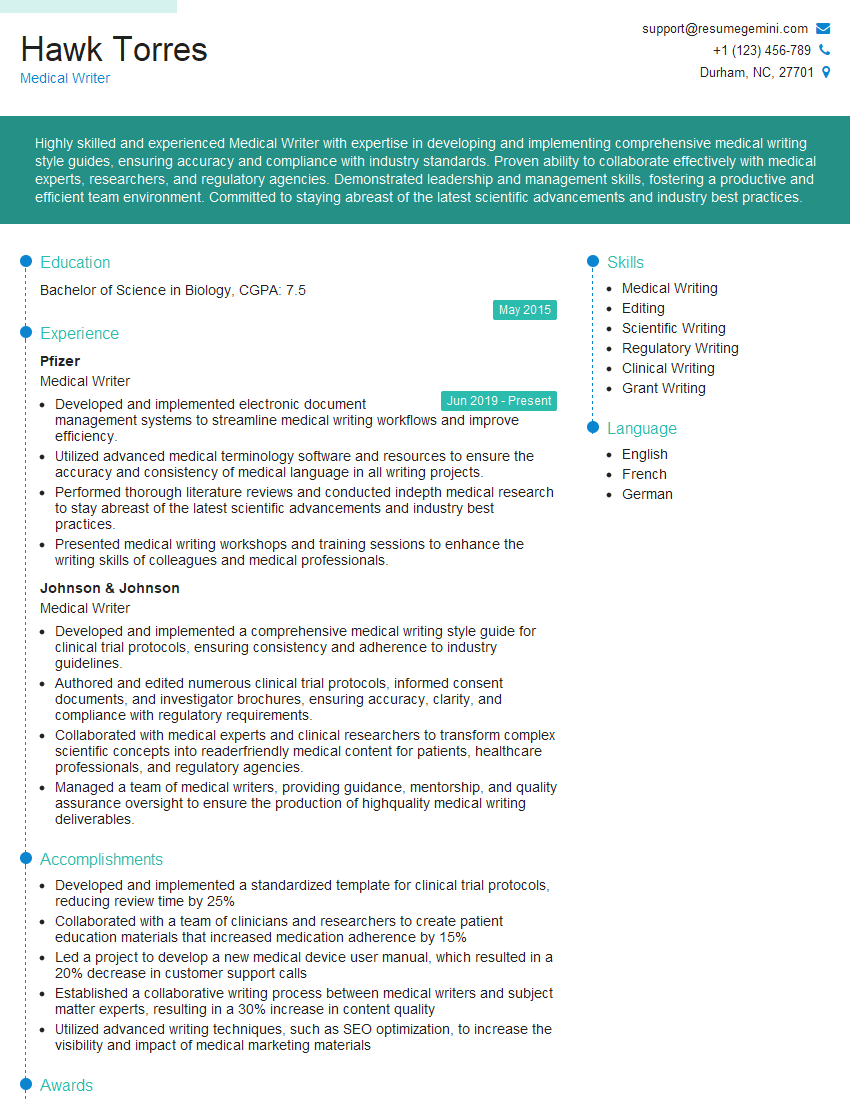
Mastering Biomedical Research Methods is crucial for career advancement in this dynamic field. A strong understanding of these principles will significantly enhance your ability to design impactful research, analyze data effectively, and contribute meaningfully to scientific discovery. To make the most of your job search, creating a compelling and ATS-friendly resume is vital. ResumeGemini is a trusted resource that can help you build a professional resume that highlights your skills and experience effectively. Examples of resumes tailored to Biomedical Research Methods are provided to guide you.
Explore more articles
Users Rating of Our Blogs
Share Your Experience
We value your feedback! Please rate our content and share your thoughts (optional).
What Readers Say About Our Blog
good
