Interviews are opportunities to demonstrate your expertise, and this guide is here to help you shine. Explore the essential Experience with diagnostic and troubleshooting tools interview questions that employers frequently ask, paired with strategies for crafting responses that set you apart from the competition.
Questions Asked in Experience with diagnostic and troubleshooting tools Interview
Q 1. Describe your experience using diagnostic tools for network troubleshooting.
Network troubleshooting relies heavily on diagnostic tools to pinpoint the source of connectivity problems. My experience spans various tools, from basic command-line utilities like ping, traceroute (or tracert on Windows), and nslookup to more sophisticated network analyzers like Wireshark. I use ping to check basic connectivity to a host, verifying if packets are reaching their destination and measuring response times. traceroute maps the path packets take, highlighting potential points of failure along the way. nslookup helps verify DNS resolution, ensuring that domain names are correctly translated into IP addresses. More advanced tools like Wireshark allow deep packet inspection, revealing the contents of network traffic and helping identify protocol errors or security breaches. For example, I once used Wireshark to diagnose intermittent network drops between servers. By analyzing the captured packets, I identified a specific pattern of dropped ARP packets, which led me to a faulty network switch.
Beyond these tools, I’m proficient with network monitoring systems that provide real-time visibility into network performance, such as SolarWinds or PRTG. These systems provide crucial metrics like bandwidth utilization, latency, and error rates, allowing for proactive identification and resolution of potential issues before they impact users.
Q 2. Explain the process you follow when troubleshooting a complex software issue.
Troubleshooting complex software issues is a systematic process. I begin with a thorough understanding of the problem, gathering as much information as possible from error messages, user reports, and system logs. I then formulate a hypothesis about the root cause. My process often follows these steps:
- Reproduce the issue: If possible, I try to reproduce the problem in a controlled environment to better understand the conditions under which it occurs.
- Isolate the problem: I systematically eliminate potential causes. This might involve checking system configurations, reviewing recent software changes, or testing different components of the system.
- Research and analyze: I leverage online resources, documentation, and internal knowledge bases to identify known issues or potential solutions. This step often involves analyzing log files for clues.
- Implement and test solutions: Once a likely solution is identified, I implement it, carefully testing to ensure it resolves the issue without introducing new problems.
- Document the solution: Finally, I document the troubleshooting process and solution for future reference.
For instance, I once tackled a complex issue where a specific database query was consistently failing. By analyzing database logs and examining the query itself, I discovered a subtle incompatibility between the database version and the application code. Updating the application code resolved the problem.
Q 3. What are some common diagnostic tools you’ve used, and what are their strengths and weaknesses?
Over the years, I’ve utilized a wide range of diagnostic tools. Some of my favorites include:
- Wireshark (Network Analyzer): Strengths – Deep packet inspection, protocol analysis, powerful filtering capabilities. Weakness – Steep learning curve, can generate large capture files.
- Log Parser (Log Analysis): Strengths – Efficiently analyzes large log files, identifies patterns and anomalies. Weakness – Requires familiarity with regular expressions.
- Performance Monitor (Windows) / Activity Monitor (macOS): Strengths – Real-time monitoring of system resources (CPU, memory, disk I/O). Weakness – Can be overwhelming without specific metrics in mind.
- Process Explorer (Windows): Strengths – Detailed information on running processes, including handles and DLLs. Weakness – Advanced tool, requires understanding of system processes.
- Event Viewer (Windows) / System Logs (macOS/Linux): Strengths – Centralized repository for system events and errors. Weakness – Requires knowledge of log interpretation.
The choice of tool depends heavily on the specific issue. For network problems, Wireshark is invaluable. For software issues, log parsers and system monitors are crucial.
Q 4. How do you prioritize troubleshooting tasks when multiple issues arise simultaneously?
When multiple issues arise simultaneously, prioritization is key. My approach involves assessing the impact of each issue on users or business operations. I use a risk-based approach, prioritizing issues based on factors like:
- Impact: How severely does the issue affect users or business operations?
- Urgency: How quickly does the issue need to be resolved?
- Complexity: How difficult will it be to resolve the issue?
Issues with the highest impact and urgency are tackled first. For example, a system outage impacting critical business functions would take precedence over a minor visual bug in a less-critical application. I often use a ticketing system to track and manage multiple issues, ensuring transparency and accountability.
Q 5. Describe a time you used remote diagnostic tools to resolve a problem.
I once used remote diagnostic tools to resolve a critical database issue for a client located across the country. Using TeamViewer for remote access and SQL Server Management Studio (SSMS) for database administration, I was able to connect to their server and diagnose the problem. The database was experiencing severe performance degradation due to a runaway process. Through SSMS, I identified the problematic process, terminated it, and reviewed the database logs to understand the root cause. I then implemented a preventative measure to prevent the issue from recurring. The remote tools allowed me to resolve the issue quickly and efficiently, minimizing downtime for the client.
Q 6. Explain your understanding of log files and how you use them in troubleshooting.
Log files are invaluable in troubleshooting. They provide a chronological record of system events, including errors, warnings, and informational messages. I use them to identify patterns, pinpoint the time of occurrence of a problem, and understand the sequence of events leading to a failure. For example, application logs might reveal specific errors during a crash, while system logs may indicate resource constraints or security events. Understanding the structure and format of log files is critical, as they are often specific to the application or system they pertain to. I often use log aggregation tools to centralize and analyze logs from various sources, making it easier to identify trends and correlations. My approach usually involves searching for specific error codes, timestamps related to the issue, and reviewing the events that preceded the failure.
Q 7. How do you effectively communicate technical issues to non-technical stakeholders?
Communicating technical issues to non-technical stakeholders requires clear and concise language, avoiding jargon. I use analogies and plain English to explain complex concepts. For instance, instead of saying “The database experienced a deadlock condition,” I might say “Imagine two trains on a single track trying to go in opposite directions. The database couldn’t proceed because two processes were blocking each other.” I focus on the impact of the issue on the business rather than technical details. Visual aids, such as charts and diagrams, can be very effective in conveying information. Finally, I tailor my communication to the audience’s level of technical understanding, ensuring they understand the problem and the proposed solution.
Q 8. What is your process for documenting troubleshooting steps and solutions?
My documentation process for troubleshooting is meticulous and follows a structured approach. I always begin by creating a detailed record of the initial problem description, including any error messages, timestamps, and affected systems. This initial documentation acts as a baseline.
Next, I meticulously document each troubleshooting step I take, including the commands executed, the tools used, and the results obtained. This is crucial for recreating the issue or understanding the resolution path later. I use a combination of text-based logs and potentially screenshots or screen recordings to capture visual aspects, particularly for UI issues or complex network diagrams. For example, if I’m troubleshooting a network connectivity issue, I’d log the output of ping commands, traceroute results, and any relevant configuration settings.
Finally, I summarize the root cause, the implemented solution, and any preventative measures taken to avoid similar issues in the future. This comprehensive documentation aids future troubleshooting, knowledge sharing within the team, and helps establish a clear history for auditing purposes. I prefer using a dedicated ticketing system or a version-controlled document to ensure organization and collaboration.
Q 9. How do you handle situations where you can’t immediately identify the root cause of a problem?
When faced with an elusive problem, my approach is systematic and methodical. I start by expanding the scope of my investigation, gathering more information. This might involve checking logs from different system components, interviewing users for more context, or analyzing related systems for any correlation. Imagine it like a detective investigating a crime; you start with the immediate evidence and then expand your search to find more clues.
I then leverage advanced diagnostic tools, like Wireshark or tcpdump (which I’ll detail later), to analyze network traffic or system events at a deeper level. I break down the problem into smaller, more manageable components, employing a divide-and-conquer strategy. I might even revert to a known good configuration to see if the problem is resolved, thereby isolating the changes that introduced the issue. Collaboration is key; I actively seek guidance from peers or senior engineers if I’m hitting a wall. Documenting every step is crucial, even failed attempts, as this helps to eliminate possibilities and guide the investigation.
Ultimately, if the root cause remains unidentified after exhausting reasonable efforts, I document the unresolved issue, outlining all the steps taken and the current state of the investigation. This ensures that the issue is not forgotten and can be revisited later with fresh insights or new tools.
Q 10. Describe your experience with specific diagnostic software (e.g., Wireshark, tcpdump).
I have extensive experience with network protocol analyzers like Wireshark and tcpdump. Wireshark is my go-to tool for detailed network analysis. Its ability to capture and dissect network packets allows for in-depth examination of communication between systems, identifying protocol anomalies, and pinpointing performance bottlenecks. For example, I once used Wireshark to diagnose slow database queries by examining the network traffic between the application server and the database server, revealing excessive packet retransmissions indicating a network connectivity issue.
tcpdump provides a command-line interface for similar packet capture, offering more lightweight and efficient capture for specific events. I often use it for quick analysis or scripting automated tasks. For instance, if I suspect a specific port is experiencing high traffic, I might use tcpdump to filter traffic on that port and analyze the results. The ability to filter and save captures makes it indispensable for targeted investigation.
Beyond these, I’m proficient in other diagnostic tools depending on the context, including system monitoring tools like Nagios or Zabbix, log analysis tools like Splunk or ELK stack, and debugging tools specific to the operating system or application in question. The choice of tool is always dictated by the nature of the problem and the available resources.
Q 11. How do you ensure the accuracy and reliability of your diagnostic findings?
Ensuring the accuracy and reliability of diagnostic findings involves several crucial steps. First, I validate my findings through multiple independent sources. If a particular metric or log entry suggests a problem, I confirm it using different methods or data points. For example, if a performance monitoring tool shows high CPU usage, I’d also check the system logs for related errors and correlate them with other metrics.
Reproducibility is another key factor. I strive to reproduce the problem consistently under controlled conditions. This involves creating a controlled test environment, if possible, or carefully documenting the steps to reproduce the issue in the production environment. This helps rule out random events or transient issues. Careful attention to detail and cross-referencing of information are critical. Often, I leverage established methodologies, like the scientific method, to systematically test hypotheses and confirm my assumptions.
Finally, I always document my findings thoroughly. This includes the steps I took, the tools I used, the results obtained, and the rationale behind my conclusions. This documentation provides a clear audit trail and allows others to review and verify my findings. This is especially important for critical issues impacting production systems.
Q 12. Explain your approach to troubleshooting hardware issues.
Troubleshooting hardware issues requires a structured approach combining both physical inspection and diagnostic tools. I begin with a visual inspection, checking for any obvious physical damage like loose cables, damaged components, or overheating. A simple visual check can often reveal the source of the problem quickly.
Next, I employ diagnostic tools specific to the hardware. For example, with a server, I might use the system’s BIOS to run hardware diagnostics, checking memory, hard drives, and other components. For network devices, I would use tools that can check signal strength, cable connectivity, and other network parameters. This could include dedicated network testing tools or simply the diagnostics features built into a network switch or router.
If the problem persists, I might employ advanced diagnostic tools such as specialized memory testers or hard drive diagnostic tools. If a component is suspected to be faulty, I might consider swapping it out for a known-good component to test my hypothesis. Throughout the process, detailed documentation and careful logging of tests performed and results obtained are crucial for accurate diagnosis and efficient resolution.
Q 13. How do you determine the scope of a problem before beginning to troubleshoot?
Determining the scope of a problem before troubleshooting is paramount to efficient resolution. I start by gathering information from multiple sources. This includes talking to users who reported the problem, reviewing system logs, and monitoring system performance metrics. The goal is to get a comprehensive understanding of what’s happening and how widespread the impact is.
I use several techniques to define the scope. One is to identify the affected systems or users. Is it a single user, a specific application, or the entire network experiencing the issue? Then, I determine the symptoms. What exactly is malfunctioning? Are there error messages, performance degradation, or complete system failure? Finally, I try to establish a timeline. When did the problem start? Were there any recent changes to the system or network configuration? This helps to isolate potential causes.
This initial investigation allows me to prioritize efforts and focus on the most critical aspects of the problem. For example, if a network outage is affecting the entire company, I’d prioritize resolving the network issue before addressing individual user problems. A clearly defined scope also helps to prevent wasting time on irrelevant troubleshooting.
Q 14. Describe a time you had to troubleshoot a problem with limited information.
I once encountered a situation where a critical application was intermittently failing, producing vague error messages and with no readily available logs. The initial information was extremely limited. The error messages were generic and didn’t point to a specific cause. My approach was methodical. I started by interviewing the users to get a more detailed understanding of when and how the errors were occurring.
I then leveraged system monitoring tools to identify any unusual patterns in system resource utilization during the times the application failed. This revealed spikes in disk I/O just before the failures, suggesting a potential disk problem. I then used more detailed disk diagnostic tools to identify bad sectors on the hard drive that were causing the intermittent errors.
The challenge was that I didn’t have access to extensive logs or a clear indication of the problem’s cause. The solution relied on carefully analyzing indirect evidence, using system monitoring tools and systematically eliminating other potential causes before arriving at the root cause, a failing hard drive. This highlighted the importance of using multiple diagnostic tools and techniques, especially when starting with limited information.
Q 15. How do you stay updated on new diagnostic tools and techniques?
Staying current in the rapidly evolving field of diagnostic tools and techniques requires a multi-pronged approach. I actively participate in online communities and forums dedicated to troubleshooting and system administration, such as Stack Overflow and Reddit’s r/sysadmin. These platforms offer a wealth of knowledge shared by experienced professionals, and discussions often highlight emerging tools and best practices.
Furthermore, I regularly attend webinars and conferences, both online and in-person, focusing on areas relevant to my work. These events provide opportunities to learn about the latest innovations from vendors and industry experts. Finally, I subscribe to relevant industry newsletters and publications, staying abreast of new releases and research in diagnostic technologies. This combination of active participation, formal learning, and continuous reading ensures I remain at the forefront of my field.
Career Expert Tips:
- Ace those interviews! Prepare effectively by reviewing the Top 50 Most Common Interview Questions on ResumeGemini.
- Navigate your job search with confidence! Explore a wide range of Career Tips on ResumeGemini. Learn about common challenges and recommendations to overcome them.
- Craft the perfect resume! Master the Art of Resume Writing with ResumeGemini’s guide. Showcase your unique qualifications and achievements effectively.
- Don’t miss out on holiday savings! Build your dream resume with ResumeGemini’s ATS optimized templates.
Q 16. What metrics do you use to measure the effectiveness of your troubleshooting efforts?
Measuring the effectiveness of troubleshooting is crucial. I use a combination of metrics, both quantitative and qualitative. Quantitative metrics include:
- Mean Time To Resolution (MTTR): This measures the average time it takes to resolve an issue. A lower MTTR indicates improved efficiency.
- Resolution Rate: This tracks the percentage of issues successfully resolved. A high resolution rate suggests effective troubleshooting strategies.
- Number of Incidents: Monitoring the number of incidents helps identify trends and potential systemic problems. A decrease indicates improvements.
Qualitative metrics, equally important, consider the user experience. Post-resolution surveys, for example, gauge user satisfaction with the speed and quality of the resolution. This feedback provides valuable insights beyond the raw numbers, helping to understand the impact of troubleshooting on overall system performance and user experience.
Q 17. How do you handle situations where a problem is caused by multiple factors?
Troubleshooting issues with multiple root causes requires a systematic approach. I employ a process similar to the scientific method. First, I gather as much data as possible, using diagnostic tools to identify all potential contributing factors. This involves checking logs, monitoring system performance, and interviewing users. Then, I develop a hypothesis about the most likely causes, prioritizing based on impact and likelihood.
Next, I test my hypothesis by systematically isolating and addressing each potential factor. This is done in a controlled manner to avoid introducing new problems. If my initial hypothesis is incorrect, I iterate, refining my understanding and testing new hypotheses. This iterative process, combined with thorough documentation, ensures all contributing factors are identified and addressed, preventing recurrence. Think of it like solving a multi-layered puzzle: each piece needs to be found and placed correctly to complete the picture.
Q 18. Describe your experience with using monitoring tools for proactive troubleshooting.
Proactive troubleshooting using monitoring tools is essential for preventing outages and minimizing downtime. I have extensive experience using tools like Nagios, Prometheus, and Grafana. These tools allow for continuous monitoring of system performance and resource utilization. Setting up alerts based on predefined thresholds enables early detection of potential issues, allowing for intervention before they impact users.
For example, using Prometheus to monitor CPU utilization, we can set an alert to trigger when CPU usage exceeds 90%. This allows us to investigate the cause (e.g., a runaway process) and take corrective action before performance degrades or the system crashes. This proactive approach significantly reduces MTTR and improves overall system reliability. I leverage dashboards to visualize key metrics, providing a clear overview of system health and identifying potential bottlenecks. This ensures a more predictive and less reactive approach to troubleshooting.
Q 19. What are some common pitfalls to avoid when troubleshooting complex systems?
Troubleshooting complex systems can be challenging, and several pitfalls must be avoided. One common mistake is jumping to conclusions without sufficient evidence. Thorough investigation and data gathering are crucial before attempting to fix a problem. Another pitfall is making assumptions about the root cause, leading to inefficient troubleshooting. It’s vital to systematically rule out all possibilities before settling on a solution.
Another common issue is failing to document the troubleshooting process. This can lead to wasted time if the same issue recurs later. A detailed record of steps, findings, and solutions is crucial. Finally, neglecting to test changes thoroughly before implementing them can lead to unintended consequences. Always test changes in a controlled environment first to mitigate risk. Remember, a methodical, evidence-based approach significantly increases the chances of successful troubleshooting.
Q 20. How do you manage your time effectively when dealing with multiple troubleshooting requests?
Managing multiple troubleshooting requests efficiently requires a structured approach. I utilize ticketing systems to prioritize requests based on severity and impact. This ensures that critical issues are addressed first. I also use time-blocking techniques to dedicate specific time slots to particular tasks. This prevents multitasking and allows for focused attention on each issue.
Regular communication with stakeholders keeps everyone informed about progress and expectations. Furthermore, I leverage automation where possible to reduce manual effort. This might involve creating scripts to automate repetitive tasks or using monitoring tools to automatically detect and resolve certain issues. Effective time management in troubleshooting is all about prioritization, organization, and leveraging tools and techniques to streamline workflows.
Q 21. Describe your experience with using scripting or automation for troubleshooting.
Scripting and automation are invaluable tools in my troubleshooting arsenal. I frequently use Python and Bash scripting to automate repetitive tasks, such as checking log files for errors, gathering system information, and remotely executing commands. This significantly improves efficiency and reduces human error.
For instance, I might write a Python script to parse log files and identify recurring errors, automating the initial stages of troubleshooting. Or I could develop a Bash script to automate the deployment of a software patch to multiple servers. This automated approach allows for quicker resolution of issues and proactive management of system health. #!/bin/bash
# Script to check disk space on multiple servers
for server in server1 server2 server3; do
ssh $server df -h >> disk_space.txt
done This is a simple example of how automation helps. The capabilities are limitless.
Q 22. How familiar are you with different debugging techniques (e.g., breakpoints, logging)?
Debugging is the art of systematically identifying and resolving errors in code or systems. I’m highly proficient in a variety of debugging techniques. Breakpoints, for instance, allow me to pause execution at specific points in the code, inspecting variables and program flow to pinpoint the source of a problem. Think of it like putting a temporary pause button in your program to examine what’s happening at a critical juncture. I frequently use breakpoints in debuggers like GDB (GNU Debugger) or integrated development environment (IDE) debuggers such as those in Visual Studio or IntelliJ. Logging, on the other hand, involves strategically inserting code that writes information about the program’s state to a log file. This allows for post-mortem analysis, tracing the execution path and identifying anomalies even after the program has terminated. This is incredibly useful for intermittent issues or production environments where using breakpoints directly is impractical. I often combine logging with different log levels (e.g., DEBUG, INFO, WARNING, ERROR) to manage the verbosity of my logs, focusing on critical information during troubleshooting.
For example, if a web application is crashing intermittently, I would implement logging statements at various stages, recording inputs, outputs, and the state of key variables. This would help me isolate the point of failure. Furthermore, I’m also familiar with other techniques such as using print statements (for quick checks), stepping through code line by line (a feature in debuggers), and utilizing memory debuggers to detect memory leaks.
Q 23. Explain your understanding of system architecture and how it impacts troubleshooting.
Understanding system architecture is crucial for effective troubleshooting. The architecture dictates how different components interact, and a flaw in one area can trigger cascading failures elsewhere. Knowing the architecture helps me quickly identify potential sources of a problem and narrow down the search space. For example, a three-tier architecture with a presentation layer, application layer, and database layer has distinct failure points. A problem in the presentation layer might manifest as a user interface error, while a database issue could lead to application-wide slowdowns or crashes. By understanding the dependencies between layers, I can trace errors effectively. I visualize system architecture using diagrams and documentation, focusing on data flow and component interactions.
In practice, I’ve often found that a seemingly simple application error is actually a symptom of a deeper problem within the database, network infrastructure, or even a misconfiguration in the server environment. Therefore, a thorough understanding of the entire system is essential for successful and efficient troubleshooting. This includes familiarity with network protocols, operating systems, databases, and application frameworks.
Q 24. Describe your experience working with a ticketing system for managing troubleshooting requests.
Ticketing systems, such as Jira or ServiceNow, are integral to my troubleshooting workflow. They provide a centralized system for managing and tracking requests, ensuring transparency and accountability. I utilize them to log issues, prioritize tasks, and document the troubleshooting process, including steps taken, solutions implemented, and outcomes. The ticketing system facilitates communication with other team members and stakeholders, especially when multiple people are involved in resolving a complex issue. This improves collaboration and ensures that nothing falls through the cracks. I also find the reporting features invaluable for identifying trends and patterns in issues, which can be useful for preventative measures.
For example, I would create a detailed ticket describing the problem, steps to reproduce it, and initial findings. I would update the ticket as I progress, providing status updates, including details about the implemented fixes, tests conducted and their results. The ticket serves as a complete record of the incident and its resolution, useful for future reference or knowledge sharing. The proper use of ticket fields, status updates, and relevant attachments are essential for effective management of troubleshooting requests within a team.
Q 25. How do you collaborate with other team members during the troubleshooting process?
Collaboration is key to effective troubleshooting. I approach this using a combination of clear communication, shared knowledge, and appropriate tools. Before embarking on independent troubleshooting, I often discuss the issue with other team members, seeking different perspectives and potential solutions. This can involve brainstorming sessions, code reviews, or simply sharing information. I utilize collaboration tools such as Slack or Microsoft Teams to ensure prompt communication and quick access to information. This ensures the problem is tackled holistically rather than in isolation.
For instance, if I encounter a complex issue involving multiple systems, I would collaborate with database administrators, network engineers, or front-end developers, depending on the nature of the problem. I would clearly articulate the issue, my initial findings, and potential hypotheses, encouraging a two-way flow of ideas and expertise. The shared understanding improves the speed and efficiency of the troubleshooting process, often leading to faster solutions and a reduction in frustration.
Q 26. What are some ethical considerations related to diagnostic and troubleshooting work?
Ethical considerations in diagnostic and troubleshooting work are paramount. Data privacy is a major concern; I always ensure that I handle sensitive information responsibly, adhering to company policies and relevant regulations such as GDPR or HIPAA. This includes encrypting sensitive data, restricting access to authorized personnel only, and adhering to strict logging and auditing practices. Another key aspect is maintaining professional integrity. I never misrepresent my skills or experience, and I always strive to provide honest and accurate diagnoses, even if it means admitting limitations. I avoid making assumptions and rigorously validate my findings.
Furthermore, I always document my troubleshooting steps and findings transparently and accurately. This ensures accountability and allows other team members to understand the process and potentially learn from my experiences. Avoiding conflicts of interest and maintaining confidentiality are also critical ethical considerations. I ensure that my work is objective and unbiased, and I always prioritize the security and well-being of the systems I support.
Q 27. How would you approach troubleshooting a performance bottleneck in a database?
Troubleshooting a database performance bottleneck requires a systematic approach. My strategy involves a series of steps, starting with identifying the bottleneck itself. This often involves analyzing query execution plans, monitoring resource utilization (CPU, memory, I/O), and examining slow query logs. Tools like SQL Profiler (for SQL Server), explain plans (in most database systems), and database monitoring tools provide valuable insights.
Once the bottleneck is identified (e.g., a poorly performing query, insufficient indexing, or hardware limitations), I move to implement solutions. This could involve optimizing queries, creating or altering indexes, upgrading hardware, tuning database parameters, or even schema changes. Throughout the process, I meticulously monitor the performance metrics to verify the effectiveness of the changes. For instance, I might optimize a poorly written query by rewriting it with better joins, using appropriate indexes and avoiding full table scans. Or, if disk I/O is a bottleneck, I might explore options such as upgrading storage hardware or implementing better caching strategies. Testing and validation are crucial at each step to ensure that the implemented solutions resolve the performance issue without introducing new problems.
Q 28. Describe your experience using cloud-based diagnostic tools.
I have extensive experience utilizing cloud-based diagnostic tools, primarily from AWS, Azure, and GCP. These platforms offer a rich array of services and tools for monitoring, troubleshooting, and optimizing cloud-based applications. In AWS, I frequently use CloudWatch for monitoring metrics, CloudTrail for logging and auditing, and X-Ray for application tracing. In Azure, I leverage Azure Monitor, Log Analytics, and Application Insights for similar purposes. GCP’s Cloud Monitoring, Logging, and Profiler services provide analogous capabilities. These tools provide real-time insights into system performance, allowing for proactive identification and resolution of issues.
For example, using CloudWatch, I can set alarms that alert me to significant changes in CPU utilization, memory usage, or network traffic. This enables proactive intervention, preventing potential outages or performance degradation. Using Application Insights, I’ve been able to identify performance bottlenecks within specific parts of a web application, leading to targeted improvements in code or configuration. My experience encompasses both utilizing these tools independently and integrating them into CI/CD pipelines for automated monitoring and alerting.
Key Topics to Learn for Experience with Diagnostic and Troubleshooting Tools Interview
- Understanding Diagnostic Methodologies: Explore different approaches to diagnosing technical issues, from systematic elimination to root cause analysis. Consider the importance of asking clarifying questions and gathering sufficient information before implementing solutions.
- Proficiency with Specific Tools: Showcase your practical experience with relevant diagnostic tools. This could include network monitoring tools, log analyzers, debugging software (e.g., debuggers, profilers), or specialized tools relevant to your industry. Be prepared to discuss your experience with each tool, highlighting successful applications and challenges overcome.
- Problem-Solving Strategies: Practice articulating your problem-solving process. Describe how you approach a problem, from identifying the issue to implementing and testing solutions. Emphasize your ability to break down complex issues into smaller, manageable tasks.
- Log Analysis and Interpretation: Master the art of reading and interpreting log files. Explain how you use log data to identify errors, track down the source of problems, and monitor system performance. Discuss the different types of logs you’ve worked with and your approach to analyzing them efficiently.
- Remote Troubleshooting Techniques: If applicable, highlight your experience with remotely diagnosing and resolving technical problems. Discuss the challenges involved and the strategies you employ to troubleshoot effectively in a remote environment.
- Documentation and Reporting: Explain your approach to documenting troubleshooting steps, solutions, and findings. Highlight your ability to create clear and concise reports that effectively communicate technical information to both technical and non-technical audiences.
Next Steps
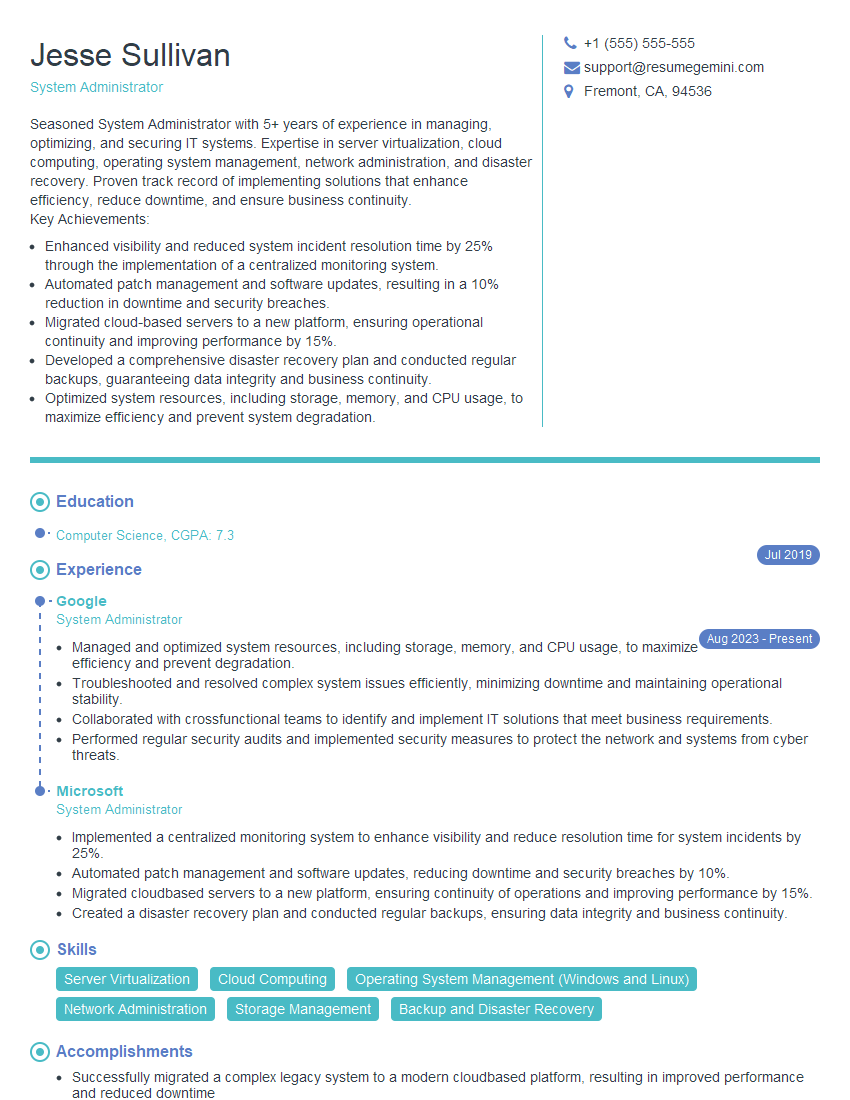
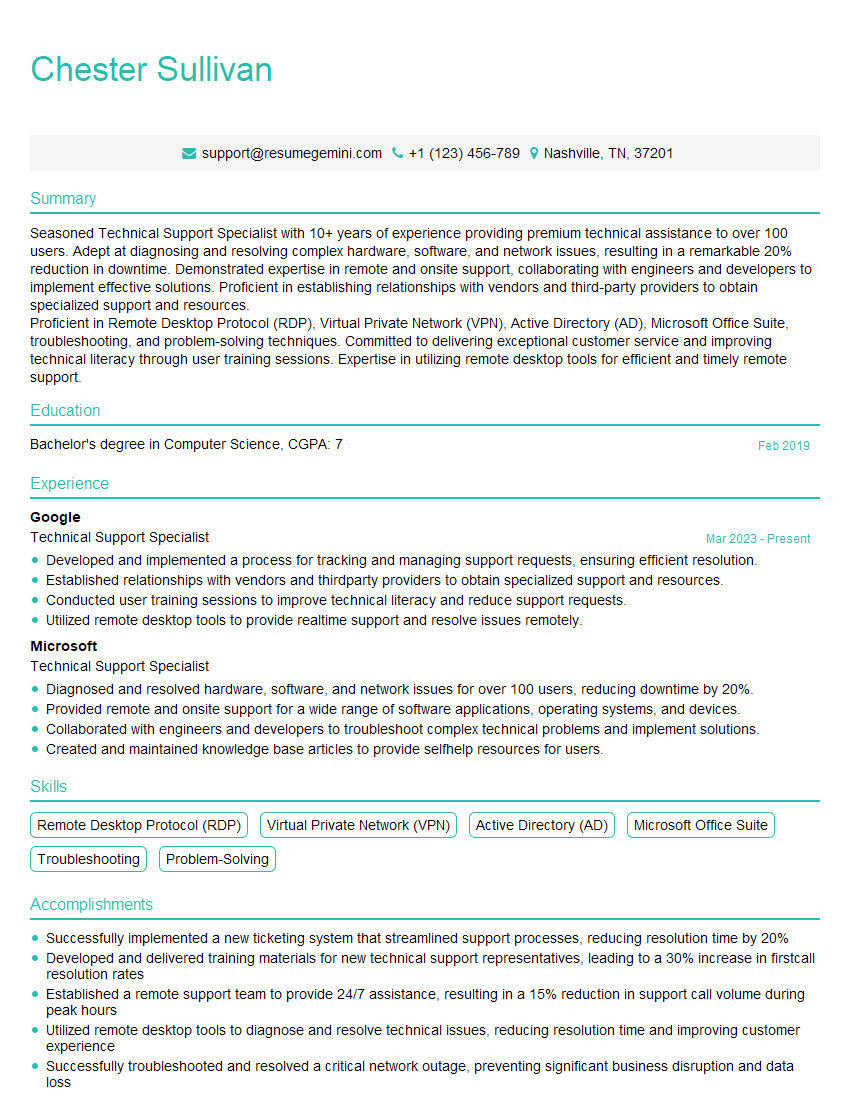
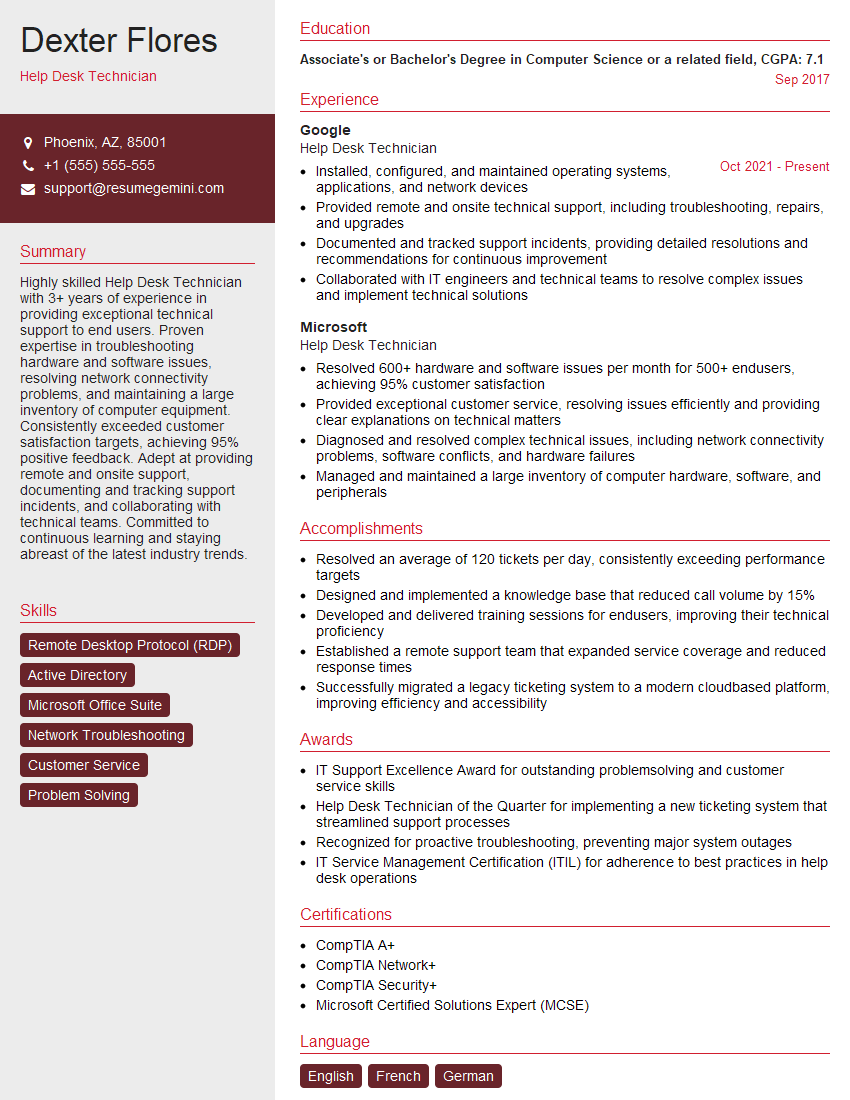
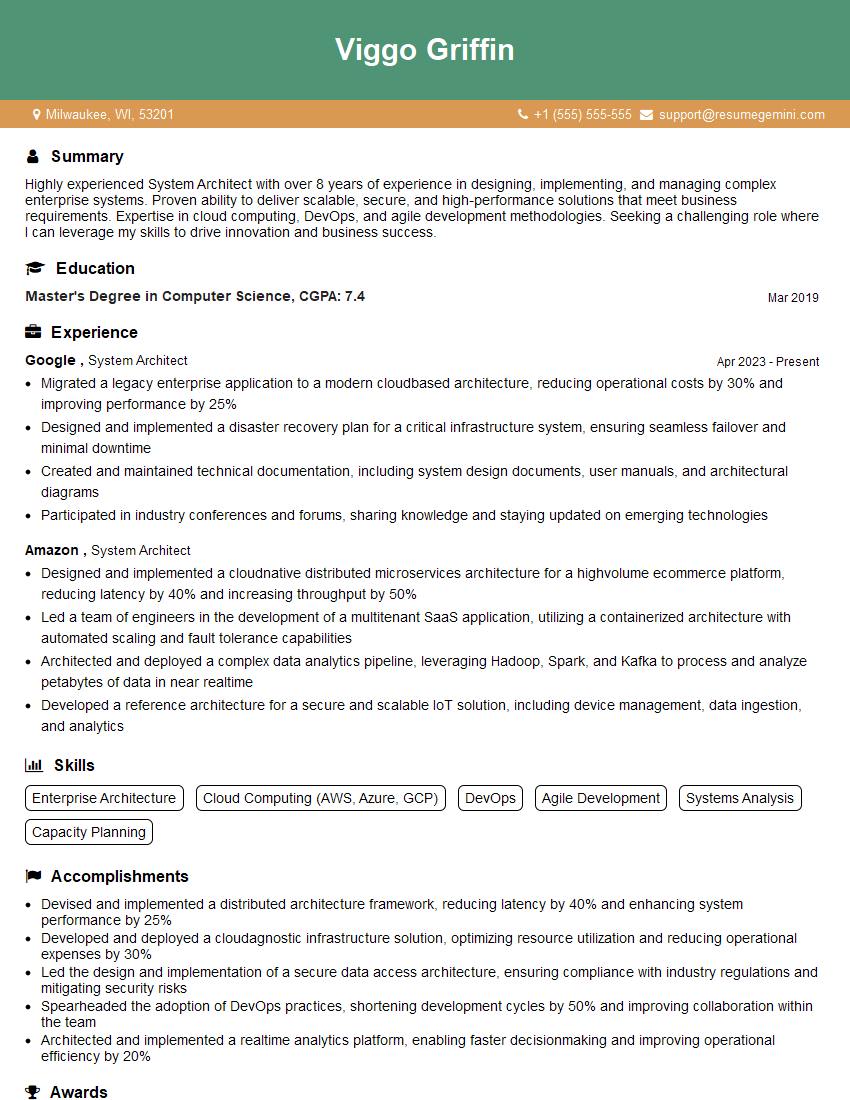
Mastering diagnostic and troubleshooting skills is crucial for career advancement in today’s tech-driven world. Employers highly value individuals who can effectively identify, analyze, and resolve technical issues efficiently and systematically. To stand out, create an ATS-friendly resume that highlights your expertise in this area. ResumeGemini can significantly help you build a professional and impactful resume that catches the recruiter’s eye. They offer examples of resumes tailored to showcasing experience with diagnostic and troubleshooting tools, giving you a head start in crafting a compelling application that truly reflects your abilities. Take the next step towards your dream job – build a winning resume with ResumeGemini today.
Explore more articles
Users Rating of Our Blogs
Share Your Experience
We value your feedback! Please rate our content and share your thoughts (optional).
What Readers Say About Our Blog
Hello,
We found issues with your domain’s email setup that may be sending your messages to spam or blocking them completely. InboxShield Mini shows you how to fix it in minutes — no tech skills required.
Scan your domain now for details: https://inboxshield-mini.com/
— Adam @ InboxShield Mini
Reply STOP to unsubscribe
Hi, are you owner of interviewgemini.com? What if I told you I could help you find extra time in your schedule, reconnect with leads you didn’t even realize you missed, and bring in more “I want to work with you” conversations, without increasing your ad spend or hiring a full-time employee?
All with a flexible, budget-friendly service that could easily pay for itself. Sounds good?
Would it be nice to jump on a quick 10-minute call so I can show you exactly how we make this work?
Best,
Hapei
Marketing Director
Hey, I know you’re the owner of interviewgemini.com. I’ll be quick.
Fundraising for your business is tough and time-consuming. We make it easier by guaranteeing two private investor meetings each month, for six months. No demos, no pitch events – just direct introductions to active investors matched to your startup.
If youR17;re raising, this could help you build real momentum. Want me to send more info?
Hi, I represent an SEO company that specialises in getting you AI citations and higher rankings on Google. I’d like to offer you a 100% free SEO audit for your website. Would you be interested?
Hi, I represent an SEO company that specialises in getting you AI citations and higher rankings on Google. I’d like to offer you a 100% free SEO audit for your website. Would you be interested?
good
