Every successful interview starts with knowing what to expect. In this blog, we’ll take you through the top Experience with Network Monitoring and Alerting Systems interview questions, breaking them down with expert tips to help you deliver impactful answers. Step into your next interview fully prepared and ready to succeed.
Questions Asked in Experience with Network Monitoring and Alerting Systems Interview
Q 1. Explain the difference between proactive and reactive network monitoring.
Proactive and reactive network monitoring represent two distinct approaches to identifying and addressing network issues. Reactive monitoring, the more traditional method, involves waiting for problems to occur before taking action. Think of it like waiting for your car to break down before taking it to the mechanic. You only know something is wrong after the fact. In contrast, proactive monitoring anticipates potential problems before they impact users or services. It’s like regularly servicing your car to prevent breakdowns. This predictive approach uses thresholds, baselines, and trend analysis to identify potential issues early on.
Reactive Monitoring: Relies on alerts triggered by failures or significant performance degradation. It’s less efficient as issues often affect users before detection.
Proactive Monitoring: Employs various techniques, including capacity planning, performance baselining, and anomaly detection, to identify potential problems before they escalate. This leads to fewer outages, improved service availability, and better resource utilization.
Example: Imagine a web server. Reactive monitoring would only alert you when the server crashes. Proactive monitoring would track CPU usage, memory consumption, and network traffic, alerting you when these metrics approach critical thresholds, allowing for intervention before the crash.
Q 2. Describe your experience with various network monitoring tools (e.g., Nagios, Zabbix, Prometheus, Datadog).
I have extensive experience with several network monitoring tools, each with its strengths and weaknesses. My experience spans from basic command-line tools to sophisticated enterprise-grade solutions.
- Nagios: A widely used open-source tool, Nagios excels in its flexibility and extensibility. I’ve used it for building comprehensive monitoring systems for mid-sized networks, leveraging its plugin architecture to monitor various services and devices. It’s strong in providing a centralized view of your infrastructure’s health.
- Zabbix: Another popular open-source choice, Zabbix offers a more user-friendly interface than Nagios, making it easier to manage and configure. I’ve particularly appreciated its robust auto-discovery features for automatically mapping network devices.
- Prometheus: This open-source monitoring system is excellent for containerized environments and microservices. Its time-series database excels at collecting and querying metrics. My experience with Prometheus includes integrating it with Kubernetes clusters for real-time monitoring of container health and resource usage.
- Datadog: A commercial SaaS solution, Datadog provides a comprehensive suite of monitoring and analytics tools with a strong focus on visualization and alerting. I’ve used Datadog in larger enterprise settings, valuing its ease of use and rich dashboards for reporting and analysis. Its centralized logging and tracing features are particularly beneficial.
My choice of tool depends heavily on the specific needs of the environment. For smaller organizations with a preference for open-source solutions, Nagios or Zabbix might be suitable. For complex, containerized environments, Prometheus is a strong contender. For larger enterprises needing advanced features and robust support, Datadog is a worthwhile investment.
Q 3. How do you define and implement Service Level Agreements (SLAs) related to network monitoring?
Service Level Agreements (SLAs) for network monitoring define the expected performance and availability of the monitoring system itself, and, critically, the network infrastructure it monitors. They are contracts between the monitoring team and the stakeholders (e.g., IT management, business units).
Defining SLAs: This involves clearly stating metrics like:
- Uptime: The percentage of time the monitoring system and critical network components are operational.
- Alert response time: The maximum time allowed for acknowledging and addressing critical alerts.
- Mean Time To Repair (MTTR): The average time to resolve network issues.
- Alert accuracy: The percentage of alerts that accurately reflect genuine issues (minimizing false positives).
Implementing SLAs: Implementation includes establishing monitoring procedures, setting alert thresholds, documenting response processes, and regularly reporting on performance against agreed-upon metrics. Regular review and adjustment of SLAs are crucial to adapt to evolving needs.
Example: An SLA might specify 99.9% uptime for the monitoring system, a maximum response time of 15 minutes for critical alerts, and an MTTR of under one hour for network outages. Failure to meet these metrics could have contractual consequences or trigger service credits.
Q 4. What are the key performance indicators (KPIs) you track in network monitoring?
The key performance indicators (KPIs) I track in network monitoring are carefully chosen to provide a holistic view of network health and performance. They fall into several categories:
- Availability: Uptime percentage of critical network devices and services.
- Latency: Network delay, crucial for applications like VoIP and video conferencing.
- Throughput: The volume of data transferred across the network.
- Packet loss: The percentage of data packets lost during transmission.
- CPU and Memory utilization: Resource consumption of network devices like routers and switches.
- Error rates: Frequency of errors on network interfaces or protocols.
- Application performance: Response times and error rates of key applications relying on the network.
- Security events: Number and type of security alerts, intrusion attempts, etc.
I regularly analyze these KPIs to identify trends, predict potential problems, and optimize network performance. The specific KPIs tracked will vary depending on the organization’s needs and the criticality of different network components.
Q 5. Explain your experience with network topology mapping and visualization.
Network topology mapping and visualization are crucial for understanding the structure of a network and troubleshooting issues. My experience includes using both automated and manual mapping techniques.
Automated Mapping: Tools like SolarWinds Network Performance Monitor or various open-source solutions can automatically discover network devices, identify connections, and generate visual representations of the network topology. These tools often use SNMP (Simple Network Management Protocol) to gather information.
Manual Mapping: For smaller networks or situations where automated tools can’t provide a complete picture, manual mapping using documentation and network device configurations is necessary. This provides a deeper understanding of the network configuration.
Visualization: Visual representations, such as network diagrams showing devices, connections, and bandwidth utilization, are essential for quick identification of potential bottlenecks or points of failure. Interactive maps allow for drill-down analysis, providing detailed information about specific components.
Example: A visual map might highlight a congested link between two switches, indicating the need for capacity upgrades. Or it might pinpoint a malfunctioning router, explaining slow network performance in a specific area.
Q 6. How do you handle false positives in network alerting systems?
False positives in network alerting systems are a major challenge. They lead to alert fatigue, reduced responsiveness to genuine issues, and wasted time investigating irrelevant problems. Handling them effectively involves a multi-pronged approach.
- Refine Alert Thresholds: Carefully adjust thresholds to minimize the chance of false positives. Use historical data and statistical analysis to establish reasonable thresholds, avoiding overly sensitive settings.
- Correlation Rules: Implement correlation engines to group related alerts and filter out redundant or insignificant ones. For example, multiple alerts from the same device within a short time frame might be correlated to a single incident.
- Suppression Techniques: Utilize suppression mechanisms to temporarily disable alerts based on specific criteria, like repeating alerts within a defined period. This prevents an overwhelming number of alerts from a single source.
- Regular Review and Tuning: Continuously review alert configurations and performance, identifying and addressing sources of false positives. This is an iterative process.
- Root Cause Analysis: Investigate the causes of false positives to identify patterns and improve alert configurations for better accuracy.
Example: If a network device regularly generates alerts for minor temporary fluctuations in CPU usage, raising the threshold or implementing a suppression mechanism could effectively reduce the number of false positives while ensuring critical alerts are not missed.
Q 7. Describe your experience with log management and analysis in network monitoring.
Log management and analysis are integral to effective network monitoring. Network devices, servers, and applications generate massive amounts of log data. Analyzing this data provides valuable insights into network behavior, security events, and performance issues.
Log Collection: Centralized log management systems collect logs from various sources, often using technologies like syslog, Elasticsearch, or dedicated log management tools like Splunk or Graylog.
Log Analysis: Tools and techniques like log aggregation, filtering, searching, and parsing are essential for analyzing log data. This can involve using regular expressions, custom scripts, or advanced analytics features to identify patterns and anomalies. Analyzing logs helps in identifying security breaches, performance bottlenecks, and other critical issues.
Example: Analyzing web server logs could reveal the source of a Denial-of-Service attack, helping security teams to mitigate the threat. Analyzing router logs might pinpoint a configuration issue causing routing problems.
Security Information and Event Management (SIEM): SIEM systems integrate log management with security information management to provide comprehensive security monitoring and analysis capabilities. They are essential for threat detection and compliance.
Q 8. What are common network security threats that network monitoring can help detect?
Network monitoring plays a crucial role in detecting a wide range of security threats. Think of it as a security guard for your network, constantly watching for suspicious activity. Common threats it can help identify include:
- Denial-of-Service (DoS) attacks: These attacks flood your network with traffic, making it unavailable to legitimate users. Monitoring tools can detect unusual spikes in traffic volume, indicating a potential DoS attempt.
- Port scans: Hackers use port scans to identify open ports on your network, looking for vulnerabilities to exploit. Monitoring systems can log these scans and alert you to potential intrusions.
- Malware infections: Infected machines often exhibit unusual network behavior, such as excessive outbound connections or communication with known malicious IP addresses. Monitoring can flag these anomalies.
- Unauthorized access attempts: Failed login attempts, especially from unusual IP addresses or locations, are strong indicators of unauthorized access. Monitoring can track these attempts and block repeated failures.
- Data exfiltration: Malicious actors may try to steal sensitive data by transferring large amounts of data outside your network. Monitoring can detect unusual data transfer patterns and alert you to potential breaches.
For example, I once worked on a project where network monitoring detected a significant increase in outbound traffic from a single server late at night. Further investigation revealed a malware infection that was stealing sensitive customer data. Early detection through monitoring allowed us to contain the breach quickly and minimize the damage.
Q 9. How do you prioritize alerts based on severity and impact?
Prioritizing alerts is crucial to avoid alert fatigue and focus on critical issues. We typically use a multi-layered approach involving severity levels and impact assessments. Severity is often based on predefined thresholds (e.g., critical, major, minor, warning). Impact considers the effect on business operations. For example, a minor CPU spike on a seldom-used server is less critical than a network outage affecting a critical application.
We often use a scoring system combining severity and impact. A critical severity coupled with a high impact (like a major network outage) will trigger immediate action, while a minor severity with low impact (like a temporary disk space warning) may be dealt with later. Alert management systems can be configured to automatically escalate alerts based on these scores, routing them to the appropriate teams.
Consider a scenario where a server experiences high CPU utilization (major severity). If this server hosts a customer-facing application (high impact), it will be prioritized over a server with high memory usage (major severity) hosting internal tools (low impact). This prioritization ensures focus on the most impactful issues first.
Q 10. Describe your approach to troubleshooting network performance issues using monitoring data.
Troubleshooting network performance issues using monitoring data is a systematic process. My approach typically involves these steps:
- Identify the problem: Analyze monitoring dashboards and alerts to pinpoint the performance degradation. This involves checking metrics like latency, packet loss, bandwidth utilization, CPU/memory usage on network devices.
- Isolate the root cause: Once the affected area is identified, drill down into the details. For example, if high latency is observed, check metrics at different points in the network path to isolate the bottleneck (e.g., router congestion, faulty cable, server overload).
- Gather supporting data: Collect logs from affected devices, network taps, and other monitoring systems. This provides granular insight into the problem.
- Implement solution: Based on the root cause analysis, implement the appropriate fix. This could range from upgrading hardware, optimizing network configurations, or addressing application-level issues.
- Validate the fix: After implementing the solution, monitor the system closely to confirm the issue is resolved and performance is restored.
For instance, if website load times are slow, I’d start by examining web server response times, then look at network latency between the server and users. I might trace routes to pinpoint bottlenecks and use packet captures to identify specific network issues.
Q 11. Explain your experience with capacity planning and forecasting in relation to network infrastructure.
Capacity planning and forecasting are essential for ensuring network infrastructure can handle current and future demands. My experience involves:
- Historical data analysis: Reviewing past network traffic patterns, bandwidth usage, and device resource utilization to establish trends and predict future growth.
- Business requirements gathering: Collaborating with business stakeholders to understand future needs and projected growth, such as expected increase in users or applications.
- Modeling and simulation: Using network simulation tools to test different scenarios and predict the impact of growth on network performance.
- Resource provisioning: Determining the necessary hardware and software resources to meet future demands, considering factors like bandwidth, CPU/memory, and storage.
- Monitoring and adjustment: Regularly monitoring network performance and adjusting capacity plans as needed, based on actual usage and changes in business requirements.
In a previous role, I used historical data and projected user growth to forecast bandwidth requirements for a new data center. This allowed us to provision the correct network infrastructure from the beginning, avoiding costly upgrades later on.
Q 12. What is your experience with automating network monitoring tasks?
Automation is critical for efficient network monitoring. My experience includes automating tasks using various tools and scripting languages, such as:
- Automated alert notifications: Setting up email, SMS, or pager alerts based on predefined thresholds and severity levels, ensuring timely issue resolution.
- Automated report generation: Creating scheduled reports on network performance, security events, and capacity utilization, aiding in proactive management.
- Automated remediation: Implementing automated responses to certain alerts, like automatically restarting a failing service or adjusting network configurations.
- Infrastructure-as-code (IaC): Using tools like Ansible or Terraform to automate the provisioning and configuration of monitoring infrastructure, ensuring consistent and repeatable deployments.
For example, I developed a script that automatically generates daily reports on bandwidth usage for different departments. This enabled us to identify potential issues before they impacted business operations. Automating these tasks freed up significant time for more complex tasks and strategic planning.
Q 13. How do you ensure the accuracy and reliability of network monitoring data?
Ensuring the accuracy and reliability of monitoring data is paramount. My approach involves:
- Regular calibration and testing: Periodically checking the accuracy of monitoring sensors and tools by comparing data with independent sources or manually verifying values.
- Data validation: Implementing data validation rules and checks within the monitoring system to identify and filter out erroneous or outlier data points.
- Redundancy and failover: Using redundant monitoring systems and implementing failover mechanisms to ensure continuous monitoring even in case of hardware or software failures.
- Data integrity checks: Implementing checksums and other data integrity checks to ensure data hasn’t been corrupted during transmission or storage.
- Proper sensor placement: Strategically placing monitoring sensors to accurately capture relevant network traffic and performance data.
For example, we used redundant SNMP agents on critical network devices to ensure continuous monitoring even if one agent failed. We also implemented data validation rules to filter out spurious alerts caused by temporary network glitches.
Q 14. Explain the different types of network monitoring protocols (SNMP, NetFlow, etc.).
Network monitoring relies on several protocols to collect data. Here are some key ones:
- SNMP (Simple Network Management Protocol): A widely used protocol for collecting network device information like CPU usage, memory utilization, interface statistics. It uses a request-response model, polling devices for data at regular intervals.
snmpget -v 2c -c public(This example shows getting a device description using SNMP).sysDescr - NetFlow (and its variants like sFlow, IPFIX): These protocols provide detailed information about network traffic flows, such as source/destination IP addresses, ports, protocols, and bytes transferred. They offer a richer understanding of network traffic patterns than SNMP.
- Spanning/Mirroring: This technique copies network traffic from one or more ports to a monitoring device, allowing for deep packet inspection and analysis. This is often used for security monitoring and troubleshooting.
- Syslog: A standard protocol for collecting log messages from network devices and applications. It provides crucial information for security and performance analysis.
- WMI (Windows Management Instrumentation): Used primarily in Windows environments to collect performance data and system information from servers and other Windows-based devices.
Each protocol has its strengths and weaknesses. SNMP is simple but less granular, while NetFlow provides much richer flow data but can be more complex to implement and analyze. Choosing the right protocol depends on specific monitoring requirements and budget.
Q 15. What are your preferred methods for presenting network monitoring data and insights?
My preferred methods for presenting network monitoring data and insights prioritize clarity, conciseness, and actionable intelligence. I avoid overwhelming users with raw data; instead, I focus on visualizing key performance indicators (KPIs) and trends.
Dashboards: I leverage interactive dashboards displaying critical metrics like bandwidth utilization, latency, packet loss, and server uptime. These dashboards use color-coding and visual cues to highlight anomalies or potential problems immediately. For example, a red alert on a server’s CPU utilization exceeding 90% instantly grabs attention.
Reports: For in-depth analysis and trend identification, I generate custom reports. These reports might cover weekly, monthly, or even yearly network performance, detailing changes over time. They can include charts, tables, and summaries. For example, a monthly report could show a gradual increase in latency on a specific link, indicating a potential bottleneck.
Automated Alerts: Proactive alerting is crucial. I configure systems to send notifications only when thresholds are crossed, minimizing alert fatigue while ensuring critical events are addressed promptly. These alerts provide concise summaries of the issue, including affected systems and severity levels.
Custom Views: I understand that different stakeholders have different needs. Therefore, I design dashboards and reports tailored to specific user roles. For example, a network administrator might need detailed traffic flow data, whereas management may prefer a high-level overview of network availability.
Career Expert Tips:
- Ace those interviews! Prepare effectively by reviewing the Top 50 Most Common Interview Questions on ResumeGemini.
- Navigate your job search with confidence! Explore a wide range of Career Tips on ResumeGemini. Learn about common challenges and recommendations to overcome them.
- Craft the perfect resume! Master the Art of Resume Writing with ResumeGemini’s guide. Showcase your unique qualifications and achievements effectively.
- Don’t miss out on holiday savings! Build your dream resume with ResumeGemini’s ATS optimized templates.
Q 16. How do you collaborate with other IT teams to resolve network issues identified through monitoring?
Collaboration is key to resolving network issues. My approach involves a structured process involving clear communication and efficient workflows.
Incident Management System: I utilize a centralized incident management system (e.g., Jira, ServiceNow) to track and manage network issues. This system ensures transparency and accountability across teams.
Cross-Team Communication: I employ multiple communication channels, including dedicated channels in collaboration platforms (e.g., Slack, Microsoft Teams) to rapidly share relevant information with application, security, and server teams. This ensures everyone stays informed.
Regular Meetings: I schedule regular meetings with relevant teams to review recurring issues and implement preventative measures. This proactive approach is crucial for minimizing future disruptions.
Root Cause Analysis: After resolving an issue, I conduct root cause analysis (RCA) to understand the underlying cause and prevent recurrence. This often involves analyzing logs, network traces, and other data. We document findings and share them with relevant teams for improved processes.
Q 17. Describe your experience with creating and managing network monitoring dashboards.
I have extensive experience creating and managing network monitoring dashboards using tools like Grafana, Datadog, and Prometheus. My approach focuses on user experience and data visualization best practices.
Data Selection: I carefully select the most relevant metrics for each dashboard, avoiding information overload. I prioritize KPIs that directly indicate network health and performance.
Visualization Techniques: I employ various visualization techniques, such as charts, graphs, and tables, to present data in an easily digestible format. Color-coding and threshold-based alerts are integral parts of the design.
Customization: Dashboards are customized for different user roles and needs. For example, a security team’s dashboard would focus on security events, while the network team would focus on performance metrics.
Maintenance: Dashboards require ongoing maintenance. I regularly review and update them to reflect changes in the network infrastructure or monitoring requirements. This ensures data accuracy and relevance.
Q 18. How do you handle network outages or significant performance degradations?
Handling network outages or significant performance degradations requires a structured, systematic approach.
Immediate Response: My first step involves acknowledging the alert and assessing the impact of the outage or degradation. This often involves quickly checking the dashboard for clues and affected systems.
Incident Escalation: I escalate the incident to the appropriate team (e.g., NOC, engineering) as needed, based on the severity and impact. The escalation process is clearly defined and documented.
Troubleshooting: I utilize a combination of diagnostic tools (e.g., ping, traceroute, tcpdump) and logs to isolate the root cause. Network topology diagrams and documentation are invaluable during this phase.
Remediation: Once the root cause is identified, I work with the appropriate team to implement a fix. This might involve rerouting traffic, restarting devices, or applying software patches.
Post-Incident Review: Following resolution, I conduct a post-incident review to analyze what happened, identify areas for improvement, and document the steps taken. This ensures that similar incidents are less likely in the future.
Q 19. What is your experience with different alerting methods (email, SMS, PagerDuty, etc.)?
My experience with different alerting methods is broad. The choice of method depends on the severity of the event and the urgency of the response required.
Email: Suitable for less critical alerts or for providing summary reports.
SMS: Ideal for urgent alerts requiring immediate attention, particularly when personnel may not be at their desks. SMS provides concise and immediate communication.
PagerDuty: My preferred platform for managing critical alerts, enabling escalation policies, on-call scheduling, and detailed incident management. This provides a robust and scalable solution for managing high-priority events.
Custom Integrations: I have experience integrating monitoring systems with collaboration tools like Slack or Microsoft Teams. This allows for timely notifications within familiar team communication channels, including the ability to discuss the problem directly within the notification stream.
The key is to configure alerting effectively to minimize alert fatigue while ensuring critical issues are addressed promptly. Careful threshold management is crucial to achieve this balance.
Q 20. How do you integrate network monitoring with other IT management systems?
Integrating network monitoring with other IT management systems is crucial for holistic IT management. I’ve worked with various integrations to streamline workflows and improve visibility.
ITSM Systems (e.g., ServiceNow, Jira): Integrating network monitoring with ITSM platforms enables the automated creation of incidents or tickets when alerts are triggered. This simplifies issue tracking and resolution.
Security Information and Event Management (SIEM): Integrating with SIEM tools enables correlation of network events with security events, providing a more comprehensive view of IT security posture.
Configuration Management Databases (CMDB): Integration with a CMDB allows for automated updates to network device configurations and relationships within the CMDB, providing an always up-to-date view of network infrastructure.
Monitoring Tools (e.g., Nagios, Zabbix): Integrating various monitoring tools into a central dashboard provides a single pane of glass view of the entire IT infrastructure.
API integrations are frequently used to achieve these integrations. For example, many monitoring tools offer APIs to send alerts to ITSM systems or receive configuration updates from CMDBs.
Q 21. Explain your experience with using scripting languages (Python, PowerShell) for network automation and monitoring.
I utilize scripting languages, particularly Python and PowerShell, extensively for network automation and monitoring. This significantly improves efficiency and reduces manual tasks.
Network Device Automation: I’ve used Python to automate tasks like configuring network devices (routers, switches), collecting device statistics, and managing network configurations. This automation ensures consistency and reduces human error. For example, I’ve written scripts to automatically configure VLANs or deploy new network devices.
Data Collection and Analysis: Python and PowerShell are invaluable for collecting data from various sources, including network devices and monitoring tools. This data can then be processed and analyzed to identify trends and patterns. For example, I’ve used Python to parse SNMP data and generate reports on network performance.
Alerting and Notification Systems: I use scripting languages to create custom alerting systems that integrate with email, SMS, or other notification platforms. This allows for tailored alerts based on specific events or thresholds.
Custom Monitoring Tools: I’ve developed custom monitoring tools using Python and PowerShell to address specific needs that weren’t met by existing commercial products. This provides highly customized solutions optimized for our particular environment.
Example Python Script Snippet (Illustrative):
import subprocess

def ping_host(hostname):
    response = subprocess.call(['ping', '-c', '1', hostname])
    if response == 0:
        return True
    else:
        return False
Q 22. Describe your understanding of network protocols (TCP/IP, BGP, OSPF).
Network protocols are the set of rules that govern how data is transmitted across a network. Understanding them is crucial for effective network monitoring. Let’s look at three key protocols:
- TCP/IP (Transmission Control Protocol/Internet Protocol): This is the foundation of the internet. TCP provides reliable, ordered delivery of data, while IP handles the addressing and routing of packets. Think of it like sending a registered letter – TCP ensures it arrives safely and in the right order, while IP provides the address to get it there. Monitoring TCP/IP involves tracking things like packet loss, latency, and throughput.
- BGP (Border Gateway Protocol): This is the routing protocol used between autonomous systems (ASes), essentially different networks like those of different internet service providers. It dynamically exchanges routing information, ensuring data can be routed efficiently between networks. Monitoring BGP means tracking the path of data, identifying potential outages, and ensuring routing stability. Imagine it as the air traffic control for the internet, guiding data packets across vast networks.
- OSPF (Open Shortest Path First): This is an interior gateway protocol used within a single autonomous system to determine the best path for routing data. It uses a link-state algorithm, meaning each router maintains a map of the entire network. Monitoring OSPF involves tracking routing tables, detecting routing loops, and ensuring optimal path selection. Consider it as the internal navigation system within a single large organization’s network, ensuring data flows smoothly within that boundary.
In my experience, proficient monitoring of these protocols involves using network monitoring tools that can capture and analyze traffic at different layers of the network stack, allowing for comprehensive visibility and proactive issue detection.
Q 23. How do you handle situations where network monitoring tools fail?
The failure of network monitoring tools is a critical situation. My approach is multi-layered, emphasizing redundancy and alternative methods:
- Redundancy: I always implement redundant monitoring systems. If one tool fails, another immediately takes over. This could involve using different vendors’ tools or deploying multiple instances of the same tool across different servers.
- Fallback Mechanisms: I establish alternative monitoring techniques that don’t rely on the primary tools. This might involve using simple command-line tools like
pingandtraceroutefor basic connectivity checks or utilizing SNMP (Simple Network Management Protocol) traps to receive alerts directly from network devices. - Automated Alerts: Critical monitoring failures themselves should trigger alerts. This ensures I’m immediately notified if the primary system goes down, allowing me to swiftly address the issue and switch to the backup system.
- Root Cause Analysis: Once the primary system is back online, a thorough root cause analysis is mandatory. This helps prevent similar failures in the future. Is it a hardware issue, software bug, or a configuration problem?
For example, in a previous role, our primary monitoring system experienced a database failure. Our secondary system, based on a different technology, automatically took over, minimizing the impact on our monitoring coverage. The root cause analysis later revealed a misconfiguration in the database replication strategy, which we promptly corrected.
Q 24. What are some common challenges in network monitoring and how have you addressed them?
Common challenges in network monitoring include:
- Alert Fatigue: Too many alerts can lead to analysts ignoring them. I address this by prioritizing alerts based on severity and impact, implementing intelligent alert filtering and consolidation, and using dashboards that visually represent the most critical issues.
- Data Silos: Different monitoring tools often don’t integrate well, leading to incomplete visibility. I tackle this by creating a centralized monitoring system that aggregates data from various sources, using tools like ELK stack (Elasticsearch, Logstash, Kibana) or similar solutions.
- Lack of Context: An alert without context is useless. I address this by enriching alerts with relevant metadata, such as the affected devices, users, or applications. Correlation of events from multiple sources is key here.
- Scalability: As the network grows, monitoring tools need to scale accordingly. I ensure scalability by utilizing tools that can handle large amounts of data and by designing a modular architecture that can easily expand.
For instance, in a past project, we tackled alert fatigue by developing a custom script that automatically suppressed duplicate alerts and clustered similar events, significantly reducing the noise while still maintaining comprehensive monitoring.
Q 25. How do you ensure scalability and maintainability of your network monitoring systems?
Scalability and maintainability are paramount for any network monitoring system. My approach focuses on:
- Modular Design: The system should be built from independent modules, making it easier to upgrade, replace, or scale individual components without affecting the entire system.
- Automation: Automation is key for both scalability and maintainability. Automating tasks such as alert processing, report generation, and system upgrades minimizes manual intervention and reduces errors.
- Centralized Management: A centralized management console provides a single point of control for the entire system, simplifying administration and troubleshooting.
- Containerization and Orchestration: Utilizing containers (Docker) and orchestration tools (Kubernetes) provides enhanced portability, scalability, and efficient resource utilization.
- Infrastructure as Code (IaC): Defining and managing the infrastructure using code (e.g., Terraform, Ansible) allows for consistent, repeatable deployments and facilitates easy scaling.
For example, in one project, we used Ansible to automate the deployment and configuration of our monitoring agents across hundreds of servers, significantly reducing deployment time and ensuring consistency across the environment.
Q 26. What are your experiences with cloud-based network monitoring solutions (AWS CloudWatch, Azure Monitor)?
I have extensive experience with cloud-based network monitoring solutions, primarily AWS CloudWatch and Azure Monitor. Both offer comprehensive monitoring capabilities, but their strengths differ:
- AWS CloudWatch: Excellent for monitoring AWS resources, offering granular metrics, logs, and tracing capabilities. It integrates seamlessly with other AWS services, making it a natural choice for AWS-centric environments. I’ve utilized CloudWatch extensively for monitoring EC2 instances, VPCs, and other AWS services, creating custom dashboards and setting up automated alerts.
- Azure Monitor: Similar comprehensive capabilities, but focused on the Azure ecosystem. It offers robust features for application performance monitoring and log analytics. My experience includes using Azure Monitor to track virtual machines, virtual networks, and Azure application services, creating customized alerts and visualizing performance trends.
The choice between them depends on the cloud provider and specific monitoring requirements. In hybrid environments, integrating both might be necessary for holistic visibility.
Q 27. Describe your experience with implementing and managing network monitoring in a hybrid cloud environment.
Implementing and managing network monitoring in a hybrid cloud environment requires a unified approach that addresses the unique challenges of both on-premises and cloud environments. Key aspects include:
- Centralized Monitoring: A centralized monitoring platform is essential to aggregate data from both on-premises and cloud environments, providing a single pane of glass for visibility.
- Agent Deployment: Monitoring agents need to be deployed consistently across both environments, whether on physical servers, virtual machines, or cloud instances.
- Data Aggregation and Correlation: The platform must efficiently collect, process, and correlate data from diverse sources, including network devices, cloud services, and applications.
- Security Considerations: Security must be a top priority, ensuring secure communication and data protection across both environments.
- Hybrid Cloud Monitoring Tools: Tools specifically designed for hybrid cloud monitoring are beneficial for simplifying the management and providing comprehensive insights.
In a recent project, we utilized a combination of on-premises monitoring tools and cloud-based services (AWS CloudWatch) to monitor a hybrid cloud infrastructure. We used a centralized logging and monitoring platform to aggregate all data and provide a unified view of the entire environment. This approach ensured efficient troubleshooting and proactive issue identification across our hybrid infrastructure.
Q 28. Explain your knowledge of different types of network devices (routers, switches, firewalls) and their monitoring requirements.
Understanding the different types of network devices and their specific monitoring requirements is crucial. Here’s a breakdown:
- Routers: These direct network traffic between networks. Monitoring focuses on CPU utilization, memory usage, routing table stability, interface statistics (bandwidth utilization, packet loss), and BGP sessions (if applicable).
- Switches: These forward traffic within a network. Monitoring priorities include CPU and memory usage, port status (up/down, speed, duplex), MAC address table, and spanning tree protocol (STP) health.
- Firewalls: These control network access. Key monitoring metrics include CPU and memory usage, connection throughput, dropped packets, and firewall rule effectiveness. Logs provide critical insights into security events.
The specific tools and metrics used will vary depending on the device vendor and the complexity of the network. For instance, Cisco devices often use SNMP for monitoring, while other vendors might provide their own proprietary management interfaces. Comprehensive network monitoring requires integrating data from multiple sources to ensure complete visibility.
Key Topics to Learn for Experience with Network Monitoring and Alerting Systems Interview
- Network Monitoring Tools and Technologies: Understanding various monitoring tools (e.g., Nagios, Zabbix, Prometheus, Datadog) and their functionalities, including data collection methods, metrics, and visualization capabilities. Consider exploring open-source vs. commercial options and their respective strengths.
- Alerting System Design and Implementation: Designing effective alerting strategies to minimize noise and maximize the value of alerts. This includes defining thresholds, escalation policies, and notification methods (email, SMS, PagerDuty, etc.). Explore best practices for incident management and response.
- Network Performance Analysis and Troubleshooting: Analyzing network performance data to identify bottlenecks, performance degradation, and potential issues. Discuss practical approaches to troubleshooting network problems using monitoring data, log analysis, and other diagnostic tools.
- Security Monitoring and Threat Detection: Integrating security monitoring into your network monitoring strategy. Discuss intrusion detection/prevention systems (IDS/IPS), security information and event management (SIEM) tools, and how they contribute to overall network security and incident response.
- Log Management and Analysis: Understanding the importance of log aggregation and analysis for troubleshooting and security monitoring. Discuss different log management solutions and techniques for effective log analysis.
- Cloud-Based Monitoring Solutions: Familiarity with cloud-based monitoring services like AWS CloudWatch, Azure Monitor, or Google Cloud Monitoring. Understand how they integrate with on-premises monitoring systems.
- Automation and Scripting: Leveraging scripting languages (e.g., Python, Bash) to automate tasks related to monitoring, alerting, and reporting. This demonstrates your ability to build efficient and scalable solutions.
Next Steps
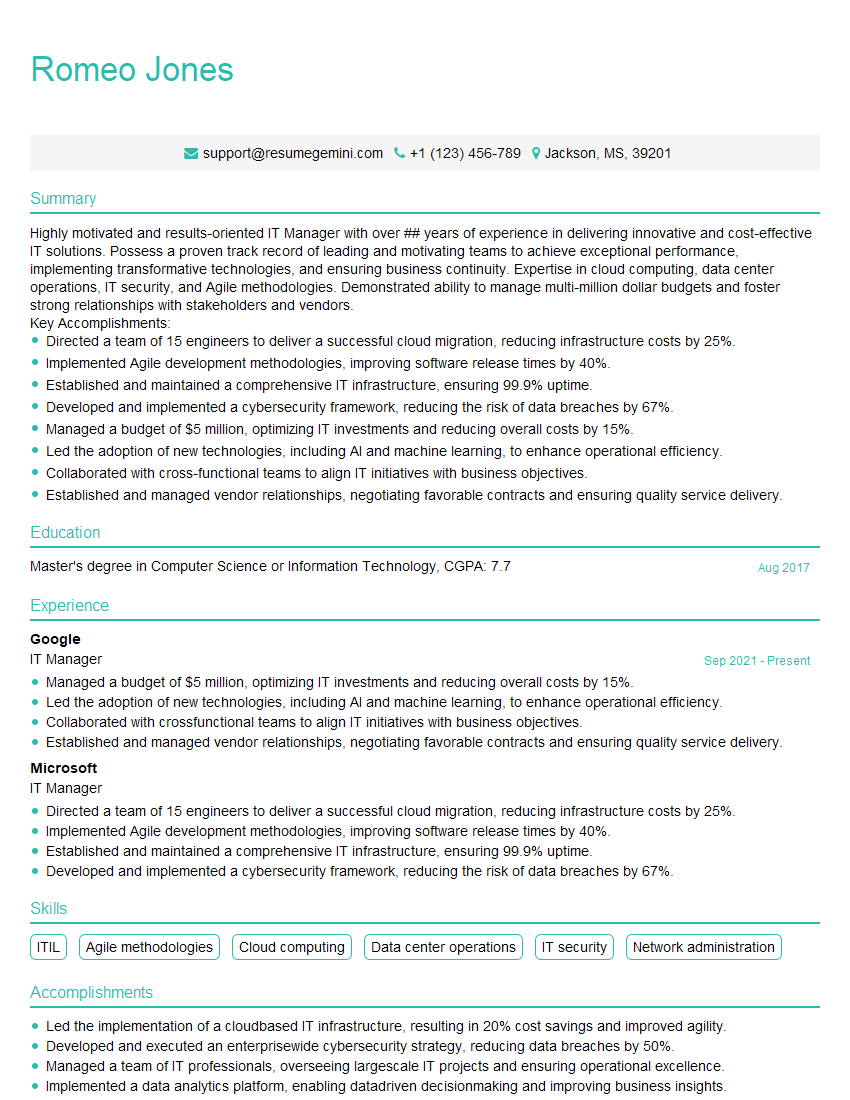
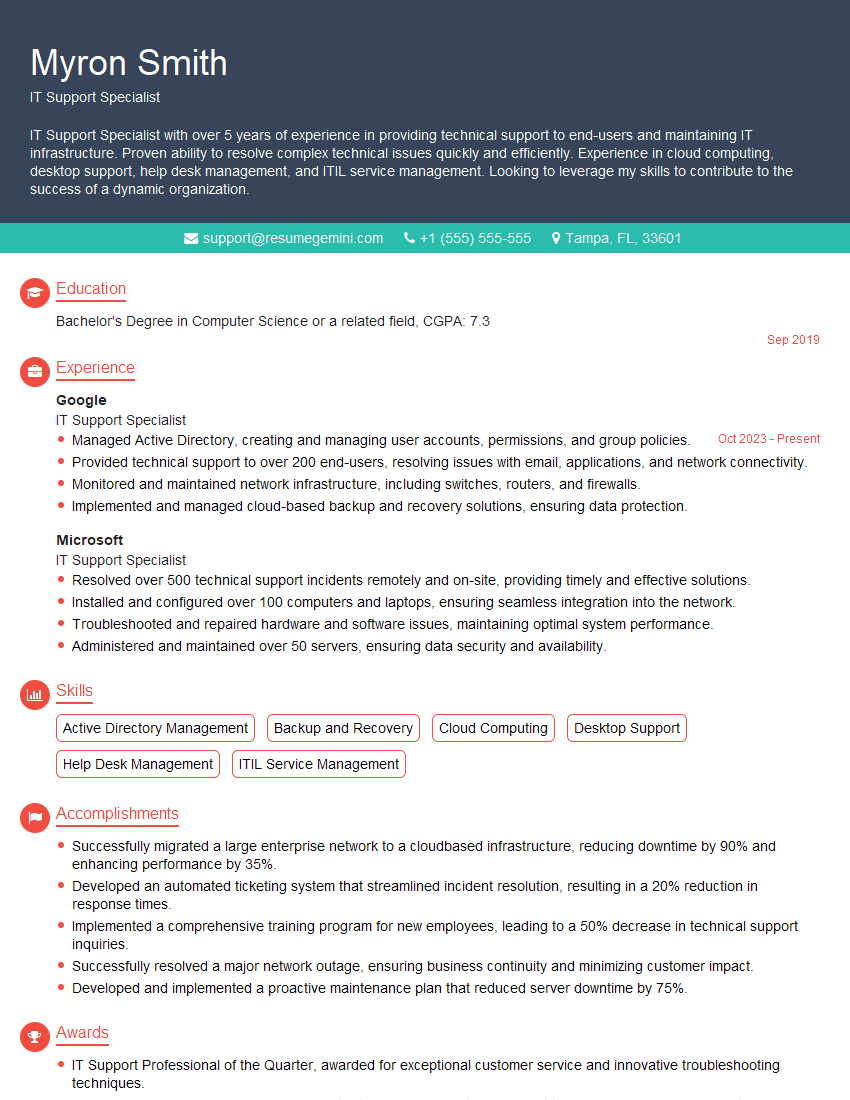
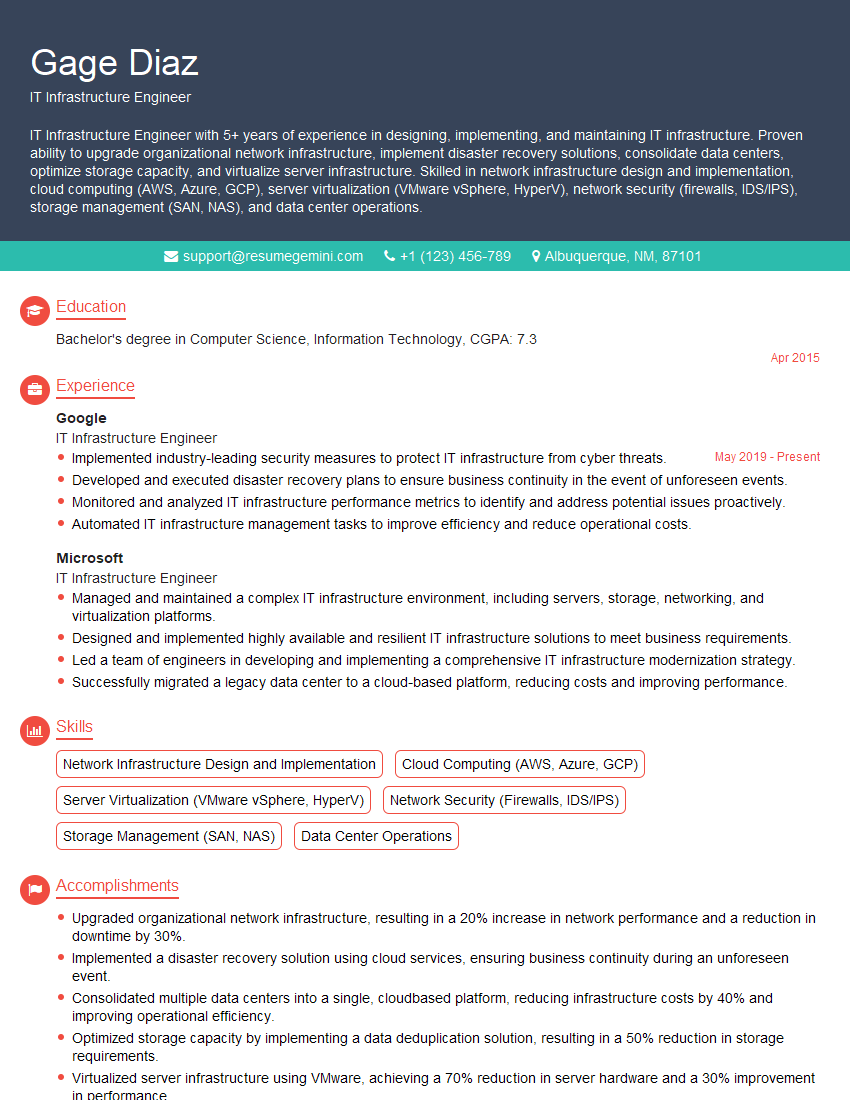
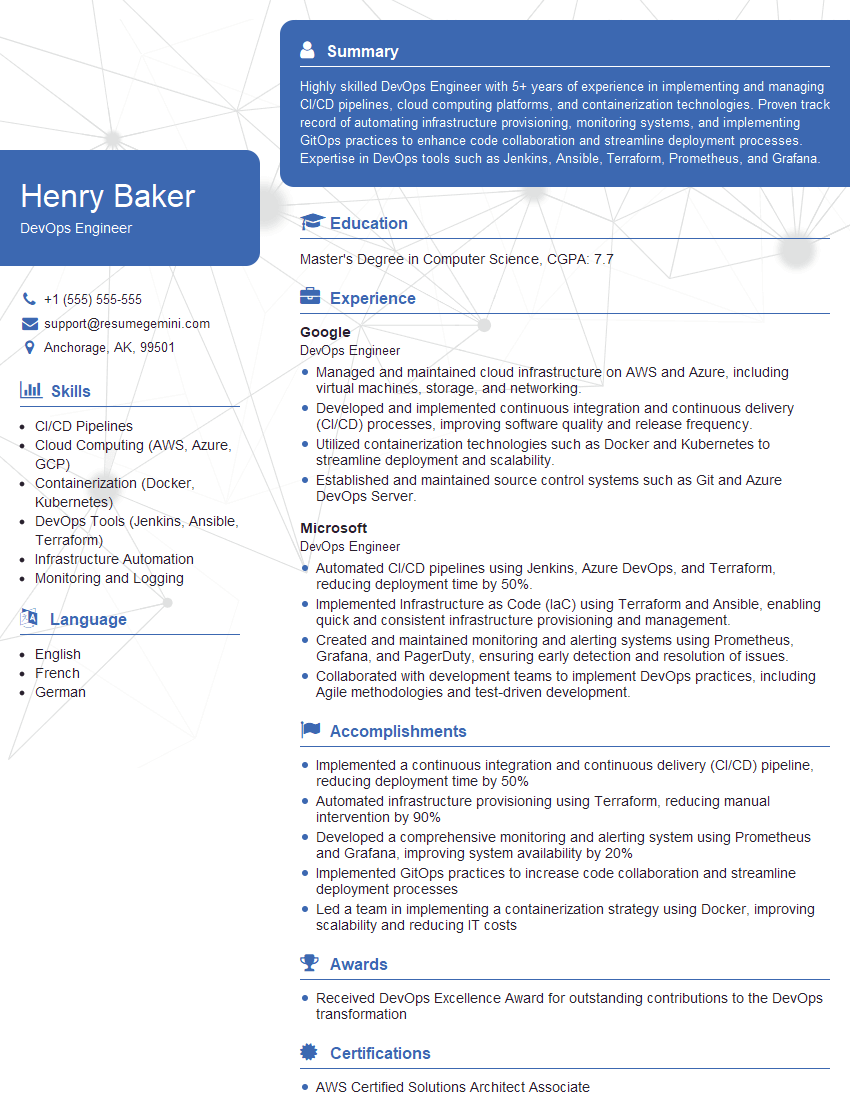
Mastering network monitoring and alerting systems is crucial for a successful career in IT, offering opportunities for growth into senior roles and specialized areas like DevOps and cybersecurity. To significantly enhance your job prospects, invest time in crafting an ATS-friendly resume that effectively showcases your skills and experience. ResumeGemini is a trusted resource that can help you build a compelling and professional resume, optimized to get noticed by recruiters. Examples of resumes tailored to highlight experience with Network Monitoring and Alerting Systems are available to guide you.
Explore more articles
Users Rating of Our Blogs
Share Your Experience
We value your feedback! Please rate our content and share your thoughts (optional).
What Readers Say About Our Blog
Hello,
We found issues with your domain’s email setup that may be sending your messages to spam or blocking them completely. InboxShield Mini shows you how to fix it in minutes — no tech skills required.
Scan your domain now for details: https://inboxshield-mini.com/
— Adam @ InboxShield Mini
Reply STOP to unsubscribe
Hi, are you owner of interviewgemini.com? What if I told you I could help you find extra time in your schedule, reconnect with leads you didn’t even realize you missed, and bring in more “I want to work with you” conversations, without increasing your ad spend or hiring a full-time employee?
All with a flexible, budget-friendly service that could easily pay for itself. Sounds good?
Would it be nice to jump on a quick 10-minute call so I can show you exactly how we make this work?
Best,
Hapei
Marketing Director
Hey, I know you’re the owner of interviewgemini.com. I’ll be quick.
Fundraising for your business is tough and time-consuming. We make it easier by guaranteeing two private investor meetings each month, for six months. No demos, no pitch events – just direct introductions to active investors matched to your startup.
If youR17;re raising, this could help you build real momentum. Want me to send more info?
Hi, I represent an SEO company that specialises in getting you AI citations and higher rankings on Google. I’d like to offer you a 100% free SEO audit for your website. Would you be interested?
Hi, I represent an SEO company that specialises in getting you AI citations and higher rankings on Google. I’d like to offer you a 100% free SEO audit for your website. Would you be interested?
good
