The right preparation can turn an interview into an opportunity to showcase your expertise. This guide to Knowledge of SPC and MSA interview questions is your ultimate resource, providing key insights and tips to help you ace your responses and stand out as a top candidate.
Questions Asked in Knowledge of SPC and MSA Interview
Q 1. Define Statistical Process Control (SPC).
Statistical Process Control (SPC) is a collection of statistical methods used to monitor and control a process to ensure it operates at its best. Think of it as a system of checks and balances for your manufacturing or service process. It involves collecting data, analyzing it for trends and patterns, and using that information to identify and address sources of variation. The ultimate goal is to improve process capability, reduce defects, and increase efficiency. It’s not just about fixing problems after they occur, but preventing them in the first place.
Q 2. Explain the purpose of control charts in SPC.
Control charts are the heart of SPC. They are graphical tools that visually display data collected from a process over time. By plotting these data points, we can see if the process is stable and predictable, or if something is causing unexpected variation. Essentially, they act as a visual alarm system, alerting us to potential problems before they cause significant defects or disruptions. They allow us to distinguish between random, common cause variation and non-random, special cause variation, guiding decision-making for process improvement.
Q 3. What are the common types of control charts and when would you use each?
There are many types of control charts, but some of the most common include:
- X-bar and R chart: Used for continuous data (e.g., weight, length, temperature), monitoring both the average and the range of the data. This is a great starting point for many processes.
- X-bar and s chart: Similar to X-bar and R, but uses standard deviation (s) instead of range (R). This is preferred when sample sizes are larger (typically n>10).
- Individuals and moving range (I-MR) chart: Used when individual measurements are taken and subgrouping is impractical or unnecessary.
- p-chart: Used for attribute data (e.g., pass/fail, defective/non-defective), representing the proportion of defective items in a sample.
- c-chart: Used for attribute data, representing the number of defects per unit.
- u-chart: Similar to c-chart, but it accounts for variable sample sizes. It tracks the average number of defects per unit.
The choice of chart depends entirely on the type of data you’re collecting and the nature of your process. If you’re measuring the weight of a product, for example, X-bar and R charts are perfect. If you’re counting defects, a p-chart or c-chart might be more appropriate.
Q 4. Describe the difference between common cause and special cause variation.
Common cause variation is the inherent variability in a process that’s always present. It’s the background noise – think of the slight variations in temperature throughout the day. It’s random and predictable, and it’s typically within the control limits of a control chart. We can’t eliminate common cause variation completely, but we can reduce it through process improvements. Special cause variation, on the other hand, is unexpected and significant variation that indicates a problem has occurred – a sudden spike in temperature. It’s not part of the normal process behavior, and it usually falls outside the control limits of a control chart. This needs to be investigated and addressed.
Q 5. How do you interpret control chart signals (e.g., points outside control limits, trends)?
Control chart signals indicate something is amiss with the process. Common signals include:
- Points outside the control limits: This is a strong indication of special cause variation and requires immediate investigation to find and eliminate the root cause. Think of it as a red flag.
- Trends: A consistent upward or downward trend suggests a gradual shift in the process, even if points stay within the control limits. It indicates a potential problem developing and needs attention.
- Stratification: Noticeable patterns or clustering of points indicate that other factors might be influencing your process.
- Runs: A series of consecutive points above or below the central line suggests a shift in the process average.
Investigating these signals is critical. Ignoring them could lead to more defects and potentially a complete process failure.
Q 6. Explain the process of constructing a control chart (X-bar and R chart).
Constructing an X-bar and R chart involves these steps:
- Define the process and data to be collected: Clearly identify the characteristic you want to monitor and the sampling method.
- Collect data: Gather at least 20-25 subgroups of data, each with a consistent sample size (e.g., 4 or 5 measurements per subgroup).
- Calculate statistics: For each subgroup, calculate the average (X-bar) and the range (R).
- Calculate control limits: Use appropriate formulas (depending on sample size) based on the average of the X-bars and the average of the ranges to determine the upper and lower control limits for both the X-bar chart and the R chart. These formulas involve control chart constants (A2, D3, D4) that are readily available in statistical tables.
- Plot the data: Plot the X-bar values on the X-bar chart and the R values on the R chart. Add the center lines (average X-bar and average R) and upper and lower control limits to both charts.
- Analyze the chart: Look for any points outside the control limits or other patterns that indicate special cause variation.
For example, let’s say we’re monitoring the diameter of a manufactured part. We collect 25 samples of 5 measurements each. We’d calculate the average diameter (X-bar) and range (R) for each subgroup. Then, using standard formulas, we determine the control limits and plot everything. The resulting chart helps determine if the diameter is consistently within acceptable tolerances.
Q 7. What are the assumptions of control chart analysis?
Control chart analysis relies on several assumptions:
- Data are independent: One data point shouldn’t influence another.
- Data are normally distributed: While not strictly required, it’s desirable as it helps with accurate interpretation of the control limits. However, control charts are robust and can still be useful with non-normal data, especially when dealing with larger sample sizes.
- Process is stable (or at least in a state of statistical control) during the data collection period: This is so that the control limits truly reflect the inherent variation of the process. Otherwise, you’re building control limits on unstable data.
- Common cause variation is constant: The underlying variability of the process doesn’t change drastically during the collection period.
- Data are collected using a rational subgrouping scheme: Samples should be collected in a way that best highlights the process variation – that is, samples collected within a short time interval.
Violating these assumptions can lead to misinterpretations. For instance, if data are not independent (e.g., consecutive measurements are correlated), the control chart may incorrectly signal out-of-control points.
Q 8. How do you handle outliers in control chart data?
Outliers in control chart data represent data points significantly deviating from the established pattern. Handling them requires careful investigation, not automatic removal. Simply discarding outliers without understanding the cause masks potential problems.
My approach involves a systematic process:
- Identify potential outliers: Use visual inspection of the control chart, looking for points beyond the control limits (typically 3 standard deviations from the central line). Statistical methods like the Grubbs’ test can also be used for more rigorous identification.
- Investigate the cause: This is crucial. Was there a special cause of variation (e.g., equipment malfunction, operator error, incorrect measurement)? Document the details. If the cause is identified and corrected, the outlier may not need further action beyond documentation.
- Assess the impact: If the cause is unknown, the impact on the process must be considered. A single outlier might not be significant; a cluster of outliers indicates a more serious issue. A run chart helps visualize trends.
- Re-analyze data: If a valid cause is found and addressed, the data might be re-analyzed after removing the offending data point. However, remember this only if it’s clear that the point is an error, not part of the process variation.
- Document findings: Thorough documentation of the outlier, its cause, and the corrective actions taken is essential for continuous improvement.
Example: Imagine a control chart monitoring the weight of a product. A single data point far outside the upper control limit is detected. Upon investigation, it’s discovered a faulty scale was used for that measurement. The scale is replaced, and the data point is noted, but not included in future analyses.
Q 9. What is Measurement System Analysis (MSA)?
Measurement System Analysis (MSA) is a structured process to evaluate the accuracy and precision of a measurement system. It quantifies the variation introduced by the measurement process itself, separating it from the inherent variation in the product or process being measured. This is essential to ensure that the data collected is reliable and supports informed decision-making.
Think of it like this: If you’re measuring the length of a part, MSA helps determine how much of the variation in your measurements comes from the part itself versus how much comes from the measuring tool, the operator using the tool, or even environmental factors.
Q 10. Why is MSA important in quality control?
MSA is crucial in quality control because unreliable measurements lead to flawed conclusions and ineffective actions. If your measurement system is poor, you may incorrectly identify a process as out of control, or conversely, fail to detect a real problem. MSA ensures that decisions made based on measurement data are trustworthy.
For instance, rejecting perfectly good products due to inaccurate measurements results in unnecessary scrap and cost. Conversely, accepting defective products because of measurement inaccuracies risks customer dissatisfaction and potential safety issues.
Q 11. Explain the different types of MSA studies (e.g., Gauge R&R, GR&R, Attribute Agreement Analysis).
Several types of MSA studies exist, catering to different measurement scales:
- Gauge R&R (Gauge Repeatability and Reproducibility): This is the most common MSA study, used for continuous (variable) data. It assesses the variation in measurements due to repeatability (variation within a single operator using the same gauge) and reproducibility (variation between different operators using the same gauge). It also assesses the variation in the part itself.
- Attribute Agreement Analysis: This is used for discrete (attribute) data, such as ‘pass/fail’ judgments. It assesses the agreement between different inspectors or measurement methods classifying items. Kappa analysis is a common statistical technique used here.
- Other types: Other MSA studies exist, like bias studies (assessing systematic error) and stability studies (assessing the drift of the measurement system over time).
The choice of MSA study depends entirely on the type of data you’re collecting.
Q 12. What are the key components of a Gauge R&R study?
Key components of a Gauge R&R study include:
- Operators: The individuals performing the measurements. Multiple operators are included to assess reproducibility.
- Parts: A representative sample of the parts being measured, reflecting the expected range of variation.
- Repetitions: Each operator measures each part multiple times to assess repeatability. Typically 2-3 repetitions are performed.
- Measurement System: The gauge, tool, or method used for the measurement.
- Statistical Analysis: ANOVA (Analysis of Variance) is commonly used to partition the total variation into components due to the part, operator, and gauge.
Careful selection of these components ensures that the results accurately reflect the measurement system’s capabilities.
Q 13. How do you calculate %Contribution to total variation in a Gauge R&R study?
The %Contribution to total variation in a Gauge R&R study is calculated for each source of variation (part-to-part, operator-to-operator, and repeatability). The ANOVA table provides the variance components (sums of squares divided by degrees of freedom). The percentage contribution of each source is calculated as:
%Contribution = (Variance Component / Total Variance) * 100
For example, if the variance due to repeatability is 0.5, the variance due to reproducibility is 1, and the variance due to the part is 10, the total variance is 11.5. The percentage contribution of repeatability would be (0.5/11.5)*100 ≈ 4.35%. Similarly, the contribution of reproducibility would be (1/11.5)*100 ≈ 8.7% and the contribution of the part would be (10/11.5)*100 ≈ 87%.
Q 14. How do you interpret the results of a Gauge R&R study?
Interpretation of a Gauge R&R study focuses on the %Contribution of each variation source. The goal is to ensure that the measurement system’s variation is significantly smaller than the part-to-part variation. Commonly used benchmarks include:
- %Contribution of Gauge R&R < 10%: Generally acceptable. The measurement system is contributing minimally to the overall variation.
- %Contribution of Gauge R&R 10-30%: Marginally acceptable. Requires investigation and potential improvement.
- %Contribution of Gauge R&R > 30%: Unacceptable. The measurement system is a major source of variation and needs significant improvement.
Beyond percentages, examine the individual components (repeatability and reproducibility). High repeatability means the gauge is consistent, while high reproducibility means different operators get similar results. Addressing the largest contributors, whether it be operator training, improved equipment or a different measurement process, allows for process optimization.
Q 15. What are acceptable levels of Gage R&R variation?
Acceptable Gage R&R variation is generally expressed as a percentage of the total variation. The goal is to minimize the measurement system variation so that it contributes insignificantly to the overall process variation. A commonly used rule of thumb is that Gage R&R should account for no more than 10% of the total variation. However, this is a guideline, not a strict rule. The acceptable level depends heavily on the context. For critical applications with tight tolerances, a much lower percentage (e.g., 5% or even less) might be required. For less critical applications, a higher percentage might be tolerable. It’s crucial to consider the process capability and the specifications of the product. A high percentage Gage R&R on a process already struggling to meet specifications is unacceptable, even if it’s technically below 10%. Conversely, a 15% Gage R&R might be acceptable for a process that consistently exceeds specifications by a large margin. The best approach is to consider the percentage alongside the study’s other metrics (Repeatability, Reproducibility, and Bias) and the overall process performance.
Career Expert Tips:
- Ace those interviews! Prepare effectively by reviewing the Top 50 Most Common Interview Questions on ResumeGemini.
- Navigate your job search with confidence! Explore a wide range of Career Tips on ResumeGemini. Learn about common challenges and recommendations to overcome them.
- Craft the perfect resume! Master the Art of Resume Writing with ResumeGemini’s guide. Showcase your unique qualifications and achievements effectively.
- Don’t miss out on holiday savings! Build your dream resume with ResumeGemini’s ATS optimized templates.
Q 16. What are the different types of measurement errors?
Measurement errors can be broadly classified into two categories: random errors and systematic errors.
- Random Errors: These are unpredictable variations that occur during measurement. They are caused by factors that are difficult or impossible to control completely, like slight variations in the measuring instrument, operator inconsistencies, or environmental fluctuations (temperature, humidity). Random errors are usually normally distributed and tend to cancel each other out over multiple measurements. Imagine trying to hit the bullseye on a dartboard. Even a skilled player might have some darts slightly off the center due to random factors.
- Systematic Errors: These are consistent, repeatable errors that are caused by a predictable source. They introduce a constant bias into the measurements. Examples include miscalibration of the instrument, incorrect measurement techniques, or environmental factors that consistently affect the measurement. Think of the dartboard being slightly tilted—all darts will consistently miss the bullseye in a predictable way.
Further, we can categorize measurement errors based on their source:
- Appraiser Error: Variations caused by different operators using the same instrument and measuring the same part. This contributes to reproducibility.
- Part-to-Part Variation: The natural variation inherent within the parts being measured.
- Equipment Variation: Variations in measurement caused by the measuring instrument itself. This contributes to repeatability.
Q 17. Describe the difference between precision and accuracy in measurement.
Accuracy refers to how close a measurement is to the true value. Think of it as ‘hitting the target.’ A highly accurate measurement system consistently provides readings that are close to the true value of the characteristic being measured. Precision refers to how close repeated measurements of the same item are to each other. It’s about ‘consistency.’ A precise measurement system provides consistent readings, even if those readings aren’t close to the true value. An analogy would be a rifle shooter: high accuracy means consistently hitting the bullseye; high precision means consistently hitting the same spot on the target, regardless of whether it’s the bullseye.
You can have high precision but low accuracy (consistent but wrong) or high accuracy but low precision (inconsistent but around the true value), and ideally you want both!
Q 18. Explain how to calculate reproducibility and repeatability in a Gauge R&R study.
Reproducibility and repeatability are calculated as part of a Gage R&R study, typically using ANOVA (Analysis of Variance). The study involves multiple appraisers measuring multiple parts multiple times. The software (like Minitab or JMP) then calculates the variance components. It’s important to use appropriate software to handle the statistical complexities involved.
Repeatability (EV): This represents the variation due to the measurement system itself when used by a single appraiser. It’s the variation you’d see if one person measured the same part many times. It’s calculated from the within-appraiser variation.
Reproducibility (AV): This represents the variation between different appraisers using the same measurement system on the same part. It reflects the differences in how different people use the instrument. It’s calculated from the between-appraiser variation.
The formulas themselves are complex and best left to statistical software, but the interpretation is crucial. High repeatability or reproducibility indicates a problem with the measurement system. Software will usually provide these values, along with %GRR (Gauge Repeatability and Reproducibility) and other relevant metrics.
Q 19. How do you assess the linearity of a measurement system?
Linearity assesses whether the measurement system shows a consistent relationship between the measured value and the true value across the entire range of measurement. A non-linear measurement system may produce accurate measurements in the middle of the range but increasingly inaccurate measurements at the extremes.
To assess linearity, you need to measure a set of parts with known values spanning the entire measurement range. You then plot the measured values versus the known values. A linear regression is typically performed on this data. The deviation between the regression line and the actual measured values indicates the extent of non-linearity. Significant deviations from linearity suggest that the measurement system is not suitable for the entire range of interest.
Several software packages and statistical methods, such as analysis of variance (ANOVA), are available to quantify linearity statistically.
Q 20. How do you assess the stability of a measurement system?
Stability refers to the consistency of the measurement system over time. A stable system produces consistent measurements when used repeatedly over a period, even without recalibration. To assess stability, you should measure a set of reference parts (preferably those that represent the typical range of expected values) multiple times at different points in time. You then analyze the measurements to determine if there is a significant shift in the average value or variation over time. Control charts (such as X-bar and R charts) are commonly used to visually monitor the stability and detect any out-of-control points indicating shifts or increases in variability. Statistical process control (SPC) methods can be used to quantify this drift statistically.
Q 21. What is the difference between precision and bias?
Precision, as discussed earlier, refers to the closeness of repeated measurements to each other. It reflects the variability of the measurement system. Bias, on the other hand, refers to the systematic deviation of the measurements from the true value. It’s a measure of accuracy. A measurement system can be precise but biased (consistent, but consistently wrong) or imprecise and unbiased (inconsistent, but on average correct).
Imagine shooting darts. High precision means all darts are clustered together. High bias means the cluster is far from the bullseye. Low precision means the darts are scattered all over the board. Low bias means the center of the dart cluster is close to the bullseye.
Q 22. How would you address a measurement system with poor precision?
Poor precision in a measurement system means the measurements are scattered, even when measuring the same item repeatedly. Think of it like trying to hit a bullseye with a dart – poor precision means your darts are spread widely across the board, not clustered near the center. To address this, we need to identify and reduce the sources of variation.
- Improve the Measurement Instrument: This might involve calibration, repair, or even replacement of the instrument. A worn-out micrometer, for example, won’t provide consistent readings.
- Refine the Measurement Technique: Proper training of operators is crucial. Consistent techniques, like applying the same amount of pressure when using a gauge, minimize variability. We might also need to standardize the measurement process using documented procedures.
- Reduce Environmental Variation: Factors like temperature, humidity, and vibrations can affect precision. Controlling these environmental factors in the measurement area can significantly improve the results.
- Gauge Repeatability and Reproducibility (GR&R) Study: A GR&R study helps quantify the variation due to the measurement system itself. It identifies if the variation is primarily from the gauge or the operator.
For instance, in a manufacturing plant producing precision screws, we found poor precision in measuring the diameter using a hand-held caliper. We implemented a GR&R study, retrained operators, and switched to a more precise digital caliper with a stand to reduce operator variability. This significantly reduced the scatter in our measurements.
Q 23. How would you address a measurement system with significant bias?
Significant bias in a measurement system means the measurements consistently deviate from the true value. Imagine a scale that consistently reads 2 pounds heavier than the actual weight – that’s bias. Addressing bias requires identifying and correcting the systematic error.
- Calibration: Regularly calibrating measurement instruments against a known standard is critical. This corrects for any drift or offset in the instrument.
- Compare to a Reference Standard: Measuring the same items with a known accurate reference standard can reveal the magnitude and direction of bias.
- Adjust the Measurement System: If the bias is consistent and predictable, we can apply a correction factor. For example, if a scale consistently reads 2 pounds high, we can subtract 2 pounds from all readings.
- Investigate Systematic Errors: A thorough investigation is needed to determine the root cause of the bias. This could involve examining the instrument, the measurement process, or environmental factors.
In one project, we found a significant bias in measuring the thickness of a coating using a specific type of gauge. After calibration, the bias was still present. Further investigation revealed that the gauge was designed for a different type of coating. Switching to a suitable gauge resolved the issue.
Q 24. Explain the concept of process capability.
Process capability describes the inherent variability of a process compared to its specification limits. It answers the question: “How well is the process performing relative to customer requirements?” A highly capable process consistently produces outputs within the specified tolerances, while a poorly capable process generates a significant amount of non-conforming product.
We use process capability indices, such as Cp and Cpk, to quantify this. These indices compare the process spread (usually measured by the standard deviation) to the tolerance width (the difference between the upper and lower specification limits). A higher index value indicates a more capable process. Imagine baking cookies – a highly capable process would consistently produce cookies within the desired size and weight, while a poorly capable process would result in cookies of varying sizes and weights, potentially exceeding or falling short of the desired specifications.
Q 25. How do you calculate Cp and Cpk?
Cp and Cpk are calculated using the process standard deviation (σ) and the specification limits (USL and LSL – Upper and Lower Specification Limits):
- Cp (Process Capability Index):
Cp = (USL - LSL) / (6σ)Cp measures the potential capability of the process, assuming the process is centered on the target. - Cpk (Process Capability Index):
Cpk = min[(USL - μ) / (3σ), (μ - LSL) / (3σ)]Cpk considers both the process capability and its centering. μ represents the process mean.
Let’s say we’re manufacturing bolts with a target diameter of 10mm and specification limits of 9.8mm and 10.2mm. After collecting data, we find a standard deviation (σ) of 0.05mm and a process mean (μ) of 10.05mm.
Calculating Cp: Cp = (10.2 - 9.8) / (6 * 0.05) = 1.33
Calculating Cpk: Cpk = min[(10.2 - 10.05) / (3 * 0.05), (10.05 - 9.8) / (3 * 0.05)] = min[0.999, 1.66] = 0.999
Here, Cp indicates good potential capability, but Cpk reveals that the process is slightly off-center, limiting its actual capability.
Q 26. What are the limitations of Cp and Cpk?
Cp and Cpk have several limitations:
- Assumption of Normality: Cp and Cpk calculations assume the process data follows a normal distribution. If the data isn’t normally distributed, the indices might be misleading.
- Short-Term vs. Long-Term Capability: Cp and Cpk typically reflect short-term process capability. Long-term capability might be influenced by factors such as shifts in the mean, equipment wear, or changes in raw materials.
- Focus on Specification Limits Only: Cp and Cpk don’t consider customer satisfaction or other quality characteristics beyond specification limits.
- Not Suitable for All Processes: Some processes, such as those with high variability or non-continuous data, may not be suitable for Cp and Cpk analysis.
For instance, in a project involving the manufacturing of printed circuit boards, we found that the Cp and Cpk values were quite high initially, suggesting a capable process. However, a further analysis of the data showed significant non-normality, so the initial Cp and Cpk values were deemed unreliable. We used alternative capability indices better suited for non-normal data.
Q 27. Describe your experience with implementing SPC and MSA in a manufacturing setting.
In my previous role at a medical device manufacturing company, I played a key role in implementing SPC and MSA. We initially struggled with high defect rates in a critical component assembly process. We started by conducting a thorough MSA using gauge repeatability and reproducibility (GR&R) studies on the measurement tools used to inspect the finished components. This revealed significant variations introduced by the measurement process itself, which were impacting our defect rates. After addressing the measurement system issues (through operator training and gauge replacement), we implemented SPC charts to monitor the key process parameters in real time. This gave us the ability to detect process shifts early on, preventing large batches of non-conforming product. We used control charts (X-bar and R charts, for example) to track critical dimensions and defect rates. This facilitated the identification of assignable causes of variation, and allowed for timely corrective actions to be put into place. As a result, we significantly reduced our defect rates and improved overall product quality.
Q 28. How do you use SPC and MSA data to drive continuous improvement?
SPC and MSA data are invaluable tools for driving continuous improvement. Here’s how:
- Identifying and Reducing Variation: SPC charts clearly visualize process variation, highlighting areas needing attention. MSA studies identify variation due to measurement systems. By addressing both process and measurement variation, we can improve consistency and reduce defects.
- Root Cause Analysis: Unusual patterns or data points on SPC charts indicate potential problems. We use tools like 5 Whys and fishbone diagrams to investigate the root causes of these issues. For example, an upward trend on a control chart might signal tool wear or a change in raw materials.
- Process Optimization: Once root causes are identified, we can implement corrective actions and monitor their effectiveness using SPC charts. This allows for iterative improvement and process optimization.
- Data-Driven Decision Making: SPC and MSA data provide objective evidence for decision making. Instead of relying on assumptions, we use data to guide improvements, resulting in more effective and efficient solutions.
For example, in the medical device company, we consistently found high variation in a particular assembly step indicated by the SPC chart. A root cause analysis revealed an issue with the jigs used. Implementing new jigs eliminated the variation, increasing efficiency and quality.
Key Topics to Learn for Knowledge of SPC and MSA Interviews
- Statistical Process Control (SPC): Understanding control charts (X-bar and R, X-bar and s, p, np, c, u), process capability analysis (Cp, Cpk, Pp, Ppk), and the interpretation of control chart patterns. Focus on the practical application of these tools in identifying and addressing process variation.
- Measurement System Analysis (MSA): Grasping the concepts of Gage R&R studies (including ANOVA methods), bias, linearity, stability, and repeatability and reproducibility (R&R). Be prepared to discuss how MSA ensures the accuracy and reliability of measurement data used in SPC.
- Process Improvement Methodologies: Familiarize yourself with how SPC and MSA integrate with lean manufacturing principles and other process improvement methodologies like DMAIC (Define, Measure, Analyze, Improve, Control). Understanding the iterative nature of process improvement is crucial.
- Data Analysis and Interpretation: Develop strong skills in interpreting statistical data, identifying trends, and drawing meaningful conclusions. Practice analyzing hypothetical scenarios and explaining your findings clearly and concisely.
- Software Proficiency: Demonstrate familiarity with statistical software packages commonly used for SPC and MSA (e.g., Minitab, JMP). Be ready to discuss your experience with data input, analysis, and report generation.
- Root Cause Analysis: Practice identifying the root causes of process variation using tools such as fishbone diagrams (Ishikawa diagrams) and Pareto charts. This demonstrates your problem-solving capabilities.
Next Steps
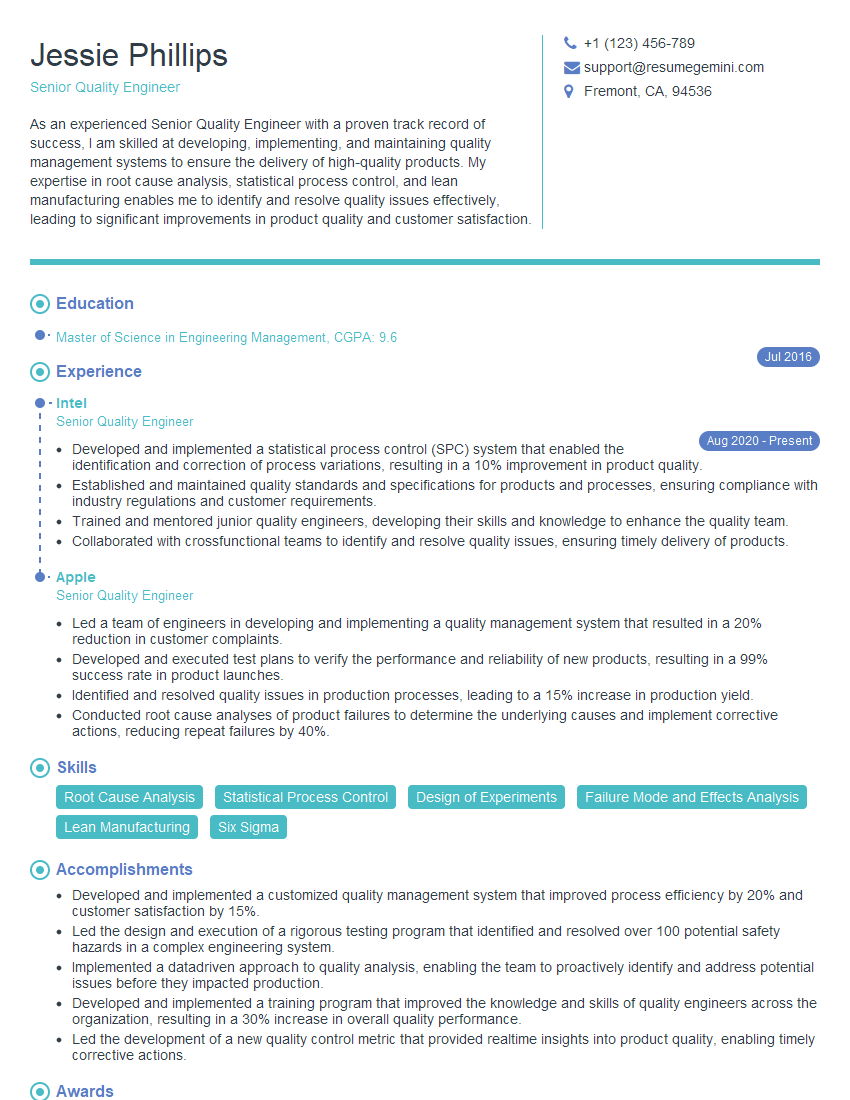
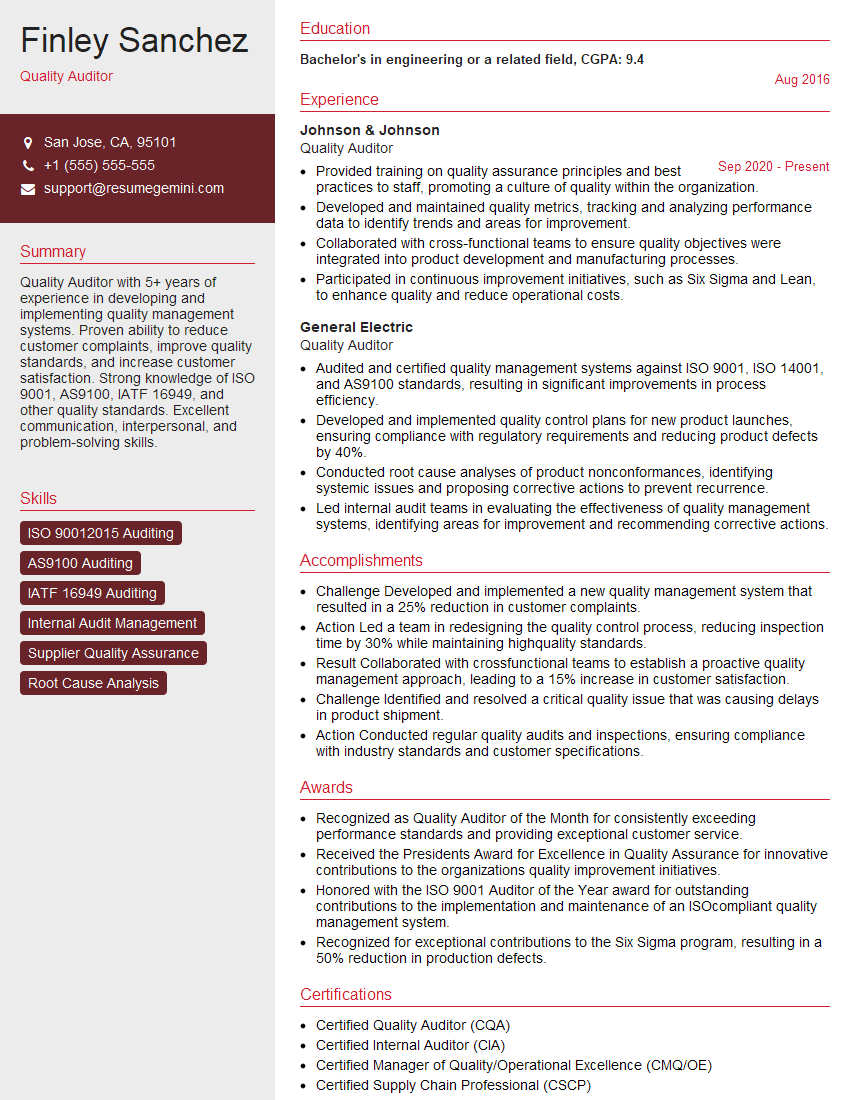
Mastering SPC and MSA is vital for career advancement in quality control, manufacturing, and related fields. These skills demonstrate your ability to analyze data, solve problems, and drive continuous improvement, making you a highly valuable asset to any organization. To maximize your job prospects, invest time in crafting a strong, ATS-friendly resume that highlights your relevant skills and experience. ResumeGemini is a trusted resource that can help you build a professional and impactful resume tailored to your specific skills and experience. Examples of resumes tailored to showcasing Knowledge of SPC and MSA are available to guide you.
Explore more articles
Users Rating of Our Blogs
Share Your Experience
We value your feedback! Please rate our content and share your thoughts (optional).
What Readers Say About Our Blog
Hello,
We found issues with your domain’s email setup that may be sending your messages to spam or blocking them completely. InboxShield Mini shows you how to fix it in minutes — no tech skills required.
Scan your domain now for details: https://inboxshield-mini.com/
— Adam @ InboxShield Mini
Reply STOP to unsubscribe
Hi, are you owner of interviewgemini.com? What if I told you I could help you find extra time in your schedule, reconnect with leads you didn’t even realize you missed, and bring in more “I want to work with you” conversations, without increasing your ad spend or hiring a full-time employee?
All with a flexible, budget-friendly service that could easily pay for itself. Sounds good?
Would it be nice to jump on a quick 10-minute call so I can show you exactly how we make this work?
Best,
Hapei
Marketing Director
Hey, I know you’re the owner of interviewgemini.com. I’ll be quick.
Fundraising for your business is tough and time-consuming. We make it easier by guaranteeing two private investor meetings each month, for six months. No demos, no pitch events – just direct introductions to active investors matched to your startup.
If youR17;re raising, this could help you build real momentum. Want me to send more info?
Hi, I represent an SEO company that specialises in getting you AI citations and higher rankings on Google. I’d like to offer you a 100% free SEO audit for your website. Would you be interested?
Hi, I represent an SEO company that specialises in getting you AI citations and higher rankings on Google. I’d like to offer you a 100% free SEO audit for your website. Would you be interested?
good

