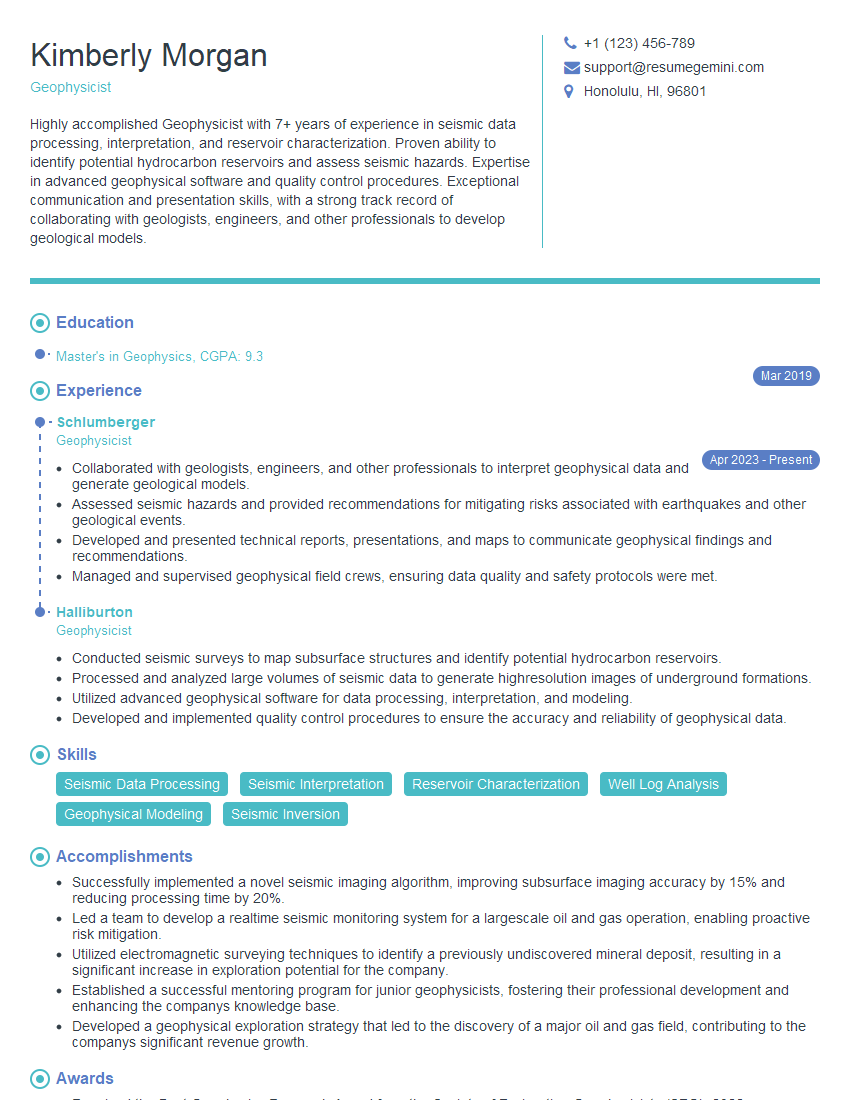
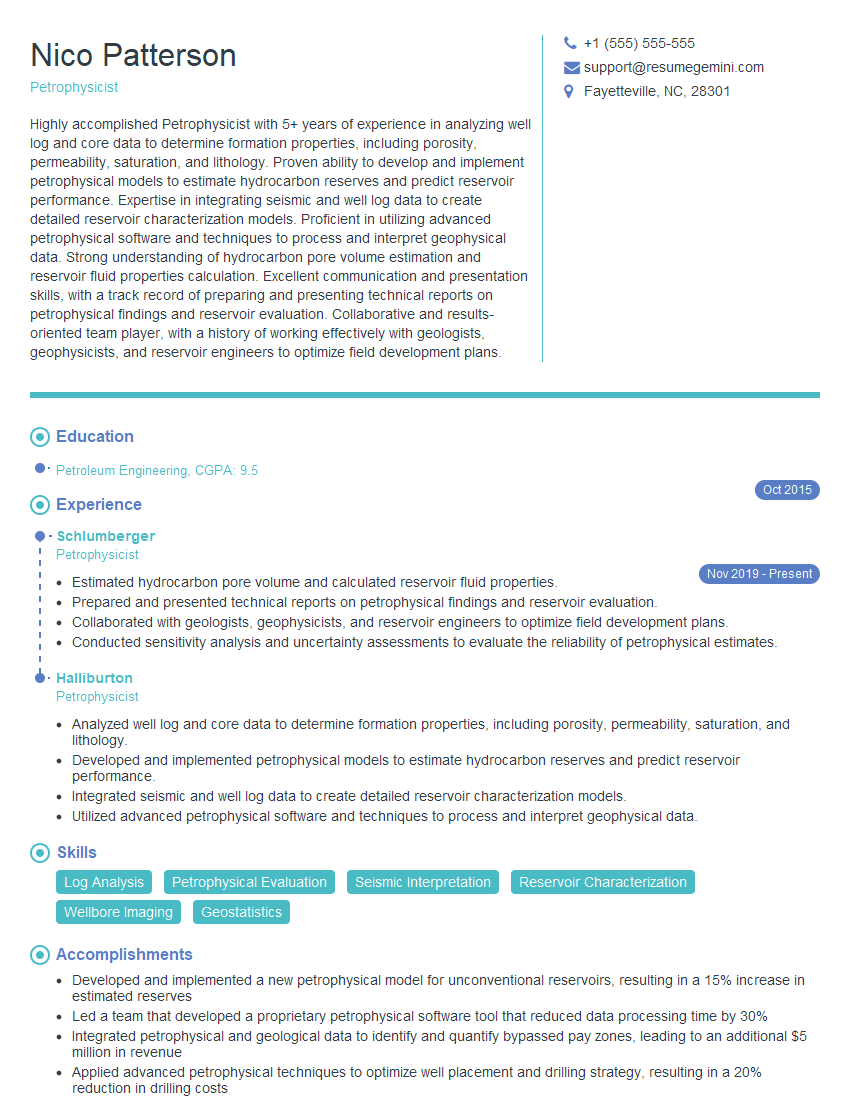
Are you ready to stand out in your next interview? Understanding and preparing for Knowledge of Wellbore Data Processing and Interpretation interview questions is a game-changer. In this blog, we’ve compiled key questions and expert advice to help you showcase your skills with confidence and precision. Let’s get started on your journey to acing the interview.
Questions Asked in Knowledge of Wellbore Data Processing and Interpretation Interview
Q 1. Explain the different types of well logs and their applications.
Well logs are measurements taken within a borehole that provide valuable information about the subsurface formations. They’re essentially ‘fingerprints’ of the rock and fluids encountered during drilling. Different types of logs measure different properties.
- Gamma Ray (GR): Measures natural radioactivity. High GR indicates shale (clay-rich), while low GR suggests sandstone or other cleaner formations. Think of it like a ‘muddy-ness’ sensor. High GR values are often associated with impermeable layers.
- Neutron Porosity (NPHI): Measures the hydrogen index, which is closely related to porosity. It bounces neutrons off atomic nuclei, and the response is sensitive to the presence of hydrogen in pore spaces filled with water or hydrocarbons. More hydrogen, higher porosity.
- Density Porosity (RHOB): Measures the bulk density of the formation. By comparing this to the matrix density (the density of the rock itself), we can calculate porosity. It’s like weighing the rock in-situ. Denser formations usually have lower porosity.
- Resistivity (various types, e.g., Deep Resistivity, Shallow Resistivity): Measures the ability of the formation to conduct electricity. High resistivity indicates the presence of hydrocarbons (which are poor conductors), while low resistivity suggests the presence of water (a good conductor). This is key for identifying hydrocarbon zones.
- Sonic Log (DT): Measures the time it takes for a sound wave to travel through the formation. This is related to the rock’s compressional wave velocity and is primarily used to determine porosity and lithology. Faster wave speeds often indicate harder, denser rocks.
- Caliper Log: Measures the diameter of the borehole, which helps correct other logs for variations in borehole size. This log is crucial for accurate interpretation.
These logs, and others, are used in a variety of applications, including reservoir characterization, formation evaluation, well completion design, and drilling optimization. For instance, resistivity logs are crucial for identifying hydrocarbon-bearing zones, while porosity logs help determine the volume of pore space available for storing hydrocarbons.
Q 2. Describe the process of wellbore data acquisition.
Wellbore data acquisition is a multi-stage process that begins before drilling even starts. It involves deploying various logging tools downhole while drilling is either paused or taking place (wireline or LWD logging, respectively).
- Tool Selection: Appropriate logging tools are selected based on the formation type and the information needed.
- Tool Deployment: The tools are lowered into the wellbore on a wireline (for wireline logging) or remain integrated into the drill string (for LWD). A drilling mud is circulated to cool the equipment and carry cuttings to the surface.
- Data Recording: As the tools are moved through the borehole, they record measurements continuously. These measurements are usually recorded digitally and stored for later processing and interpretation.
- Data Transmission: The acquired data is transmitted to the surface, either through the wireline cable or telemetry systems for LWD. This data undergoes real-time quality checks.
- Data Storage: The processed data is stored digitally in databases accessible to geologists, engineers, and other specialists.
Modern logging tools often incorporate multiple sensors in a single tool, enhancing efficiency. The process needs careful calibration and quality control to ensure data accuracy and reliability.
Q 3. How do you handle noisy or incomplete well log data?
Noisy and incomplete well log data is a common challenge. Several techniques are used to address this:
- Data Cleaning: This involves identifying and removing or correcting spurious data points. This might involve simple editing (removing obvious outliers) or more complex techniques like median filtering (replacing values with the median of neighboring points).
- Interpolation: For incomplete data, interpolation methods, such as linear, spline, or kriging, are used to estimate missing values. The choice of method depends on the nature of the data and the degree of missing data.
- Log editing software: Commercial software packages offer sophisticated tools for visual inspection and editing of well logs, making it possible to identify and correct various types of noise or artifacts.
- Wavelet denoising:Advanced signal processing techniques like wavelet transforms can effectively remove high-frequency noise while preserving important geological features.
- Statistical methods: Statistical analysis can highlight anomalies and patterns, potentially leading to the identification and correction of erroneous data points.
The goal is to improve the data quality before any further processing or interpretation, so decisions aren’t based on inaccurate values. For example, a spike in a GR log caused by a tool malfunction might need to be replaced with an interpolated value to avoid misinterpreting the log as a thin, high-radioactivity layer.
Q 4. What are the common challenges in wellbore data processing?
Processing wellbore data presents several challenges:
- Data Quality: As mentioned before, noise, missing data, and calibration issues are frequent problems.
- Borehole Effects: The wellbore itself can affect the measurements, creating variations that need to be corrected. For example, the presence of mud cake (a filter cake built up on the wellbore wall) can reduce the accuracy of resistivity measurements.
- Environmental Effects: Temperature and pressure changes can influence measurements. Corrections are needed to account for these effects.
- Tool Response: Each logging tool has a specific response, which can affect the accuracy of the measurements. This tool response needs to be accounted for during the processing steps.
- Data Volume: Modern high-resolution logs generate massive amounts of data, requiring efficient data management and storage systems.
- Data Integration: Combining data from multiple logs and sources (e.g., seismic data) can be complex and require advanced data integration techniques.
Overcoming these challenges often requires a combination of expertise in both well logging and data processing. Understanding the physics behind each measurement and the limitations of the tools is crucial for successful processing.
Q 5. Explain the concept of petrophysical interpretation.
Petrophysical interpretation is the process of extracting geological and reservoir information from well log data. It bridges the gap between the raw measurements and a meaningful understanding of the subsurface. It’s like translating a foreign language into something understandable and useful.
This involves using a variety of techniques, including:
- Log analysis: This involves interpreting individual logs and their relationships to understand the lithology (rock type), porosity, permeability, and fluid content of the formation.
- Cross-plotting: This involves plotting different log values against each other to identify trends and relationships.
- Statistical methods: Statistical techniques are used to analyze the data and identify patterns.
- Modeling: Petrophysical models are constructed to simulate the reservoir behavior and predict its future performance.
- Integration with other data: Well log data is often integrated with other data sources, such as core data, pressure tests, and seismic data, for a more comprehensive understanding of the reservoir.
The goal of petrophysical interpretation is to provide key parameters that are used for reservoir engineering, production forecasting, and ultimately, efficient hydrocarbon recovery.
Q 6. How do you determine porosity and permeability from well logs?
Porosity and permeability are two fundamental reservoir properties. Well logs provide indirect ways to determine them.
Porosity (φ): The fraction of the rock’s volume occupied by pore space. We determine it from well logs using several methods:
- Density Porosity: Calculated using the bulk density (RHOB), matrix density (ρma), and fluid density (ρf):
φ = (ρma - RHOB) / (ρma - ρf) - Neutron Porosity: Directly measured by the neutron porosity log (NPHI). This method is sensitive to the hydrogen index.
- Sonic Porosity: Derived from the transit time (DT) of the sonic log. The relationship is empirical and requires calibration based on the specific lithology.
Permeability (k): A measure of a rock’s ability to transmit fluids. It is more challenging to determine directly from logs, and often requires empirical correlations.
- Empirical correlations: Relationships between porosity and permeability are established based on core measurements, and then these are used to estimate permeability from well log derived porosity. These correlations often consider lithology.
- Log-based permeability indicators: Some logs, like the microresistivity log, can provide indications of permeability based on the pore size distribution.
It’s crucial to note that the accuracy of these estimations depends on the quality of the logs, the lithology, and the chosen empirical correlations. Often, multiple methods are used and compared to ensure reliability. For example, comparing density porosity and neutron porosity can reveal if there are significant amounts of clay present, which impacts the porosity calculation.
Q 7. Describe the methods used for hydrocarbon saturation estimation.
Hydrocarbon saturation (Sh) is the fraction of the pore space filled with hydrocarbons. Several methods are used to estimate it from well logs:
- Archie’s equation: A widely used empirical relationship that links resistivity (Rt), water saturation (Sw), porosity (φ), water resistivity (Rw), and a formation factor (a & m):
Sw = a Rw/(φm Rt). Hydrocarbon saturation is then calculated asSh = 1-Sw. The parameters a and m depend on the lithology and are usually obtained through core analysis or from well log correlations. This method works best in clean, unconsolidated sands. - Simandoux equation: An extension of Archie’s equation which accounts for clay content, which affects the formation factor and the saturation exponent. It is more accurate for formations with a significant clay fraction.
- Total porosity methods: Using total porosity (from density or neutron logs) combined with estimates of water saturation (derived from resistivity logs).
- NMR (Nuclear Magnetic Resonance) logging: This advanced method directly measures pore size distribution and fluid properties. This allows for a more direct estimate of hydrocarbon saturation. It differentiates between bound water (immobile) and free fluids.
The choice of method depends on the reservoir characteristics and the available data. Often, multiple methods are used and compared to improve the reliability of the saturation estimates. For example, you might use Archie’s equation for a clean sand and Simandoux for a shaley sand, comparing the results to see if there’s consistency. NMR is preferred for its more direct approach, but it’s also more expensive.
Q 8. What are the different types of well tests and their purposes?
Well tests are crucial for characterizing reservoir properties and evaluating well performance. Different tests serve different purposes. Here are a few key types:
- Pressure Buildup Tests (PBT): These are the workhorse of well testing. After a period of production, the well is shut in, and the pressure is monitored as it recovers. This allows us to determine reservoir permeability, skin factor (a measure of near-wellbore damage or stimulation), and even reservoir boundaries.
- Drawdown Tests: In contrast to buildup tests, drawdown tests monitor pressure while the well is producing. They’re useful for assessing well productivity and identifying early signs of reservoir depletion.
- Fall-off Tests: These are similar to buildup tests, but they follow a period of injection (e.g., water injection or hydraulic fracturing) instead of production. They help characterize the injected fluid’s mobility and the reservoir’s response to stimulation.
- Interference Tests: These involve observing pressure changes in one well while another well is producing or injecting. They’re valuable in determining reservoir connectivity and estimating reservoir properties between wells.
- Pulse Tests: Short, controlled changes in production or injection rate are applied, and the pressure response is monitored. Pulse tests are used to estimate reservoir properties in high-permeability reservoirs or in wells with significant wellbore storage.
The choice of test depends on factors like reservoir characteristics, well completion, and the specific information needed. For instance, a buildup test is ideal for a relatively homogeneous reservoir, while an interference test might be necessary for understanding reservoir connectivity in a fractured reservoir.
Q 9. Explain the principle of pressure buildup testing.
Pressure buildup testing relies on the principle of diffusion. When a well is shut in after a period of production, the pressure in the reservoir begins to recover. This pressure recovery is caused by the flow of fluids from the surrounding reservoir into the wellbore. The rate of pressure recovery is directly related to reservoir properties like permeability and the presence of near-wellbore damage (skin).
Imagine a balloon slowly deflating. The air escaping represents the fluid flowing from the reservoir during production. When you stop the deflation (shut-in), the surrounding air (reservoir fluid) starts to refill the balloon (wellbore). The speed at which the balloon refills indicates how easily air can flow into the area (the reservoir’s permeability).
By analyzing the pressure buildup curve (pressure versus time), we can mathematically model the fluid flow using Darcy’s law and other governing equations to derive reservoir parameters.
Q 10. How do you interpret pressure transient analysis results?
Interpreting pressure transient analysis (PTA) results involves several steps. The initial step is to plot the pressure data on various graphs (e.g., pressure vs. time, Horner plot). We look for characteristic features of these graphs which indicate different reservoir flow regimes.
For example:
- Early-time data: This part of the curve is often influenced by wellbore storage and skin effects. Wellbore storage refers to the compressibility of the fluids and the wellbore itself, causing initial pressure variations that don’t reflect the reservoir’s true properties. Skin is a measure of the near-wellbore damage or stimulation.
- Late-time data: This reflects reservoir-dominated flow, allowing for the determination of permeability, reservoir pressure, and boundary conditions (e.g., closed boundary, constant pressure boundary).
Different analysis techniques, like Horner’s method, type curve matching, or numerical modeling, are used to extract the relevant parameters. The choice of technique depends on the data quality, reservoir complexity, and the information we want to obtain. Software such as KAPPA, MBAL, or specialized modules within Petrel are commonly used for this purpose. For example, type curve matching involves comparing the pressure buildup curve to a set of theoretical curves to find a match, which allows us to determine reservoir parameters.
It’s crucial to carefully consider potential uncertainties in the data and the underlying assumptions in the analysis to arrive at reliable interpretations.
Q 11. Describe the process of wellbore stability analysis.
Wellbore stability analysis is critical for ensuring safe and efficient drilling and completion operations. It involves predicting the conditions under which the wellbore is likely to remain stable, avoiding problems such as wellbore collapse, borehole instability, and stuck pipe. The analysis considers several factors:
- In-situ stresses: These are the stresses acting on the rock formation before drilling. These stresses vary with depth, location, and geological formations.
- Rock mechanical properties: These properties, including strength, elasticity, and pore pressure, govern the rock’s response to changes in stress.
- Mud pressure: The pressure of the drilling mud, which must be carefully managed to balance formation pressure and prevent wellbore instability.
- Fracture pressure gradients: These are the minimum pressures required to initiate fracture formation in the rock. The mud weight should be below the fracture pressure to prevent formation fracturing.
Analytical and numerical models, often coupled with laboratory testing on rock samples, are employed to predict wellbore stability. The goal is to define a safe operating window for mud weight and other parameters to avoid instability. The methods used range from simple analytical solutions to more complex finite element analyses (FEA). FEA allows for modeling of complex geometries and stress states. Software like Rocscience Slide, ABAQUS, or specialized wellbore stability modules in Petrel can be used for these complex analyses.
Q 12. How do you identify and mitigate risks associated with wellbore instability?
Identifying and mitigating wellbore instability risks requires a proactive approach. The process often begins with a detailed pre-drill analysis that assesses the potential instability risks based on available geological data and wellbore stability modeling. During drilling, continuous monitoring of drilling parameters (e.g., mud pressure, rate of penetration, torque, and drag) is crucial to detect early warning signs of instability.
Mitigation strategies include:
- Optimized mud weight: Maintaining mud weight within the safe operating window helps prevent both formation fracturing and wellbore collapse.
- Mud chemistry control: Using appropriate mud types and additives to control mud properties (e.g., viscosity, density, and filtration) is vital for maintaining wellbore stability.
- Wellbore strengthening techniques: Methods such as casing placement, cementing, and the use of specialty cements can enhance wellbore stability.
- Real-time monitoring and adjustments: Continuously monitoring wellbore stability indicators and making real-time adjustments to drilling parameters can significantly reduce the risk of wellbore instability.
- Advanced drilling techniques: Employing techniques like underbalanced drilling or managed pressure drilling can improve wellbore stability in challenging formations.
A holistic approach, combining pre-drill planning, real-time monitoring, and effective mitigation strategies, is essential for minimizing the risks associated with wellbore instability. This minimizes non-productive time, reduces costs, and ensures the safety of operations.
Q 13. What software packages are you familiar with for wellbore data processing?
My experience encompasses several industry-standard software packages for wellbore data processing. I’m proficient in:
- Petrel: A comprehensive reservoir modeling and simulation software with extensive capabilities for wellbore data processing, including pressure transient analysis, wellbore stability modeling, and log interpretation.
- Landmark DecisionSpace: Another powerful suite of software for reservoir characterization and production optimization, offering similar functionalities to Petrel for wellbore data processing.
- KAPPA: A specialized software package for pressure transient analysis, renowned for its advanced features and robustness.
- MBAL: Another specialized software for pressure transient analysis which has its strengths in various scenarios.
- IP (Integrated Paradigm): A powerful suite of software used for well log interpretation, reservoir modeling, and production optimization.
I’m also familiar with several other proprietary and open-source tools for specific tasks, depending on the project needs.
Q 14. Explain your experience with well log interpretation software (e.g., Petrel, Landmark).
I have extensive experience with well log interpretation software, primarily Petrel and Landmark’s DecisionSpace. In Petrel, I’ve routinely processed and interpreted a wide range of logs, including gamma ray, resistivity, neutron porosity, density, and sonic logs. My work has involved:
- Basic log interpretation: Determining lithology, porosity, water saturation, and permeability from well logs using standard interpretation techniques and empirical correlations.
- Advanced log interpretation: Employing more sophisticated techniques, such as well test integration and petrophysical modeling, to refine reservoir characterization.
- Log quality control: Identifying and addressing issues with log data quality, ensuring accurate interpretations.
- Log data integration: Integrating well logs with other data types (e.g., core data, seismic data, and pressure test data) to build comprehensive reservoir models.
In Landmark’s DecisionSpace, my experience is similar, focusing on the use of their interpretation tools and workflows to achieve the same goals. I’ve consistently applied sound petrophysical principles to derive meaningful interpretations, leveraging my understanding of geological settings and reservoir behavior. I also have experience generating reports and presentations summarizing findings for both technical and management audiences.
Q 15. How do you integrate wellbore data with other subsurface data?
Integrating wellbore data with other subsurface data is crucial for building a comprehensive understanding of the reservoir. Think of it like assembling a 3D puzzle – wellbore data provides detailed information about a small, vertical slice of the subsurface, while other data sources fill in the rest of the picture. We use several techniques to achieve this integration:
- Georeferencing: All data needs to be accurately located in 3D space. This involves aligning wellbore surveys (e.g., measured depth, inclination, azimuth) with seismic data, geological models, and other subsurface information using common coordinate systems.
- Data Transformation: Different data sets often have varying formats and units. We transform them into a consistent format for easier comparison and integration. For instance, converting log data from different depths to a common reference.
- Geostatistical techniques: Kriging and co-kriging are used to interpolate data and create continuous 3D models of reservoir properties. For example, we might use well log data (porosity, permeability) to estimate these properties in areas not directly sampled by wells.
- Visualization: Software like Petrel, Landmark, or Kingdom allows us to visualize all data sets together in a 3D environment, facilitating cross-correlation and interpretation. This could include displaying well trajectories alongside seismic horizons and interpreted faults.
For instance, in one project, we integrated wellbore logging data (porosity, permeability, water saturation) with 3D seismic data to accurately map reservoir boundaries and predict fluid distribution. The combined data significantly improved our reservoir model and predicted oil reserves more accurately than using wellbore data alone.
Career Expert Tips:
- Ace those interviews! Prepare effectively by reviewing the Top 50 Most Common Interview Questions on ResumeGemini.
- Navigate your job search with confidence! Explore a wide range of Career Tips on ResumeGemini. Learn about common challenges and recommendations to overcome them.
- Craft the perfect resume! Master the Art of Resume Writing with ResumeGemini’s guide. Showcase your unique qualifications and achievements effectively.
- Don’t miss out on holiday savings! Build your dream resume with ResumeGemini’s ATS optimized templates.
Q 16. Describe your experience with data quality control and assurance in wellbore data processing.
Data quality control (QC) and assurance (QA) are paramount in wellbore data processing. Imagine building a house on a faulty foundation – the results would be disastrous! My experience encompasses:
- Data Validation: Checking for inconsistencies, outliers, and unrealistic values. For example, I check for spikes or steps in the log data that might indicate equipment malfunction or data transmission errors. Software tools and automated checks are used to flag these anomalies.
- Data Cleaning: This involves correcting errors, filling gaps, and smoothing noisy data. Sophisticated methods like median filtering or spline interpolation can be used to handle missing or erroneous data points.
- Log Calibration and Editing: Ensuring logs are correctly calibrated against known standards, and applying appropriate corrections for environmental factors. For example, correcting for temperature and pressure effects on density measurements.
- Depth Matching and Correlation: Precise alignment of data from multiple sources, including logs, core data, and wireline surveys. This is crucial for accurate interpretation.
- Documentation: Maintaining detailed records of QC and QA procedures to ensure transparency and traceability. This documentation forms an important part of the audit trail for all processing decisions.
I’ve used various QC software packages and developed custom scripts to automate much of the data validation and cleaning process, resulting in increased efficiency and reliability.
Q 17. How do you ensure the accuracy and reliability of wellbore data interpretations?
Ensuring the accuracy and reliability of wellbore data interpretations hinges on a multi-pronged approach:
- Employing Appropriate Techniques: Selecting the correct analytical techniques for the specific data type and geological setting. For example, using different petrophysical models for different lithologies (rock types).
- Understanding Uncertainties: Quantifying and propagating uncertainties through the interpretation workflow. This involves acknowledging the limitations of the data and the methods used.
- Cross-Validation: Comparing results from different data sets and interpretation methods. For example, comparing porosity estimates from nuclear magnetic resonance (NMR) logs with those derived from density logs.
- Subject Matter Expertise: Leveraging geological, petrophysical, and engineering knowledge to evaluate the plausibility of interpretations. For instance, understanding the expected porosity range for a particular formation will guide assessment of data validity.
- Regular Review and Peer Review: Having interpretations reviewed by other experts to identify potential biases and errors.
For instance, while interpreting well logs in a carbonate reservoir, I’ve used multiple log types along with core data to validate my estimations of porosity and permeability. Combining multiple tools allowed me to reduce uncertainties.
Q 18. How do you validate wellbore data interpretations?
Validation of wellbore data interpretations typically involves comparing the interpretations with independent data sources and verifying the predictions against real-world observations. We can consider this akin to testing a hypothesis; the interpretations are hypotheses that we test against reality.
- Comparison with Core Data: Direct comparison of log-derived properties (e.g., porosity, permeability) with measurements from core samples.
- Production Data Analysis: Matching predicted reservoir properties with observed production rates and fluid properties. This is a powerful validation step, proving the usefulness of the interpretation.
- Pressure and Temperature Data: Verifying pressure and temperature profiles against those obtained from pressure tests and temperature logs.
- Seismic Data Integration: Cross-checking interpreted properties with seismic attributes that reflect subsurface heterogeneity.
- Analogue Studies: Comparing the interpreted well data with data from similar reservoirs or wells to assess the plausibility of the findings.
In a past project, we validated our reservoir model by comparing the predicted oil production from our interpretation against the actual production data over a year; the strong correlation provided substantial confidence in our interpretation.
Q 19. Explain your understanding of different rock types and their impact on wellbore data.
Different rock types exhibit distinct physical and chemical properties that significantly influence wellbore data. Understanding these differences is critical for accurate interpretation. For instance:
- Sandstones: Typically show relatively high porosity and permeability, resulting in characteristic log responses. Their response to logs is relatively straightforward.
- Shales: Characterized by low porosity and permeability, often exhibiting high resistivity and low gamma ray values. Shales can significantly affect wellbore stability and drilling operations.
- Carbonates: Highly variable porosity and permeability, depending on the depositional environment and diagenetic processes. They can be very challenging to interpret, often requiring sophisticated techniques.
- Evaporites: Rocks like halite (salt) and anhydrite have unique properties that affect logging tools, often requiring specific corrections and interpretations.
These differences manifest in well logs. For instance, a high gamma ray value in a log might indicate the presence of shale, while high porosity values in a density log could suggest a sandstone reservoir. Understanding these relationships is key to making accurate interpretations. The impact on wellbore data is seen through changes in formation pressure, drilling parameters, and the response of logging tools.
Q 20. Describe your experience with different well completion techniques and their impact on wellbore data.
Well completion techniques significantly influence the subsequent wellbore data acquired. Different completion methods affect how fluids flow and how the formation interacts with the wellbore.
- Openhole Completion: The simplest method, involves leaving the wellbore open to the reservoir. This allows for relatively straightforward log measurements but can also lead to formation damage or fluid influx.
- Cased and Perforated Completion: The wellbore is cased and perforations are created to allow fluid flow. The presence of casing and perforations can affect the quality and reliability of log data.
- Gravel Pack Completion: Gravel is placed around the wellbore to prevent formation fines from entering the well and impeding fluid flow. This influences logging measurements due to the presence of gravel.
- Hydraulic Fracturing: High-pressure fluid is injected to create fractures in the formation, enhancing permeability. The fractures change reservoir characteristics, impacting well test interpretation and production behavior.
Understanding the completion method is crucial for interpreting well tests and production data because completion impacts flow rates and fluid distribution. For example, poorly-placed perforations in a cased and perforated completion can lead to underestimation of reservoir potential. Similarly, poorly-designed hydraulic fracturing treatments can decrease production.
Q 21. How do you use wellbore data to optimize drilling operations?
Wellbore data plays a critical role in optimizing drilling operations. Real-time data monitoring allows us to make informed decisions and prevent costly problems. This is akin to a pilot using instruments to navigate safely.
- Real-time Monitoring of Drilling Parameters: Data such as weight on bit, rotary speed, and torque are monitored to optimize drilling efficiency and minimize equipment wear. Anomalies in these data can signal potential problems (e.g., bit dulling or formation instability).
- Formation Evaluation During Drilling: Techniques like LWD (Logging While Drilling) and MWD (Measurement While Drilling) provide real-time information on formation properties, helping to optimize drilling decisions. This can allow for adjustments to drilling parameters to reduce risks.
- Predictive Modeling: Combining historical wellbore data with geological models to predict drilling challenges, like pressure variations or unexpected formation types. This allows for proactive measures to mitigate these risks.
- Wellbore Stability Analysis: Analyzing wellbore stability parameters (e.g., pore pressure, stress, fractures) to optimize drilling fluid properties and prevent wellbore collapse or instability.
For example, by using real-time MWD data, we were able to detect a zone of unexpectedly high pressure, allowing us to adjust our drilling fluid density proactively and prevent a potential wellbore blowout.
Q 22. How do you use wellbore data to optimize production operations?
Wellbore data, encompassing measurements from logging tools and other downhole sensors, is crucial for optimizing production operations. We use this data to build a comprehensive understanding of the reservoir and well performance, leading to improved decision-making. This optimization process typically involves several steps:
Reservoir Characterization: Analysis of logs like gamma ray, resistivity, porosity, and density helps define reservoir properties (porosity, permeability, fluid saturation). This informs decisions on completion strategies (e.g., number and placement of perforations).
Production Forecasting: By integrating production data (flow rates, pressures) with reservoir properties, we can create accurate production forecasts and identify potential bottlenecks. This might involve using reservoir simulation software to model fluid flow.
Well Intervention Planning: Analyzing pressure-temperature data, flow profiles, and downhole imaging helps in identifying issues such as water or gas coning, sand production, or formation damage. This informs the planning and execution of well interventions (e.g., stimulation, workovers).
Monitoring and Surveillance: Continuous monitoring of wellbore parameters, such as pressure and temperature, allows for early detection of problems and proactive interventions to prevent production decline. This real-time data can be incorporated into automated alerts and control systems.
For example, identifying low permeability zones from logs might lead to the implementation of hydraulic fracturing to enhance production. Similarly, detecting a pressure drop might indicate a need for a well intervention to address a blockage.
Q 23. How do you present wellbore data interpretations to a non-technical audience?
Presenting wellbore data interpretations to a non-technical audience requires simplifying complex concepts and using clear, visual aids. Instead of technical jargon, I focus on using analogies and storytelling. I might explain reservoir properties using simple metaphors – for instance, comparing porosity to the amount of space in a sponge, and permeability to how easily water flows through it.
I would primarily rely on visual aids like charts and graphs, focusing on key performance indicators (KPIs) rather than detailed data tables. A simple bar chart showing production rates over time is far more impactful than a complex petrophysical log. Using clear and concise language, I’d explain the key findings and their implications in straightforward terms. For instance, instead of saying ‘we observed a significant decrease in water saturation,’ I might say ‘the well is producing less water, resulting in a higher oil production rate.’
I also believe in fostering interactive discussions. This helps clarify any doubts and ensures that the audience understands the key takeaways. In short, it’s about translating the technical language into a narrative that resonates with the audience and ultimately informs their decisions.
Q 24. Describe a situation where you had to troubleshoot a problem with wellbore data.
During a project involving an offshore well, we encountered inconsistencies in the pressure data obtained from different logging tools. Initially, we suspected sensor malfunction or data transmission errors. However, after a thorough review of the acquisition parameters and a detailed comparison of the data from multiple tools, we discovered that the discrepancy stemmed from a previously undocumented formation pressure gradient change.
Our troubleshooting involved:
Data validation: We checked the quality control flags and ran quality assurance checks on all relevant datasets. We also compared our data to the available reference data from similar wells in the area.
Tool calibration: We reviewed the calibration certificates of the logging tools used to ensure they were within acceptable tolerances.
Geological interpretation: We consulted with geologists to review the geological formation model and understand the possible reasons behind the pressure changes. We revisited the well logs and identified changes in the rock formations that could contribute to variations in pressure gradient.
Modeling and simulation: We utilized reservoir simulation software to incorporate the newly-interpreted formation pressure data to refine the model, resulting in a more accurate depiction of the reservoir and well behavior. This led to an improved understanding of the reservoir dynamics and assisted in optimizing production strategies.
This experience highlighted the importance of a holistic approach to data interpretation, considering geological context and cross-validating data from different sources.
Q 25. How do you stay up-to-date with the latest advancements in wellbore data processing and interpretation?
Staying current in the rapidly evolving field of wellbore data processing and interpretation requires a multi-faceted approach:
Professional memberships: I actively participate in professional organizations like the Society of Petroleum Engineers (SPE) and attend their conferences and workshops. This exposes me to the latest research and best practices.
Industry publications: I regularly read industry journals, such as SPE Journal and Petrophysics, and follow key industry publications to stay informed about new technologies and techniques.
Online resources: I leverage online platforms such as research databases (OnePetro, Scopus, Web of Science) and educational resources to access the latest research papers and industry reports.
Continuing education: I actively seek out and participate in short courses, workshops, and webinars focused on advanced techniques in data analytics, machine learning, and reservoir simulation. This ensures I am proficient in the latest software and analytical methods.
Collaboration: Networking with colleagues and attending industry events fosters knowledge sharing and provides exposure to different perspectives and challenges, stimulating innovation and continuous learning.
Continuous learning is crucial in this domain; new technologies and techniques emerge regularly, and staying up-to-date is essential for providing the best possible solutions.
Q 26. What are your salary expectations?
My salary expectations are commensurate with my experience and skills, and aligned with the industry standards for a wellbore data specialist with my background. I am open to discussing this further based on the specifics of the role and the compensation package offered.
Q 27. What are your long-term career goals?
My long-term career goals involve becoming a recognized expert in advanced wellbore data analytics, specializing in the application of machine learning and artificial intelligence for reservoir management and optimization. I aspire to lead projects that leverage cutting-edge technologies to enhance efficiency, reduce costs, and improve sustainability in the oil and gas industry. Ultimately, I envision myself in a leadership position, mentoring younger professionals and contributing to the advancement of the field.
Key Topics to Learn for Knowledge of Wellbore Data Processing and Interpretation Interview
- Data Acquisition and Quality Control: Understanding different logging tools (e.g., resistivity, porosity, density), data acquisition procedures, and methods for identifying and correcting noise or errors in wellbore data.
- Data Processing Techniques: Mastering techniques like depth shifting, editing, and filtering to ensure data accuracy and consistency for further interpretation. This includes familiarity with relevant software packages.
- Petrophysical Interpretation: Developing proficiency in calculating porosity, water saturation, permeability, and other key reservoir properties from well log data. Understanding the limitations and assumptions of various petrophysical models is crucial.
- Formation Evaluation: Applying petrophysical interpretations to characterize reservoir properties, identify hydrocarbon zones, and estimate reserves. This involves integrating well log data with other geological and geophysical information.
- Well Log Analysis & Correlation: Effectively interpreting and correlating various well logs to create a comprehensive understanding of the subsurface geology and reservoir characteristics. This includes identifying lithological changes and geological structures.
- Problem-Solving and Case Studies: Preparing for hypothetical scenarios involving data interpretation challenges, ambiguous results, and the need for creative solutions. Practicing with case studies will greatly improve your problem-solving skills.
- Reservoir Characterization: Utilizing wellbore data to contribute to a complete reservoir model, including its geometry, fluid content, and overall properties.
- Software Proficiency: Demonstrating familiarity with industry-standard well log analysis software (mention specific software if applicable to your target roles).
Next Steps
Mastering Knowledge of Wellbore Data Processing and Interpretation is paramount for career advancement in the energy sector, opening doors to challenging and rewarding roles. A strong grasp of these concepts demonstrates valuable technical skills and problem-solving abilities highly sought after by employers. To maximize your job prospects, focus on creating an ATS-friendly resume that effectively highlights your expertise. ResumeGemini is a trusted resource that can significantly enhance your resume-building experience, ensuring your qualifications shine. Examples of resumes tailored to Knowledge of Wellbore Data Processing and Interpretation are available to guide you.
Explore more articles
Users Rating of Our Blogs
Share Your Experience
We value your feedback! Please rate our content and share your thoughts (optional).
What Readers Say About Our Blog
Hello,
We found issues with your domain’s email setup that may be sending your messages to spam or blocking them completely. InboxShield Mini shows you how to fix it in minutes — no tech skills required.
Scan your domain now for details: https://inboxshield-mini.com/
— Adam @ InboxShield Mini
Reply STOP to unsubscribe
Hi, are you owner of interviewgemini.com? What if I told you I could help you find extra time in your schedule, reconnect with leads you didn’t even realize you missed, and bring in more “I want to work with you” conversations, without increasing your ad spend or hiring a full-time employee?
All with a flexible, budget-friendly service that could easily pay for itself. Sounds good?
Would it be nice to jump on a quick 10-minute call so I can show you exactly how we make this work?
Best,
Hapei
Marketing Director
Hey, I know you’re the owner of interviewgemini.com. I’ll be quick.
Fundraising for your business is tough and time-consuming. We make it easier by guaranteeing two private investor meetings each month, for six months. No demos, no pitch events – just direct introductions to active investors matched to your startup.
If youR17;re raising, this could help you build real momentum. Want me to send more info?
Hi, I represent an SEO company that specialises in getting you AI citations and higher rankings on Google. I’d like to offer you a 100% free SEO audit for your website. Would you be interested?
Hi, I represent an SEO company that specialises in getting you AI citations and higher rankings on Google. I’d like to offer you a 100% free SEO audit for your website. Would you be interested?
good
