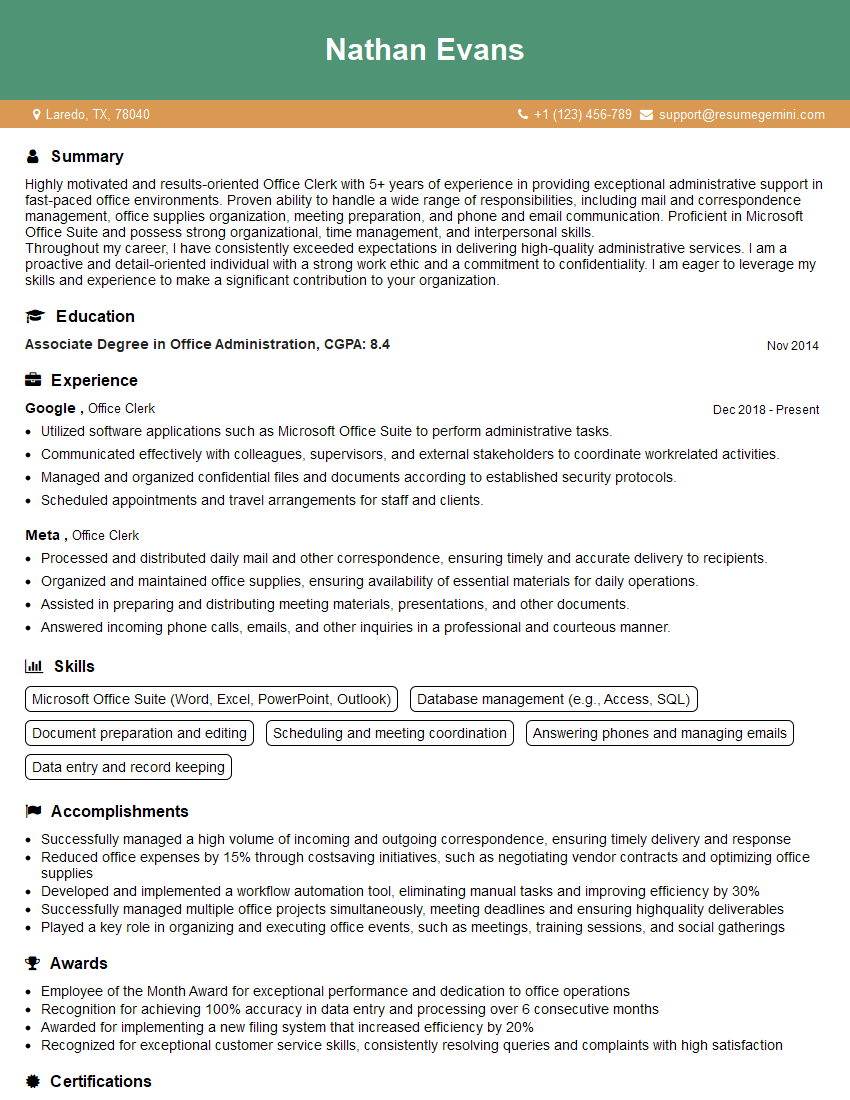
Interviews are opportunities to demonstrate your expertise, and this guide is here to help you shine. Explore the essential Knows MS Office Suite interview questions that employers frequently ask, paired with strategies for crafting responses that set you apart from the competition.
Questions Asked in Knows MS Office Suite Interview
Q 1. Explain your experience with Microsoft Word’s mail merge feature.
Mail merge in Microsoft Word is a powerful tool that allows you to create personalized documents from a single template. Imagine sending out hundreds of customized letters, each addressed to a different recipient with their specific details included – that’s the power of mail merge. It works by combining a main document (your letter template) with a data source (like an Excel spreadsheet containing recipient information).
My experience includes extensively using mail merge for tasks such as creating personalized marketing materials, generating customized invoices, and sending out mass email communications. I’ve mastered the process of inserting merge fields (placeholders for data from your source) into your template, selecting the data source, previewing the merged results, and ultimately printing or saving the personalized documents. For example, I once used mail merge to create personalized thank-you notes for over 200 clients, dramatically speeding up the process and ensuring consistent branding.
I’m proficient in handling various data source types, including Excel spreadsheets, Access databases, and even text files. I understand how to manage complex merge fields and conditionally include or exclude content based on data values within the data source, ensuring each document is truly unique and targeted.
Q 2. How proficient are you in creating and formatting tables in Microsoft Excel?
Creating and formatting tables in Excel is a fundamental skill I’ve honed over many years. I’m adept at building tables of varying complexities, from simple data grids to more intricate tables with merged cells, formulas, conditional formatting, and data validation.
Beyond basic table creation, I can efficiently use features like table styles for consistent formatting, quickly resize columns, freeze panes for easier navigation of large datasets, and use filter options to quickly isolate specific data. I can also leverage Excel’s built-in features to automatically calculate totals, averages, and other summary statistics within the tables. For instance, I recently created an interactive budget spreadsheet with multiple tables linked via formulas to streamline financial tracking and analysis for a non-profit organization.
Q 3. Describe your experience with advanced Excel functions like VLOOKUP and Pivot Tables.
VLOOKUP and PivotTables are essential tools in my Excel arsenal. VLOOKUP allows you to search for a specific value in a table and retrieve corresponding data from another column – think of it as a super-powered ‘find and replace’ on steroids. PivotTables, on the other hand, transform raw data into a summarized, interactive format, making complex datasets easier to analyze.
I frequently use VLOOKUP for tasks like looking up product information based on product codes, retrieving customer details from a database using customer IDs, or matching employee data to payroll information. I have extensive experience building sophisticated PivotTables to summarize sales figures, analyze customer demographics, track project progress, or uncover trends within large datasets. For example, I used PivotTables to create interactive dashboards displaying sales performance by region, product category, and sales representative, providing invaluable business insights to my previous employer.
Beyond VLOOKUP, I’m proficient with other advanced functions like INDEX & MATCH (a more powerful and flexible alternative to VLOOKUP), SUMIF, COUNTIF, AVERAGEIF, and various other functions to perform complex calculations and data manipulations.
Q 4. How would you troubleshoot a corrupted Microsoft Word document?
Troubleshooting a corrupted Word document requires a methodical approach. My first step is always to try opening the document in Word’s compatibility mode. This often resolves minor issues. If that doesn’t work, I attempt to recover the text from the corrupted file by using Word’s built-in recovery features. Word often creates temporary files during autosave; locating and opening these can sometimes retrieve parts of the lost data.
If neither of these methods works, I might try opening the file in a different version of Word or using a third-party file recovery tool. These tools sometimes have more sophisticated algorithms for recovering data from damaged files. As a last resort, I might try to recover the data from a backup copy if one exists. The key is to always back up important documents regularly to avoid such situations altogether.
Q 5. What are your preferred methods for organizing and managing large datasets in Excel?
Organizing and managing large datasets in Excel requires a strategic approach. My preferred methods involve a combination of techniques, including:
- Data Cleaning and Validation: Ensuring data accuracy and consistency from the outset is critical. This involves using features like data validation to constrain data entry, removing duplicates, and handling missing values.
- Proper Formatting: Using consistent formatting, including column headings, data types, and number formats, improves readability and maintainability of the dataset.
- Data Tables and Named Ranges: Converting data ranges into Excel tables significantly enhances data management, allowing for easier filtering, sorting, and referencing. Named ranges make formulas more readable and less prone to errors.
- Pivot Tables and Charts: Analyzing large datasets becomes significantly simpler with PivotTables, providing summarized views and interactive dashboards. Charts visually represent key trends and insights.
- External Data Connections: For extremely large datasets, connecting to external data sources (like databases) is far more efficient than managing everything within a single spreadsheet.
I always strive to create well-structured spreadsheets that are easily understood and maintained, allowing for efficient data analysis and reporting.
Q 6. Describe your experience using Microsoft PowerPoint to create engaging presentations.
Creating engaging presentations in PowerPoint is a skill I’ve developed through years of experience. I focus on crafting visually appealing and informative presentations tailored to the audience and purpose. This involves thoughtful slide design, incorporating relevant visuals (charts, graphs, images), and maintaining a clear and concise narrative flow.
I’m experienced in using various PowerPoint features to enhance presentation quality, such as master slides for consistent branding, smart art for visually representing data, and using various text formatting options to create emphasis and clarity. For example, I recently created a presentation for a major client showcasing our company’s capabilities. The presentation incorporated high-quality visuals, a clear narrative, and effective use of animation to guide the audience through our key points, resulting in a positive reception and a secured contract.
Q 7. How familiar are you with PowerPoint’s animation and transition features?
I’m highly familiar with PowerPoint’s animation and transition features and use them judiciously to enhance audience engagement without overwhelming the presentation. Transitions smoothly connect slides, while animations can highlight key points or add visual interest to data or text.
However, I recognize that overuse of animations and transitions can be distracting. My approach is to choose animations and transitions that reinforce the narrative and highlight crucial information. I use subtle animations to draw attention to specific elements and use transitions sparingly, ensuring a clean and professional presentation. I prioritize clarity and understanding, keeping the focus on the message rather than the special effects.
Q 8. How would you create a professional-looking chart or graph in Excel?
Creating professional-looking charts and graphs in Excel involves selecting the right chart type for your data, carefully formatting elements, and ensuring readability. Think of it like choosing the perfect outfit – the wrong choice can ruin the overall presentation.
First, choose the appropriate chart type. A simple bar chart works well for comparing categories, while a line chart is best for showing trends over time. Pie charts are good for showing proportions of a whole, but overuse can make them visually cluttered. Excel offers a wide variety of charts, including scatter plots, area charts, and even more specialized options.
Once you’ve selected your chart, formatting is key. Consider using clear and concise labels for both axes and the legend. Choose a color palette that’s both visually appealing and easy to understand. Avoid overly bright or clashing colors. Use appropriate font sizes – make sure your labels and data are easily readable even at smaller scales. Adding a chart title that concisely summarizes the data presented is crucial.
Data presentation matters. Keep the data clean; avoid overwhelming the chart with too many data points. If necessary, group related data or highlight key trends to improve readability. For example, if you’re tracking monthly sales for multiple products, group similar products together or highlight the best-selling product.
Finally, consider your audience. A chart intended for a quick glance needs different formatting than one presented in a formal report. Remember, the goal is to effectively communicate your data, not to impress with overly complicated designs.
Q 9. How do you ensure data accuracy and integrity when working with Excel spreadsheets?
Data accuracy and integrity are paramount when working with Excel. Think of it like building a house – a faulty foundation leads to problems. Here’s how I ensure this:
- Data Validation: I use data validation rules to restrict the type of data entered into cells. For example, I might only allow numbers in a column representing quantities, or specific dates in a date column. This prevents errors like text in numerical fields.
- Formula Auditing: I leverage Excel’s formula auditing tools, like Trace Precedents and Trace Dependents, to understand how formulas work and identify potential sources of error. This is like checking each step of a calculation to make sure it’s correct.
- Data Cleansing: Before analysis, I clean the data by removing duplicates, handling missing values (through imputation or exclusion), and correcting inconsistencies. This involves identifying and fixing data entry errors.
- Cross-referencing: Whenever possible, I cross-reference data from multiple sources to verify its accuracy. This helps catch inconsistencies early on.
- Regular Backups: I regularly back up my workbooks to prevent data loss due to accidental deletion or software failure. This safeguard protects from unforeseen events.
Employing these methods minimizes errors and enhances the reliability of your analysis, making your conclusions more credible.
Q 10. What are some ways you can protect your Excel workbooks from unauthorized access?
Protecting Excel workbooks involves several layers of security, much like securing a building with locks, alarms, and guards. These include:
- Password Protection: The most basic level is password-protecting the workbook to prevent unauthorized opening. This is like setting a password on your computer.
- Sheet Protection: This allows you to protect individual sheets, preventing changes to specific data ranges while still allowing access to other parts of the workbook.
- Cell Protection: This provides granular control by protecting individual cells or ranges, preventing edits only where necessary.
- Data Encryption: For sensitive data, consider using encryption to safeguard the workbook’s contents, making it unreadable without the correct decryption key.
- Restricting Access via Shared Workbooks: Shared workbooks offer controlled access, where you can limit user permissions to editing, viewing, or commenting.
The right approach depends on the sensitivity of your data. A simple password might suffice for internal documents, while encryption may be required for confidential information. The key is to choose the security measures appropriate for your situation.
Q 11. Explain your experience with Microsoft Outlook, including calendar management and email organization.
My experience with Microsoft Outlook is extensive. I’ve utilized it for managing complex calendars, organizing emails, and collaborating on projects. I view Outlook as a central hub for professional communication and time management.
Calendar Management: I use Outlook’s calendar extensively for scheduling meetings, setting reminders, and managing deadlines. I leverage features like recurring appointments and color-coding to visualize my schedule effectively. For example, I might color-code appointments based on project or priority to distinguish them at a glance.
Email Organization: I maintain a well-organized inbox using folders, rules, and flags. I create folders for projects, clients, and different types of correspondence. Rules automatically sort incoming emails into the appropriate folders, and flags help me prioritize important messages. I regularly archive old emails to maintain a clean inbox. This keeps my inbox manageable and allows me to easily locate past communications.
Q 12. How do you handle multiple email accounts and prioritize incoming messages?
Managing multiple email accounts requires a systematic approach. I use Outlook’s ability to connect to multiple accounts simultaneously. This provides a unified view of all my inboxes in one application.
Prioritization involves several steps: First, I use the ‘Rules’ feature to automatically sort important emails from specific senders or containing keywords into separate folders. Second, I use flags to tag emails requiring immediate attention. Third, I review my emails strategically throughout the day, setting aside specific times to focus on email processing. Finally, I employ the ‘Categorization’ feature to organize emails based on project, client or topic, further enhancing my ability to prioritize tasks.
For instance, I might set a rule to automatically forward emails from my manager to a separate folder flagged as high priority. This workflow ensures I never miss important instructions.
Q 13. Describe your experience with Microsoft Access databases.
I have extensive experience with Microsoft Access databases. My experience ranges from designing and creating simple databases to developing complex relational databases with multiple tables, queries, and reports. I understand the importance of database normalization to maintain data integrity and efficiency.
I’m proficient in creating tables, defining relationships between them, and ensuring data consistency. I have a solid grasp of data types and their appropriate use within a database context. I’ve also utilized Access to create robust applications linked to external data sources.
For example, I once designed an Access database to manage a company’s inventory, tracking stock levels, sales figures, and orders. This database proved invaluable for improving efficiency and reducing errors in the company’s supply chain management.
Q 14. How familiar are you with creating queries and reports in Access?
I’m highly familiar with creating queries and reports in Access. Queries allow me to retrieve specific data based on criteria, while reports present the data in a user-friendly format.
I can create various types of queries, including select queries (for retrieving data), action queries (for updating or deleting data), and parameter queries (allowing users to input search criteria). I’m comfortable using SQL (Structured Query Language) to create more complex queries, leveraging functionalities like joins, subqueries, and aggregate functions.
Similarly, I can design different types of reports, including tabular reports, summary reports, and even more complex reports utilizing grouping and sub-reports. I understand how to use report design features like formatting, grouping, sorting, and charting to make reports visually appealing and informative. This allows me to tailor reports to the specific needs of the user, making data accessible and actionable.
Q 15. How would you use Access to manage and analyze a large dataset?
Managing and analyzing large datasets in Access involves leveraging its database capabilities. Think of Access as a highly organized filing cabinet, but instead of paper, it stores data in tables. These tables can be linked together to create complex relationships, allowing for powerful analysis.
First, I’d import the data into Access, ensuring data integrity and consistency. This could be from a CSV file, Excel spreadsheet, or even a direct connection to another database. Then, I’d define relationships between tables – for example, linking a ‘Customers’ table to an ‘Orders’ table via a common ‘CustomerID’ field. This allows for efficient querying across multiple tables.
Next, I’d use Access’s query design tool to create queries to filter, sort, and analyze the data. For instance, I might create a query to find all customers who placed orders over a certain value within a specific time period. I could also use aggregate functions like SUM(), AVG(), COUNT() to calculate summary statistics such as total sales, average order value, or the number of orders per customer.
Finally, I’d use Access’s reporting features to visualize the findings. Reports allow for a clear presentation of the analyzed data, making it easy to identify trends and patterns. For instance, I might create a report showing the sales trend over time, broken down by product category. The visual representation of data through charts and graphs enhances insights greatly.
Career Expert Tips:
- Ace those interviews! Prepare effectively by reviewing the Top 50 Most Common Interview Questions on ResumeGemini.
- Navigate your job search with confidence! Explore a wide range of Career Tips on ResumeGemini. Learn about common challenges and recommendations to overcome them.
- Craft the perfect resume! Master the Art of Resume Writing with ResumeGemini’s guide. Showcase your unique qualifications and achievements effectively.
- Don’t miss out on holiday savings! Build your dream resume with ResumeGemini’s ATS optimized templates.
Q 16. What are your preferred methods for collaborating on Microsoft Office documents with others?
Collaboration on Microsoft Office documents is crucial for teamwork, and I prefer a multifaceted approach. I extensively use features like co-authoring, which allows multiple people to work on the same document simultaneously. It’s like having a shared whiteboard, eliminating the need to send files back and forth.
Beyond co-authoring, I utilize version history. This feature allows me to track changes, revert to previous versions if needed, and even see who made specific edits. Think of it as a detailed changelog, ensuring accountability and allowing for easy troubleshooting of errors. This is especially important on larger projects with many collaborators.
Finally, communication is key. Before starting a collaborative project, I make sure that everyone understands their roles and responsibilities. We establish a common communication channel, such as Microsoft Teams or email, to discuss issues, coordinate changes, and update everyone on progress. Regular check-ins are also important to keep everyone on the same page.
Q 17. Explain your experience with using version control in Microsoft Office applications.
My experience with version control in Microsoft Office applications primarily involves leveraging the built-in version history. This feature automatically saves previous versions of a document, allowing me to revert to earlier states if needed. It’s like having a time machine for my documents!
I use this regularly for important documents to ensure that I can easily recover from accidental deletions or unwanted changes. For example, if I accidentally delete a crucial paragraph while editing a report, I can easily go back to a previous version and recover the missing content. This feature significantly reduces the risk of data loss and ensures business continuity.
For more robust version control, particularly on collaborative projects, I would integrate with tools such as SharePoint or cloud-based services that offer more granular versioning and check-in/check-out options. These offer enhanced features like conflict resolution and advanced audit trails, perfect for managing larger projects and avoiding version conflicts.
Q 18. Describe your experience using Microsoft OneNote for note-taking and organization.
OneNote is my go-to application for note-taking and organization. I find its flexibility and ease of use invaluable. Think of it as a digital notebook, but infinitely expandable and easily searchable.
I use OneNote to organize my notes in various ways, from simple lists and checklists to complex hierarchies of notebooks and sections. I often use tags to categorize my notes based on topics or projects. This makes it easy to search and filter my notes based on keywords and tags, ensuring that I can quickly find relevant information whenever needed.
Beyond simple note-taking, I use OneNote to collaborate with others on projects. It allows for easy sharing of notebooks, enabling team members to contribute and access information simultaneously. It’s a fantastic centralized hub for keeping notes, ideas, and relevant project information in a single place.
Q 19. How familiar are you with Microsoft Teams and its collaboration features?
I’m very familiar with Microsoft Teams and its extensive collaboration features. I consider it a central hub for communication and collaboration within a team. It’s like a digital office space, bringing together various tools into one convenient application.
I regularly use Teams for instant messaging, video conferencing, and file sharing. The ability to create channels for specific projects or departments allows for organized communication and ensures that conversations stay focused and relevant. It also allows for seamless integration with other Microsoft Office applications, making collaboration even more efficient. For example, we can easily share and co-author documents directly within a Teams channel.
Teams’ features like task management and polls contribute to efficient project management. This ensures all tasks are assigned, deadlines are clear, and progress is easily tracked. Its integration with other apps within the Microsoft 365 ecosystem enhances its efficiency further, making it a truly comprehensive platform.
Q 20. How would you use Microsoft SharePoint to manage and share documents?
SharePoint is a powerful platform for managing and sharing documents. Imagine it as a centralized, highly organized document repository accessible from anywhere. It’s far more than just a simple file-sharing service.
I use SharePoint to organize documents into libraries and folders, creating a structured system that’s easily navigable. This allows for streamlined version control, ensuring everyone is working with the latest version and past versions are readily available. Access controls can be set to manage who has permission to view, edit, or delete documents, ensuring data security and compliance.
SharePoint also allows for robust search capabilities, so finding a specific document is easy. The integration with other Microsoft applications, like Microsoft Teams, streamlines workflows. This ensures easy sharing and collaboration within a team without the hassle of emailing large files back and forth.
Q 21. Explain your experience with using macros in Microsoft Office applications.
I have extensive experience using macros in Microsoft Office applications, particularly in Excel and Word. Macros are essentially mini-programs that automate repetitive tasks. Think of them as shortcuts for your computer, performing complex actions with a single click.
I’ve used macros to automate tasks such as formatting documents, generating reports, importing and exporting data, and much more. For example, I’ve written macros in Excel to automatically generate monthly sales reports, calculating key metrics and formatting the output for easy interpretation. This automation saves a substantial amount of time and reduces the risk of human error.
The VBA (Visual Basic for Applications) scripting language is used to create macros. A simple example of a VBA macro in Excel to sum the values in a column would be: Sub SumColumn() Range("A1").End(xlDown).Offset(1, 0).Formula = "=SUM(A1:A") & Range("A1").End(xlDown).Row End Sub This macro finds the last row with data in column A and then inserts a SUM formula to calculate the total. However, more complex macros can significantly enhance productivity and streamline various office tasks.
Q 22. How do you ensure data consistency when working with multiple Microsoft Office applications?
Data consistency across multiple Microsoft Office applications is crucial for accurate reporting and analysis. Think of it like building with LEGOs – you want all your bricks to fit together perfectly. I achieve this primarily through centralized data sources. Instead of creating multiple spreadsheets with potentially conflicting information, I often start with a single, well-structured database (like an Access database or a well-designed Excel sheet acting as a master file) and then link other Office applications, such as Word or PowerPoint, to this source. Any changes made in the central database are automatically reflected in linked documents, ensuring consistency.
For example, if I’m creating a sales report in Excel, a presentation in PowerPoint, and a summary in Word, I’d create the initial data entry and calculations in Excel. Then, I’d use linked tables or charts in PowerPoint and Word to pull data directly from this Excel source. This way, if a sales figure is updated in Excel, the changes instantly appear in the presentation and summary documents. Further, I employ rigorous data validation rules within Excel and Access to prevent entry of incorrect or inconsistent data from the start.
Q 23. What is your experience with data visualization tools within the MS Office suite?
I have extensive experience leveraging the data visualization tools within the MS Office suite, primarily in Excel and PowerPoint. In Excel, I regularly utilize charts (column, bar, line, pie, scatter plots, etc.) to present data clearly and concisely. I carefully choose the chart type best suited to the data and the message I want to convey. For instance, a line chart is ideal for showing trends over time, while a bar chart is better for comparing different categories. Beyond basic charts, I’m proficient in creating pivot charts which allow for dynamic data analysis and summarization. I can use slicers and filters to interact with the data to extract specific information, streamlining the analytical process.
In PowerPoint, I use charts and graphs imported from Excel to visually support presentations, tailoring them to enhance audience understanding. I also utilize SmartArt graphics to represent hierarchical data or processes visually. The key is selecting the right visual representation to avoid overwhelming the audience with too much information or misrepresenting the findings.
Q 24. Describe your experience with automating tasks using VBA (Visual Basic for Applications).
My VBA experience spans several years, and I’ve used it extensively to automate repetitive tasks, saving considerable time and improving accuracy. For example, I’ve written macros to automate report generation, data cleaning and transformation processes, and the consolidation of data from multiple sources. One project involved automating the creation of monthly sales reports which previously took hours; my VBA macro now generates these reports in minutes with enhanced accuracy and consistency.
Sub ExampleMacro() 'This is a simple VBA example that adds a new row to an Excel sheet. Worksheets("Sheet1").Rows(Rows.Count).Insert Shift:=xlDown End Sub
I understand the importance of robust error handling and efficient code design. My approach involves breaking down complex tasks into smaller, manageable modules, promoting readability, and facilitating debugging. This modular approach also makes it easier to modify or reuse components in future projects. I always document my code thoroughly to ensure its maintainability and understandability for others (or myself in the future!).
Q 25. How do you handle conflicting edits in a shared Microsoft Office document?
Conflicting edits in shared Microsoft Office documents are inevitable, especially in collaborative environments. My strategy focuses on prevention and resolution. Prevention involves clear communication and coordination among collaborators; setting clear guidelines and assigning specific tasks helps. Using version control is highly beneficial, even if it’s just naming files systematically to track changes (e.g., adding date and version numbers to filenames). In the case of Microsoft 365, using the built-in co-authoring feature with real-time collaboration greatly minimizes conflicts.
When conflicts do arise, Microsoft Office’s track changes functionality is invaluable. It allows us to see exactly what changes have been made and by whom. I meticulously review these changes, comparing the different versions, and collaboratively resolve any discrepancies. If co-authoring is not available, it’s important to have one person merge the edits with others clearly understanding who made which revision. Open communication is key – addressing conflicts directly and proactively minimizes disruptions and ensures everyone is on the same page.
Q 26. What strategies do you use to improve your efficiency when working with the MS Office suite?
Improving efficiency with the MS Office suite is a continuous process. My strategies include mastering keyboard shortcuts (which significantly speed up navigation and tasks), utilizing the built-in help features, exploring and adopting advanced functionalities like Power Query (for data manipulation and import), and extensively using templates to standardize document creation and formatting.
I also prioritize learning new features and functionalities as they are released. Staying updated on MS Office news and attending relevant training sessions are integral to improving my proficiency. For repetitive tasks, I automate them using VBA macros, saving immense time and effort. Finally, I organize my files logically to allow easy access and retrieval of the information. Think of it like a well-organized filing cabinet; if everything has a designated place, it’s much easier to find what you need when you need it.
Q 27. How would you troubleshoot a slow-performing Excel workbook?
A slow-performing Excel workbook can be incredibly frustrating. My approach to troubleshooting involves a systematic investigation. First, I identify the workbook’s size and the number of worksheets and cells with data. A large workbook naturally takes longer to load and calculate. I then check for overly complex formulas or inefficient functions; nested functions can significantly slow down calculation times. I’ll also look for circular references which can cause Excel to continuously recalculate. A circular reference occurs when a cell refers to itself either directly or indirectly through other cells. Excel will continue trying to resolve it, which can lead to slow performance.
Next, I analyze whether there are unnecessary formatting elements or images. Excessive formatting, especially conditional formatting on a large number of cells, can also contribute to slow performance. I’ll also check for unneeded or unused worksheets which increase file size and processing time. Removing these will improve performance significantly. If the workbook uses external data connections, checking the status and speed of those connections is important. Once the source of the slowdown is identified, I implement the necessary corrections, such as optimizing formulas, removing unnecessary data, and limiting formatting. Sometimes, splitting a large workbook into smaller, more manageable ones can be the most effective solution.
Q 28. What are some tips for creating accessible Microsoft Office documents?
Creating accessible Microsoft Office documents is crucial for ensuring that everyone, including those with disabilities, can access and utilize the information. This involves applying several strategies. First, I use descriptive headings and titles for better navigation and screen reader compatibility. I use alt text for images, providing concise but informative descriptions of the image’s content. This allows screen readers to convey the image’s meaning to visually impaired users. I also ensure sufficient color contrast between text and background; this improves readability for individuals with visual impairments.
Further, I stick to clear and straightforward language, avoiding jargon or overly complex sentence structures. I use structured tables with clear row and column headers to improve data accessibility. I also avoid using tables for visual layout (unless necessary for data organization); instead, I use appropriate styling options. For individuals with motor impairments, I make sure to use simple and clear layouts, avoiding unnecessarily complex designs. For documents intended for a wider audience, I often provide multiple formats (e.g., PDF, Word doc, plain text) to increase accessibility options. By consistently considering accessibility best practices, I ensure my documents are inclusive and usable for everyone.
Key Topics to Learn for Knows MS Office Suite Interview
- Word Processing (Word): Mastering document formatting, styles, tables, mail merge, and advanced features like track changes and commenting. Think about how you’d use these features to create a professional report or business letter.
- Spreadsheet Software (Excel): Develop proficiency in data entry, formula creation (including advanced functions like VLOOKUP and PivotTables), data analysis, charting, and data visualization. Consider examples where you’ve used Excel to analyze data and draw conclusions.
- Presentation Software (PowerPoint): Focus on creating engaging and professional presentations, including slide design, animation, transitions, and incorporating data from Excel. Practice structuring presentations logically and delivering key information effectively.
- Database Management (Access): Understand database design principles, creating tables, relationships, queries, forms, and reports. Be prepared to discuss scenarios where you’ve used a database to organize and manage information.
- Collaboration & Sharing: Demonstrate your understanding of co-authoring documents, sharing files using cloud services, and managing version control. This is crucial for teamwork and project management.
- Problem-Solving & Troubleshooting: Be ready to discuss how you approach technical challenges within the MS Office Suite. Showcase your ability to research solutions and overcome obstacles independently.
Next Steps
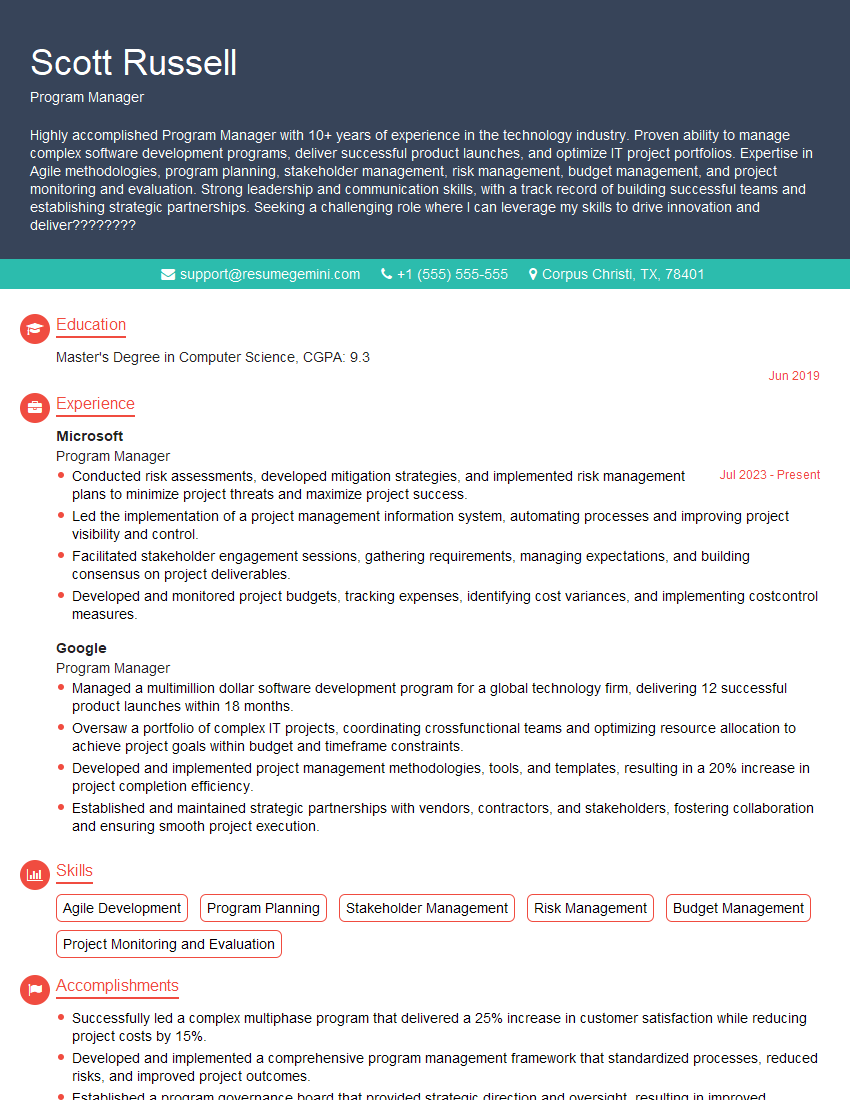
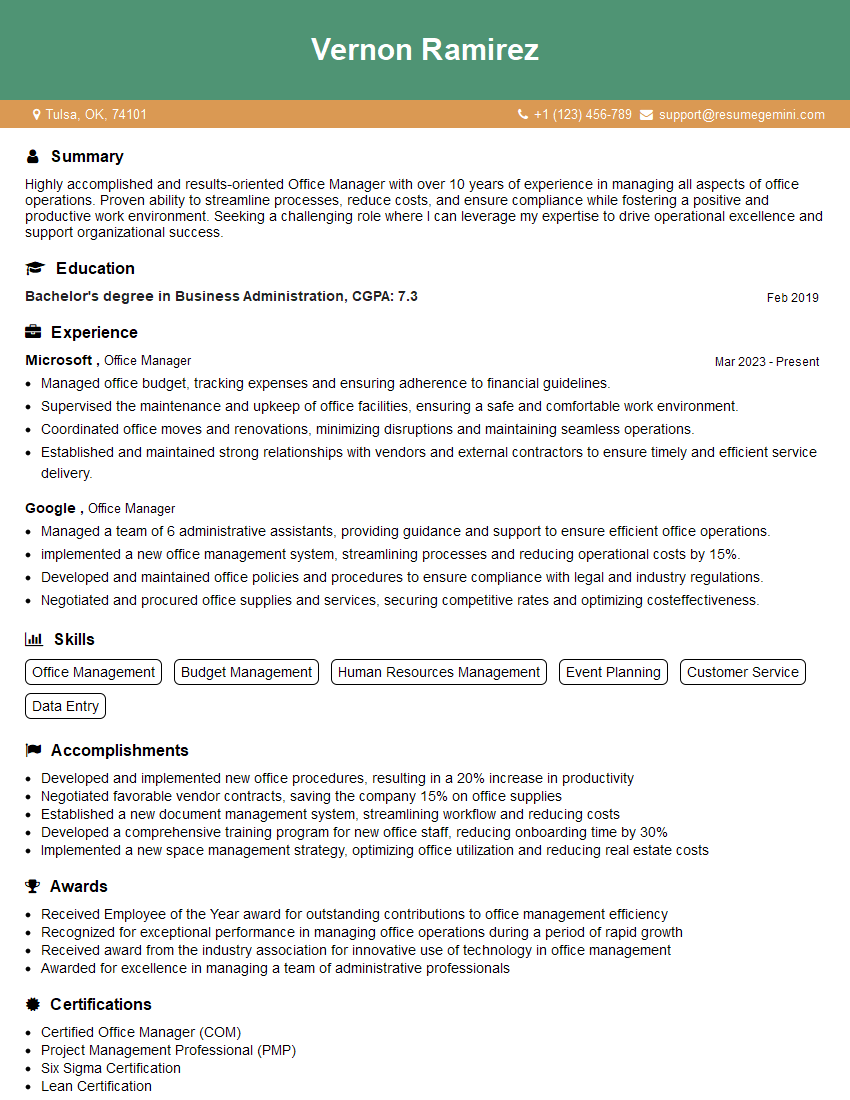
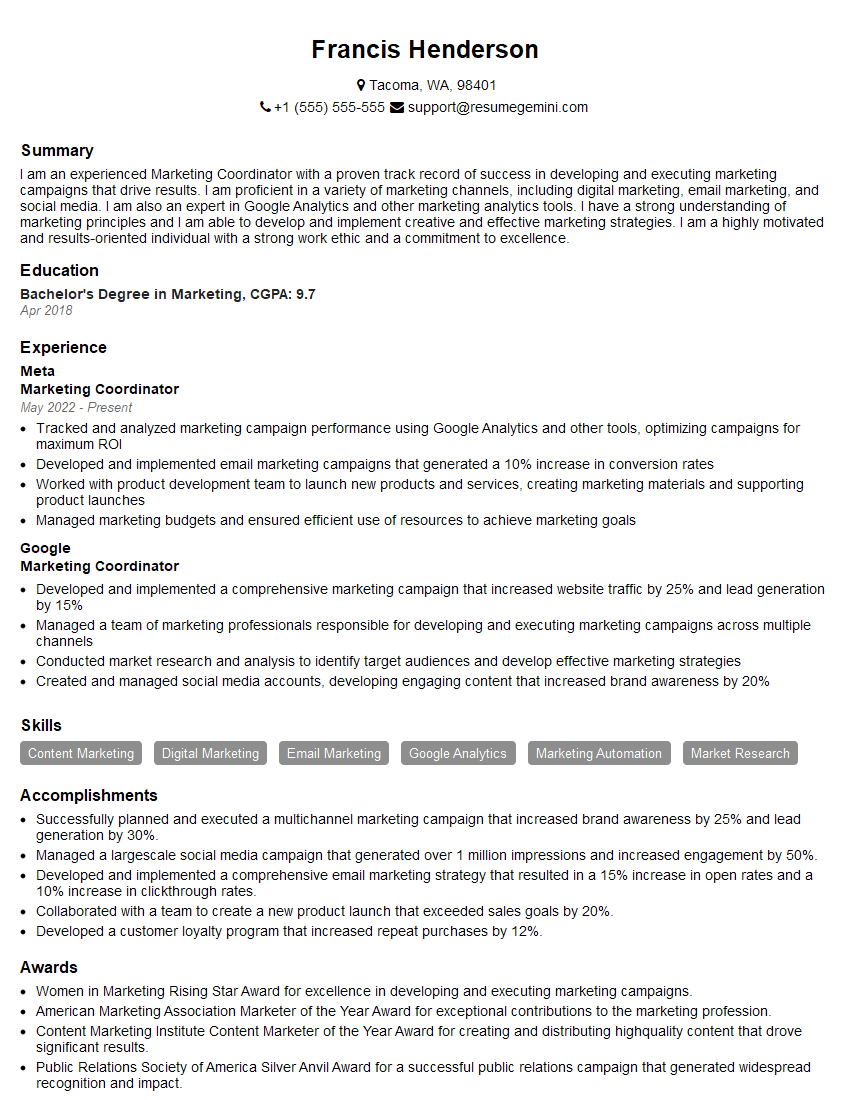
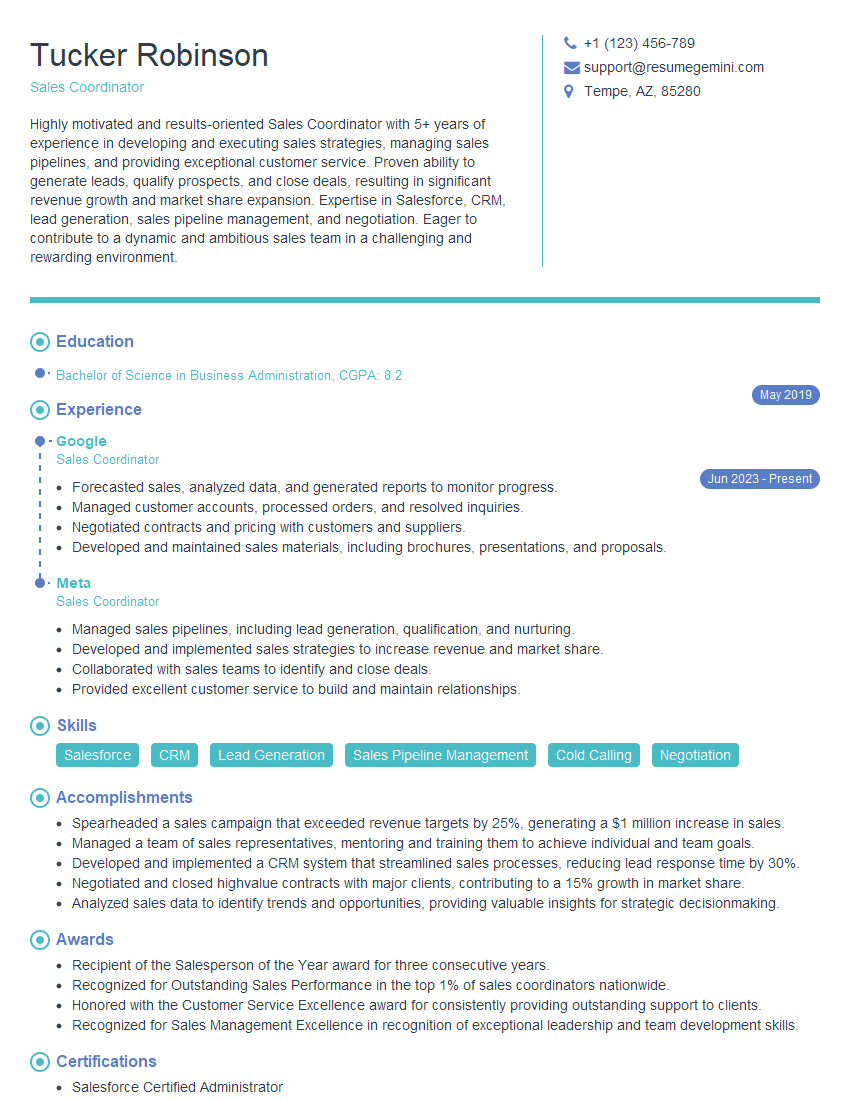
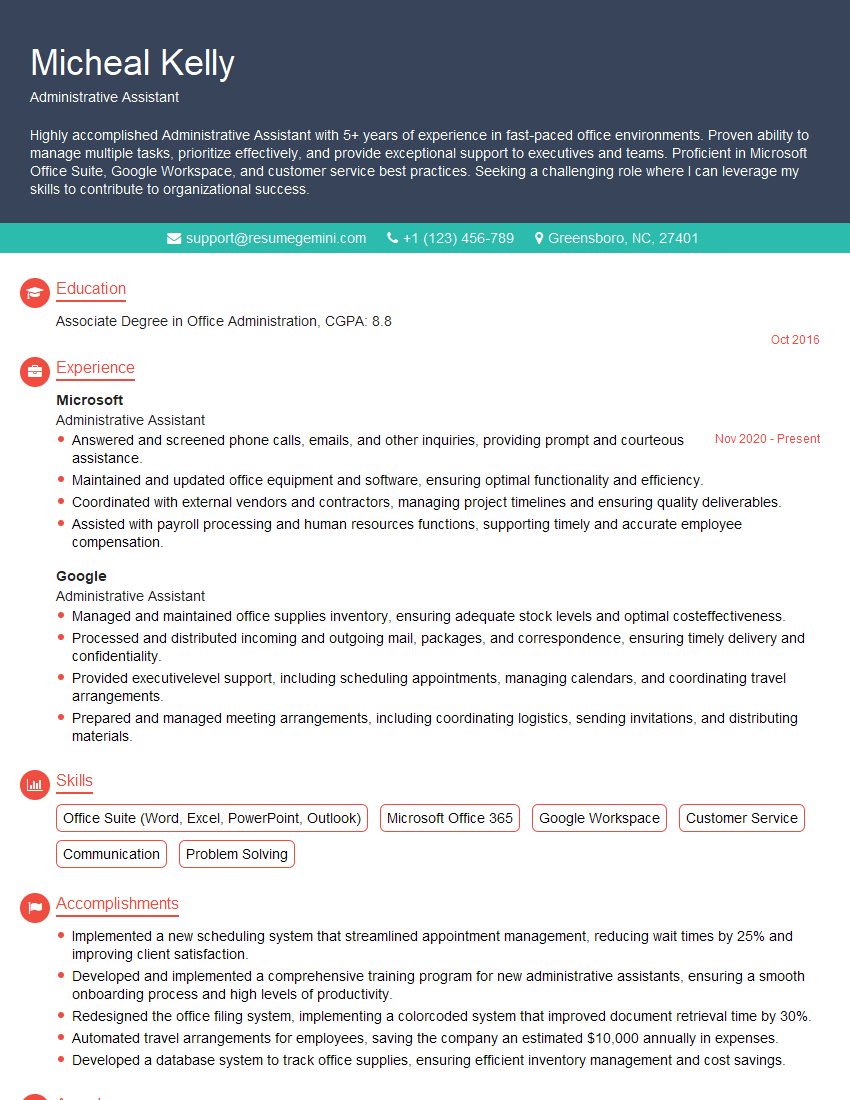
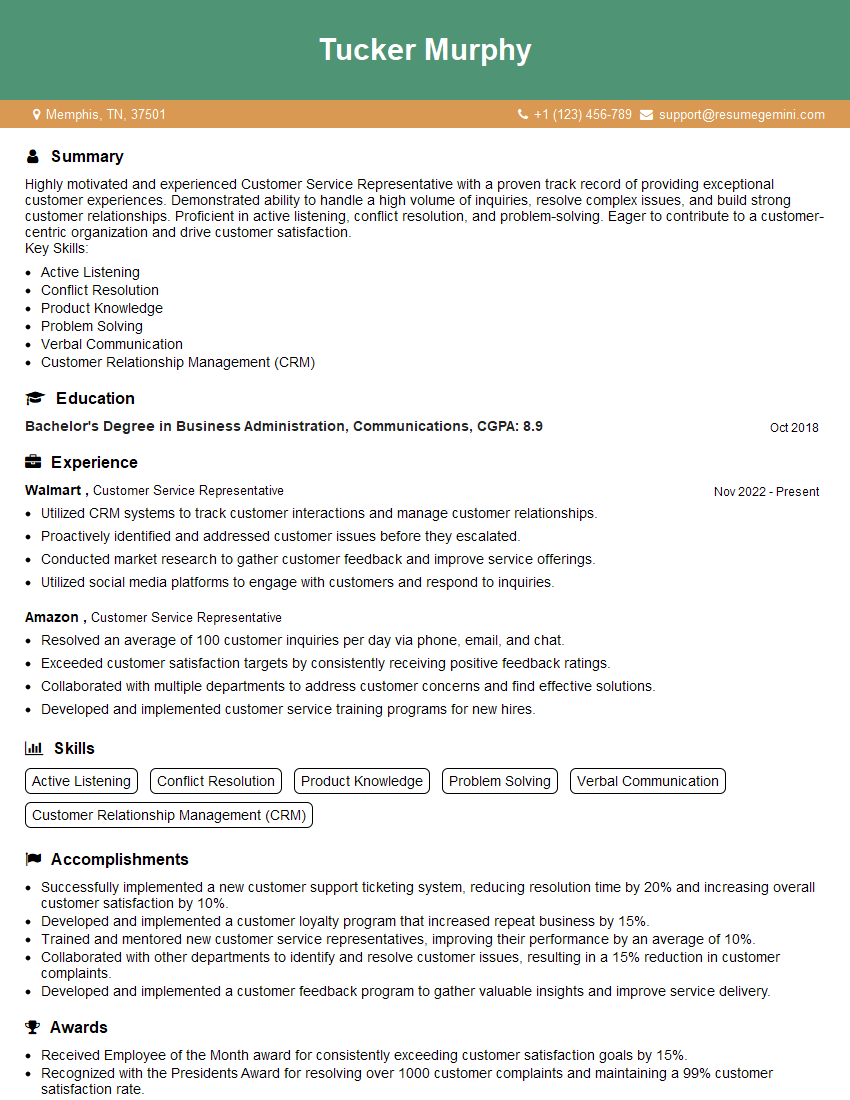
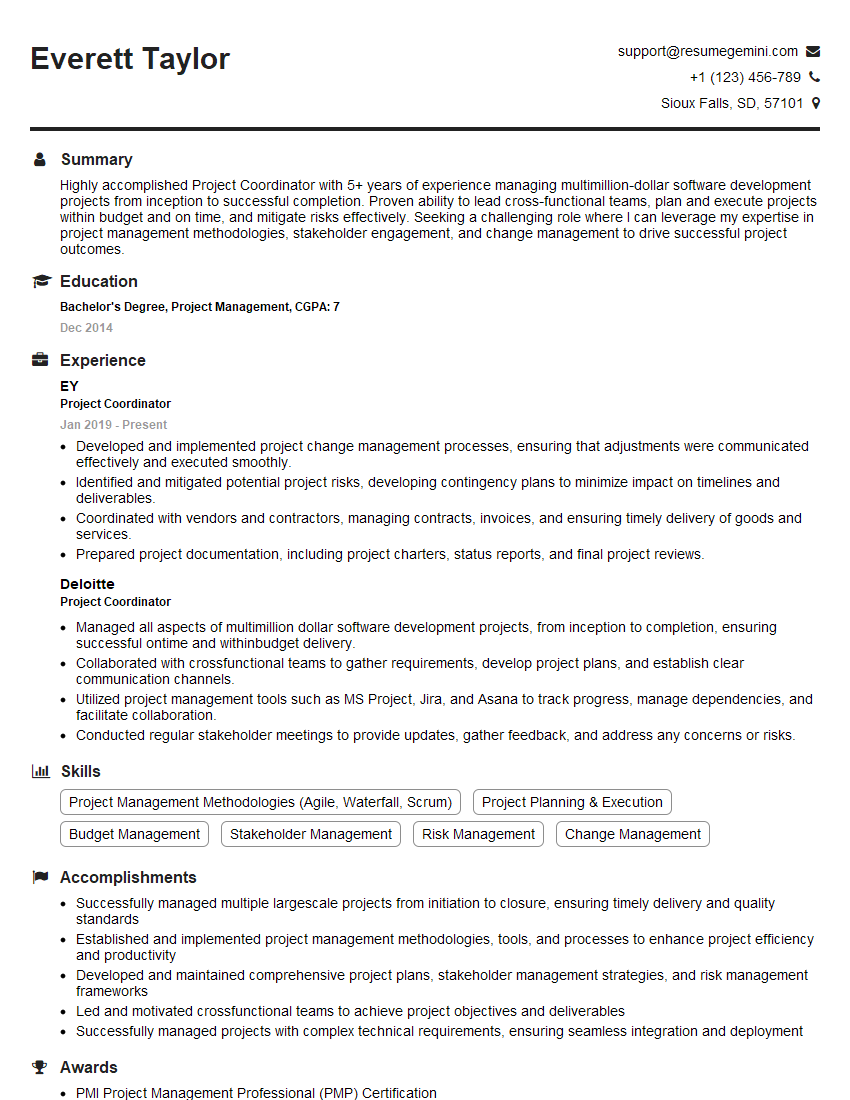
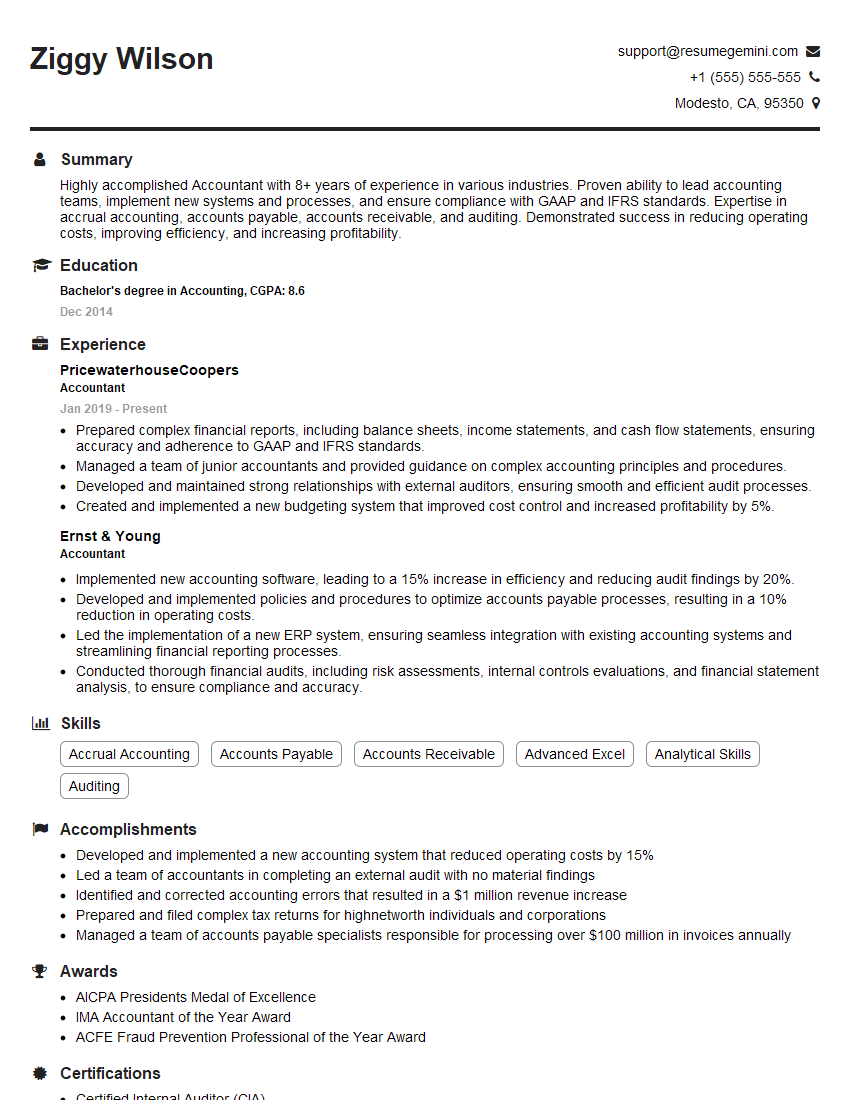
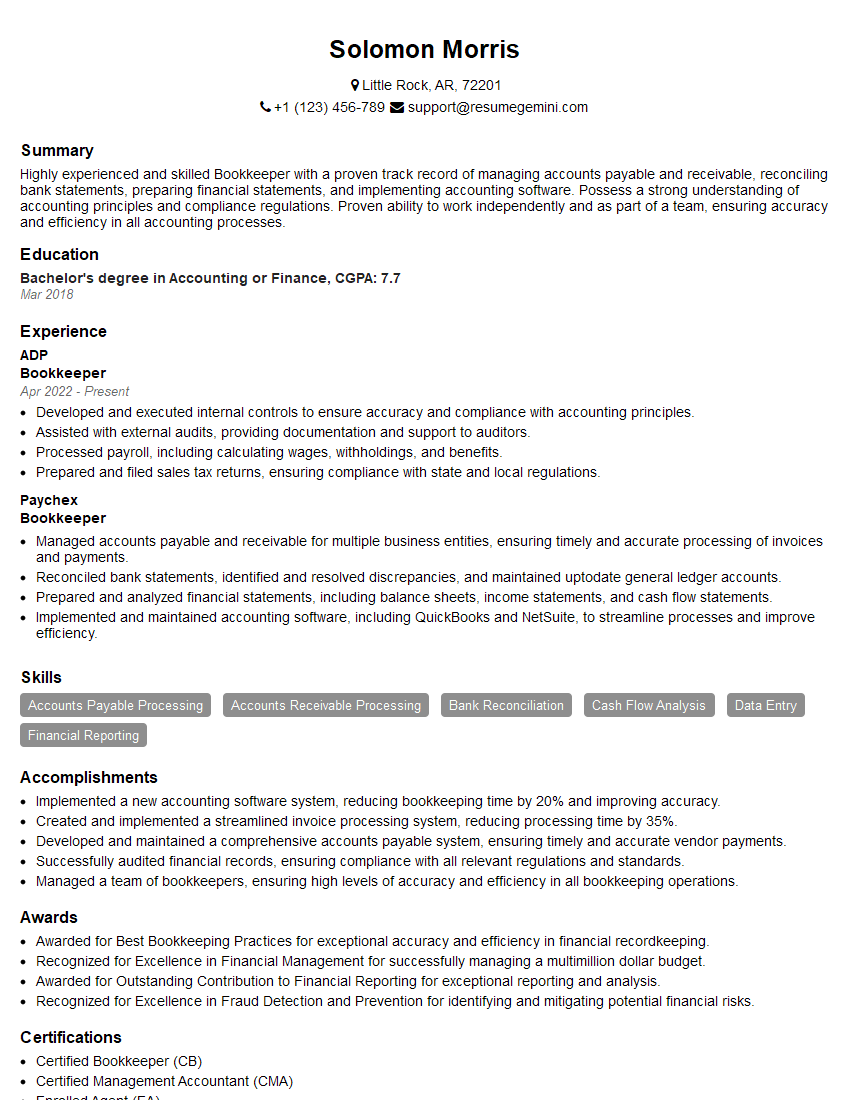
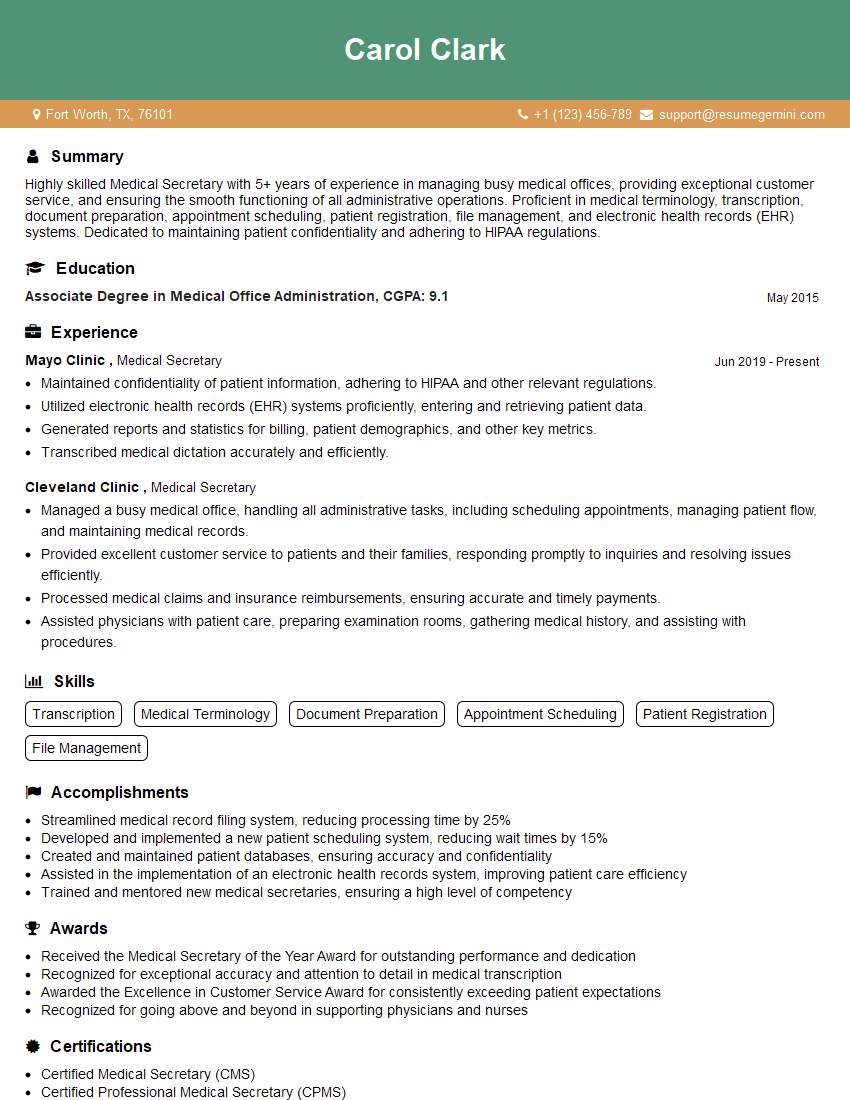
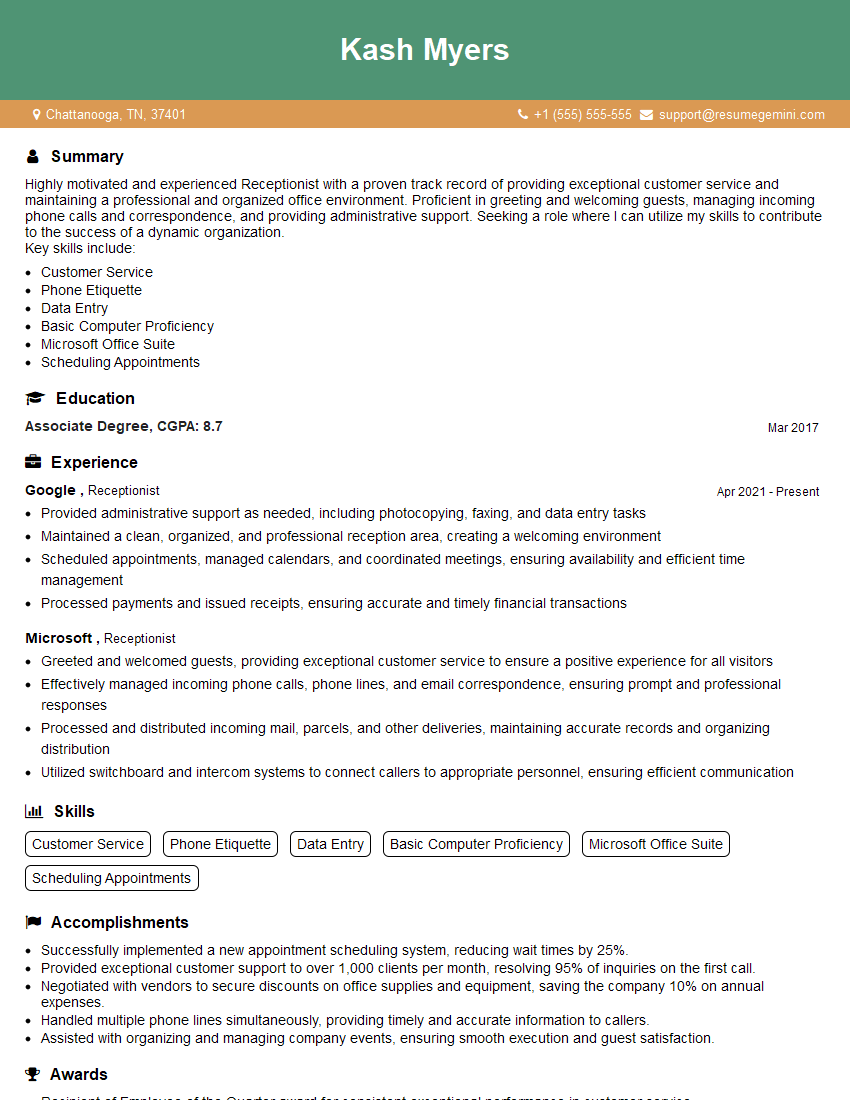
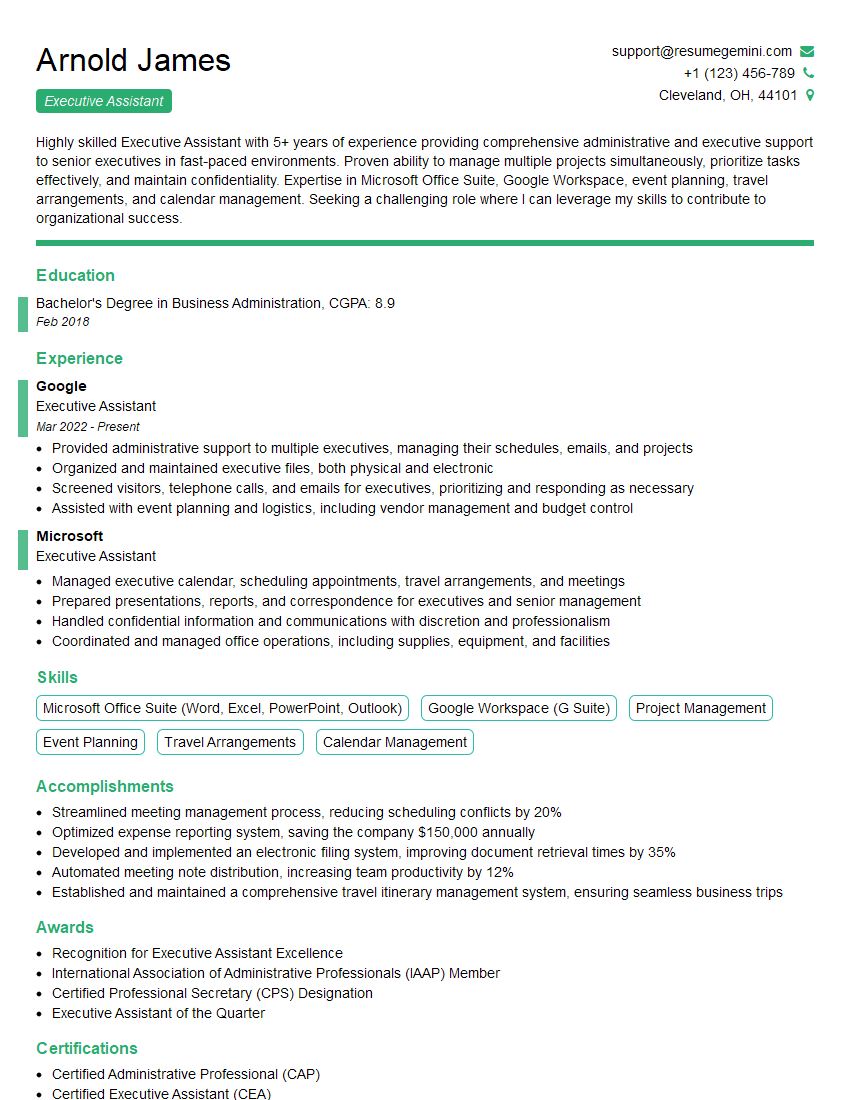
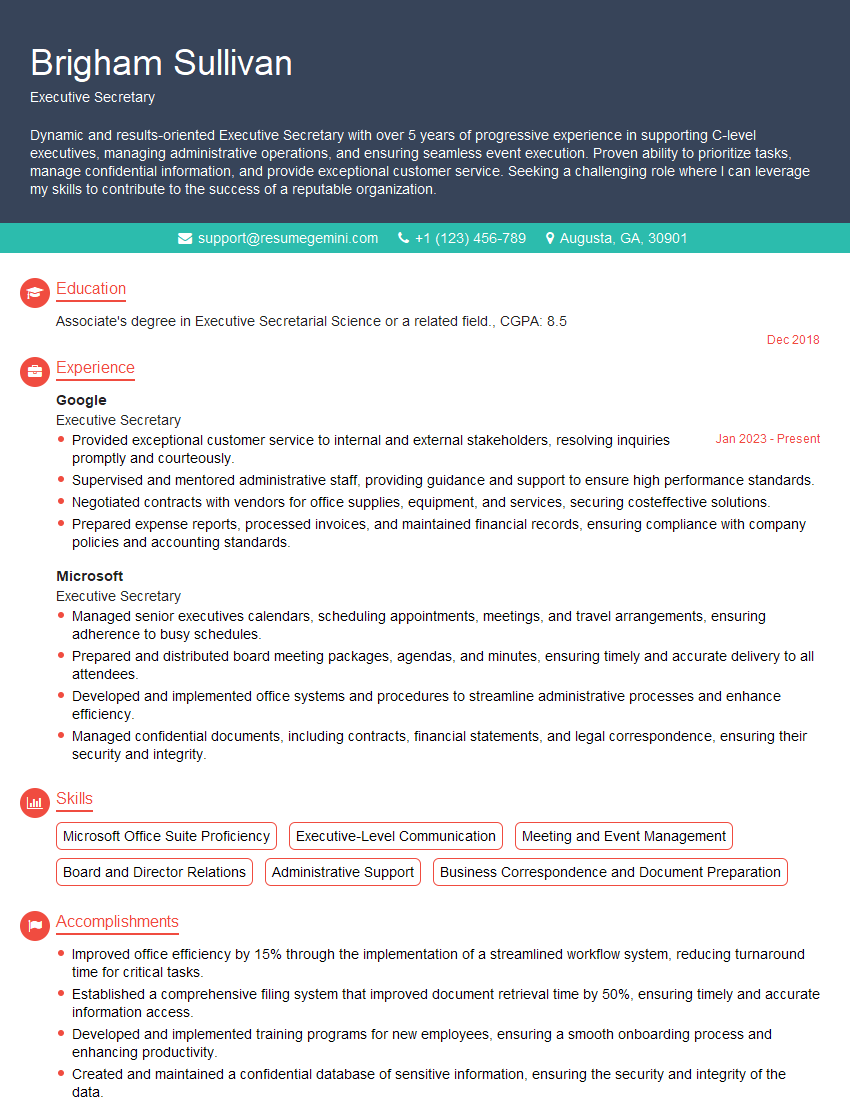
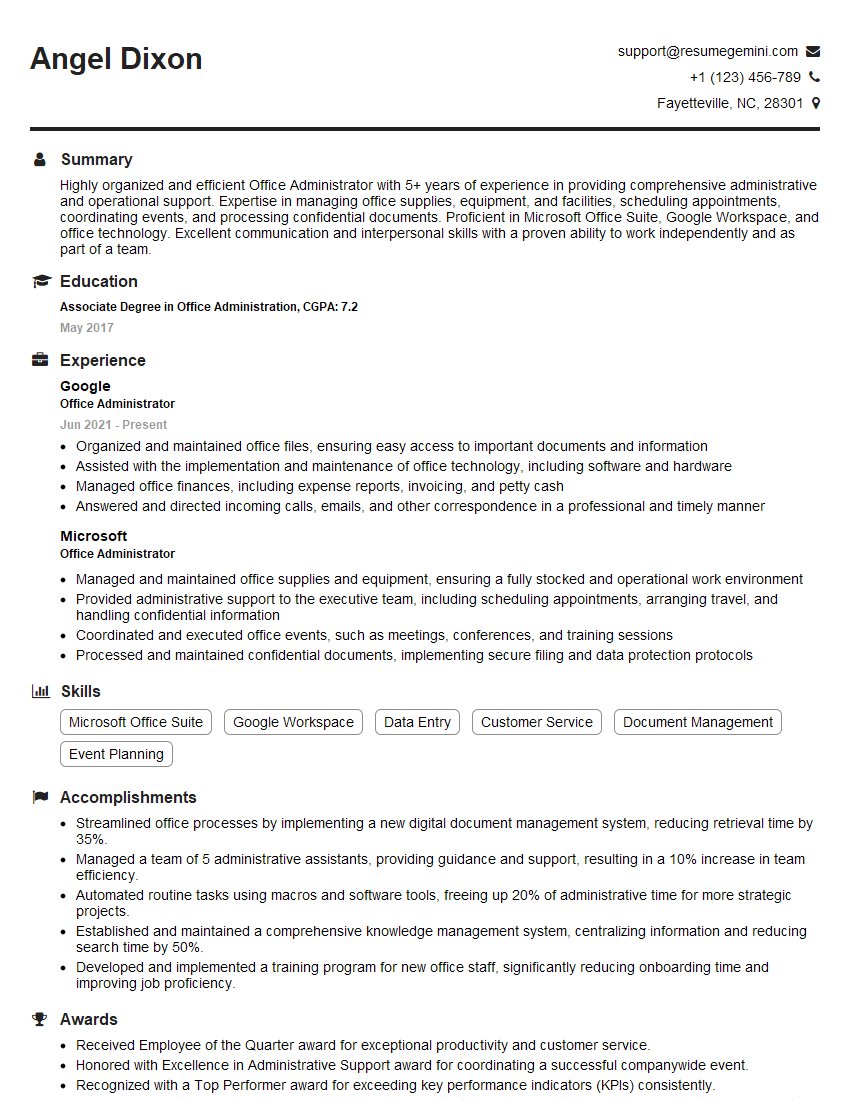
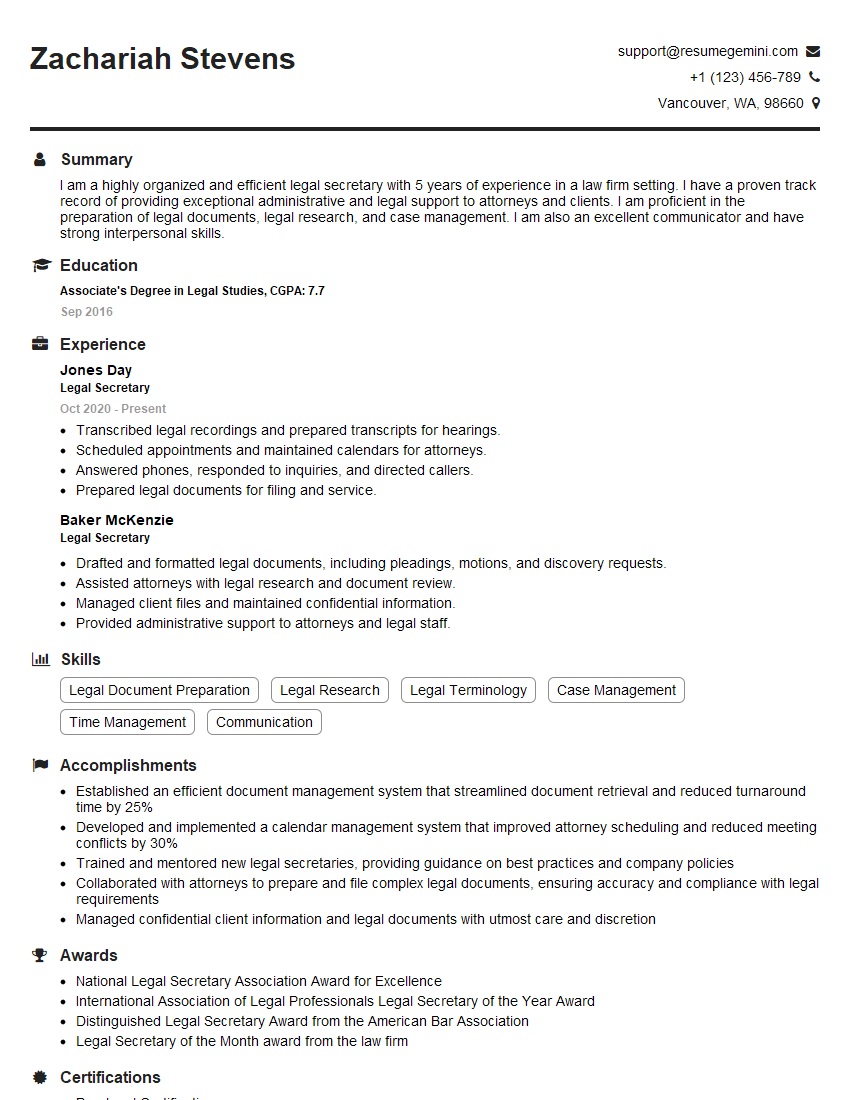
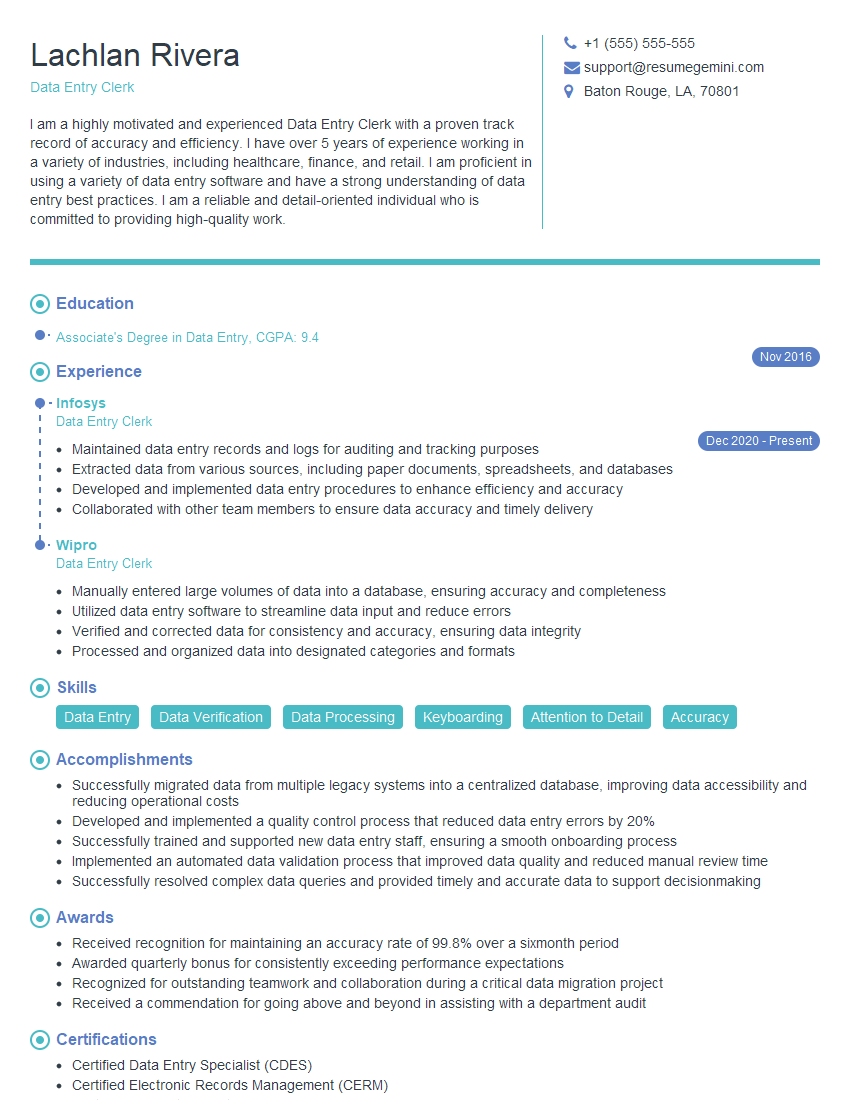
Mastering the MS Office Suite is invaluable for almost any career path, significantly enhancing your productivity and demonstrating essential workplace skills. A strong grasp of these tools will make you a more competitive candidate and open doors to a wider range of opportunities. To maximize your chances, focus on building an ATS-friendly resume that highlights your skills effectively. ResumeGemini is a trusted resource to help you create a professional and impactful resume that gets noticed by recruiters. Examples of resumes tailored to showcasing MS Office Suite proficiency are available through ResumeGemini to help guide your process.
Explore more articles
Users Rating of Our Blogs
Share Your Experience
We value your feedback! Please rate our content and share your thoughts (optional).
What Readers Say About Our Blog
Hello,
We found issues with your domain’s email setup that may be sending your messages to spam or blocking them completely. InboxShield Mini shows you how to fix it in minutes — no tech skills required.
Scan your domain now for details: https://inboxshield-mini.com/
— Adam @ InboxShield Mini
Reply STOP to unsubscribe
Hi, are you owner of interviewgemini.com? What if I told you I could help you find extra time in your schedule, reconnect with leads you didn’t even realize you missed, and bring in more “I want to work with you” conversations, without increasing your ad spend or hiring a full-time employee?
All with a flexible, budget-friendly service that could easily pay for itself. Sounds good?
Would it be nice to jump on a quick 10-minute call so I can show you exactly how we make this work?
Best,
Hapei
Marketing Director
Hey, I know you’re the owner of interviewgemini.com. I’ll be quick.
Fundraising for your business is tough and time-consuming. We make it easier by guaranteeing two private investor meetings each month, for six months. No demos, no pitch events – just direct introductions to active investors matched to your startup.
If youR17;re raising, this could help you build real momentum. Want me to send more info?
Hi, I represent an SEO company that specialises in getting you AI citations and higher rankings on Google. I’d like to offer you a 100% free SEO audit for your website. Would you be interested?
Hi, I represent an SEO company that specialises in getting you AI citations and higher rankings on Google. I’d like to offer you a 100% free SEO audit for your website. Would you be interested?
good
