The right preparation can turn an interview into an opportunity to showcase your expertise. This guide to Local Geography and Street Knowledge interview questions is your ultimate resource, providing key insights and tips to help you ace your responses and stand out as a top candidate.
Questions Asked in Local Geography and Street Knowledge Interview
Q 1. Describe your experience using mapping software (e.g., Google Maps, ArcGIS).
My experience with mapping software is extensive, encompassing both consumer-level applications like Google Maps and professional-grade Geographic Information Systems (GIS) software such as ArcGIS. With Google Maps, I regularly utilize its features for everyday navigation, including route planning, traffic monitoring, and exploring points of interest. This provides a strong foundation in understanding user interfaces and interpreting map data for practical purposes. My ArcGIS experience involves advanced spatial analysis, data manipulation, and map creation. I’m proficient in creating custom maps, analyzing geographic data sets, and performing geoprocessing tasks, which allows me to delve deeper into the complexities of geographic information and its applications. For example, I’ve used ArcGIS to analyze demographic data overlaid on a street network to identify areas needing improved public transportation access.
Q 2. Explain how you would determine the fastest route between two points, considering traffic and road closures.
Determining the fastest route between two points, considering traffic and road closures, involves a multi-step process. First, I’d input the origin and destination coordinates into a mapping application capable of real-time data integration, such as Google Maps or a dedicated navigation system. These applications usually employ algorithms that consider factors like distance, speed limits, and real-time traffic conditions. The application will then present several route options, highlighting the estimated travel time for each. However, to account for road closures, I would actively seek information from reliable sources like traffic news reports, official transportation websites, or even social media for up-to-the-minute alerts on road conditions. If a significant road closure is detected, I would manually adjust the route based on this updated information, potentially rerouting through alternative streets or highways. The choice of route would depend on the severity and location of the closure, considering factors like detour length and potential traffic congestion around the closure. For instance, if a major highway is closed, I might choose a longer, less congested route to avoid significant delays.
Q 3. What are some common challenges in urban navigation, and how would you address them?
Urban navigation presents several challenges. One common challenge is dealing with one-way streets, which require careful planning and adherence to traffic laws. Another challenge is dealing with unpredictable traffic patterns caused by rush hour, accidents, or construction. Additionally, finding parking in densely populated areas can be problematic. Finally, navigating complex road networks and dealing with confusing signage can add to the difficulty. I address these challenges through a combination of proactive measures and adaptability. Before embarking on a trip, I utilize mapping software to plan my route, taking into account one-way streets and potential congestion. I also incorporate real-time traffic information and pay attention to traffic news updates to avoid areas of high congestion. For parking, I often use parking apps to locate available spaces or park further away from my destination if necessary. When facing confusing signage, I double-check the information on my navigation system and prioritize my awareness of surroundings.
Q 4. How familiar are you with different types of maps (topographic, road, thematic)?
I’m very familiar with different map types. Topographic maps depict the physical features of the land, including elevation, contours, and hydrological features. These maps are crucial for understanding terrain and planning activities like hiking or construction projects. Road maps, on the other hand, focus on the transportation network, showing streets, highways, and other routes. These are essential for navigation and route planning. Thematic maps illustrate specific geographic data, such as population density, rainfall patterns, or disease prevalence. These maps are valuable tools for analyzing spatial patterns and trends. Understanding these map types allows me to select the most appropriate map for a given task and effectively interpret its information. For example, a topographic map would be necessary to plan a hiking trail across mountainous terrain, while a thematic map would be useful for analyzing the spread of a disease outbreak.
Q 5. Explain your understanding of geographic coordinate systems (latitude and longitude).
Geographic coordinate systems use latitude and longitude to pinpoint locations on the Earth’s surface. Latitude measures the angle north or south of the Equator, ranging from 0° at the Equator to 90° at the North and South Poles. Longitude measures the angle east or west of the Prime Meridian (passing through Greenwich, England), ranging from 0° to 180° east and west. These two coordinates, when used together, provide a unique location for every point on Earth. It’s important to understand that these are angular measurements, not distances. The distance represented by one degree of latitude or longitude varies depending on the location on Earth. This system is fundamental to GPS technology and many GIS applications. For example, the coordinates 34.0522° N, 118.2437° W would pinpoint a location in Los Angeles, California.
Q 6. How would you identify and interpret geographic features on a map?
Identifying and interpreting geographic features on a map involves understanding map symbols and conventions. Different symbols represent various features, like roads, buildings, rivers, and mountains. Map legends provide a key to understanding these symbols. Furthermore, contour lines on topographic maps represent elevation changes, allowing me to identify hills, valleys, and slopes. Scale is also critical in determining the actual size and distance between features. For instance, a symbol of a small blue line usually indicates a river, while brown contour lines depict elevation changes. By combining this knowledge with an understanding of the map’s purpose, I can accurately identify and interpret the geographical features presented.
Q 7. Describe your experience with GPS technology and its limitations.
My experience with GPS technology is extensive, from using handheld GPS devices to integrating GPS data into GIS applications. GPS works by receiving signals from multiple satellites to determine a precise location. However, GPS has limitations. Signal strength can be affected by atmospheric conditions, tall buildings, or dense foliage, leading to inaccurate location readings or signal loss. Urban canyons can create signal blockage and multipath errors, where signals bounce off buildings, creating inaccuracies. Another limitation is the precision of the data, with common consumer-grade GPS offering accuracy of only several meters. While GPS is an invaluable tool, it’s important to be aware of these limitations and to use it in conjunction with other navigation aids when necessary. For example, I’ve had instances where GPS was unreliable in dense forest environments, requiring me to rely on maps and compasses to navigate effectively.
Q 8. How do you stay updated on local road changes and construction projects?
Staying updated on local road changes and construction is crucial for accurate navigation and route planning. I employ a multi-pronged approach.
- Official Government Websites and Apps: I regularly check the transportation departments’ websites and mobile apps for city and state road construction updates, detours, and planned closures. These sources provide official information, often including timelines and maps.
- Local News and Media: Local news sources, both online and broadcast, often report on significant road closures or traffic incidents. This provides real-time updates on unexpected events that impact traffic flow.
- Navigation Apps: Navigation apps like Google Maps and Waze use crowd-sourced data and integrate official information to dynamically update road conditions and suggest alternate routes. I regularly monitor these apps to gain real-time insights.
- Social Media Monitoring: Monitoring relevant social media hashtags and groups for local traffic and road conditions can offer valuable supplementary information, especially for smaller-scale, short-term disruptions not yet reflected on official channels.
- Subscription Services: Some professional services provide real-time traffic data and predictive analytics, which can be invaluable for optimizing routes and avoiding congestion. For example, a subscription to a traffic management platform would provide comprehensive data.
By combining these resources, I ensure a comprehensive understanding of the current road network and plan accordingly.
Q 9. How would you assess the accessibility of a location for people with disabilities?
Assessing location accessibility for people with disabilities involves a thorough evaluation beyond just looking at a map. It’s a multi-faceted assessment that encompasses several key areas.
- Curb Ramps and Sidewalks: I examine the presence and condition of curb ramps, ensuring they are properly sloped, unblocked, and free from cracks or damage. I also assess sidewalk width and continuity to confirm sufficient space for wheelchair navigation.
- Building Entrances: Accessible building entrances require ramps or level entry points, wide doorways, and automatic door openers where appropriate. I would verify the presence and functionality of these features.
- Parking Availability: Adequate and accessible parking is critical. I check for the number of designated accessible parking spaces, their proximity to the entrance, and their compliance with size and signage regulations.
- Interior Accessibility: While not always part of an external assessment, understanding the accessibility of interior spaces—such as elevators, restroom accessibility, and appropriate signage— is part of a complete accessibility audit.
- Public Transportation Access: For locations that depend on public transportation, I consider the proximity to accessible bus stops or train stations and the availability of ramps, elevators, and other assistive devices within the transit system.
I use a combination of field observations and online resources like Google Street View and publicly available accessibility guides to conduct a comprehensive assessment. For a detailed evaluation, using a checklist specifically designed for accessibility audits is essential.
Q 10. How would you calculate travel time and distance between two locations using various transportation modes?
Calculating travel time and distance between two locations depends heavily on the chosen mode of transportation. Here’s a breakdown:
- Driving: I use navigation apps like Google Maps or Waze. These apps factor in real-time traffic conditions, road closures, and typical speeds to provide accurate estimations. For longer distances, I would consider potential traffic delays and rest stops.
- Public Transit: I utilize public transit apps or websites (like those provided by city transit agencies). These tools provide schedules, route information, and estimated travel times based on scheduled service. I always account for potential delays.
- Walking or Cycling: For shorter distances, I can use mapping tools to calculate the distance based on street-level routes. I account for walking or cycling speeds, potentially factoring in terrain elevation changes.
- Other Modes (e.g., Taxi, Ride-sharing): Navigation apps or ride-sharing platforms usually provide estimated travel times and distances based on real-time traffic and driver availability. These are less predictable than public transit.
Example: To calculate the driving time between Point A and Point B, I would input the addresses into Google Maps and note the suggested travel time. To determine the public transit time, I would input the same locations into the city’s transit app and check the various routes and their scheduled times. Always remember that these are estimations and actual travel time might vary.
Q 11. Describe your familiarity with different types of terrain and their impact on navigation.
My familiarity with different terrains is crucial for accurate navigation and route planning. Different terrains significantly impact travel time, mode of transportation, and the overall feasibility of a route.
- Flat Terrain: This presents the least challenge, allowing for relatively easy and fast movement using various transportation modes. Travel time estimations are more reliable.
- Hilly or Mountainous Terrain: This significantly increases travel time and requires adjusting speed calculations for vehicles and walking or cycling. Steep inclines and declines pose safety concerns and require careful route planning.
- Urban Terrain: Characterized by dense buildings, traffic congestion, and complex road networks, urban areas require consideration of traffic patterns, one-way streets, and potential obstacles. Route planning necessitates detailed knowledge of the local street network.
- Rural Terrain: Rural areas often feature unpaved roads, limited infrastructure, and potentially challenging weather conditions. This requires adjusting travel times based on road quality and the potential need for 4×4 vehicles.
- Water Bodies: Navigation involving water requires specialized knowledge. I would need to factor in ferry schedules, water conditions, and potentially weather conditions impacting travel.
I incorporate terrain data from various sources (topographic maps, elevation data in GIS software) into my route planning to determine the most effective and safe route for the chosen mode of transportation.
Q 12. How would you optimize a delivery route for multiple stops, considering time and distance constraints?
Optimizing a delivery route for multiple stops involves employing techniques that minimize total travel distance and time. This is a classic Vehicle Routing Problem (VRP).
- Clustering: Grouping nearby stops together reduces overall travel distance. This can be achieved using algorithms or visually grouping stops on a map.
- Algorithms: Specialized algorithms like the Traveling Salesperson Problem (TSP) or more advanced VRPs help determine the optimal route sequence, minimizing total distance or time. Many delivery software programs leverage such algorithms.
- Time Window Constraints: If there are delivery time windows (e.g., 9:00 am – 10:00 am), the algorithm needs to incorporate these constraints. Stops must be sequenced to meet those deadlines.
- Real-Time Traffic Data: Incorporating live traffic conditions into the routing process significantly improves route efficiency by avoiding traffic jams.
- Vehicle Capacity: If multiple vehicles are available, the algorithm should distribute stops efficiently across the vehicles, balancing load and travel time.
Example: A simple approach for a few stops could be manually mapping locations and visually determining the shortest route that considers time windows, but for many stops, using specialized route optimization software is necessary. Many delivery companies employ sophisticated software that automatically optimizes delivery routes.
Q 13. Explain your understanding of spatial analysis techniques.
Spatial analysis techniques involve analyzing geographic data to understand patterns, relationships, and trends. It’s like detective work with maps!
- Buffer Analysis: Creating a zone around a feature (e.g., a school) to identify nearby features (e.g., homes, businesses). This is useful for determining service areas or impact zones.
- Overlay Analysis: Combining multiple map layers (e.g., soil type, elevation, land use) to identify areas that meet specific criteria. This is crucial for site selection or environmental impact assessments.
- Network Analysis: Analyzing connections between locations (e.g., road network, transportation lines) to optimize routes, identify bottlenecks, or model flow of goods or people.
- Spatial Interpolation: Estimating values at unsampled locations based on data at known locations. This is helpful for creating continuous surfaces from point data (e.g., creating a temperature map from scattered weather stations).
- Proximity Analysis: Measuring the distance between features or calculating the nearest neighbor. This is often used in facility location planning or market analysis.
These techniques are used extensively in various fields, including urban planning, environmental science, logistics, and public health. GIS software provides the tools to perform these analyses.
Q 14. What are some common sources of geographic data, and how can you evaluate their reliability?
Geographic data comes from various sources, each with varying degrees of reliability.
- Government Agencies: Sources like the US Census Bureau, USGS (United States Geological Survey), and local planning departments provide high-quality, reliable data on demographics, topography, and land use. Their data is usually rigorously reviewed and updated.
- Commercial Data Providers: Companies like Esri, TomTom, and HERE offer detailed maps, imagery, and other geographic data, but their data comes at a cost. Their reliability generally is high but is dependent upon their update cycles.
- Crowdsourced Data: Platforms like OpenStreetMap (OSM) rely on contributions from users. While this is a valuable source, quality can vary depending on the area and level of contribution. It’s important to check the data’s age and accuracy.
- Remote Sensing Data: Satellite imagery and aerial photographs provide visual information about the earth’s surface. High-resolution imagery is highly detailed but can be expensive. Their reliability depends on image quality and processing techniques.
- In-situ Measurements: This refers to data collected directly on the ground (e.g., GPS coordinates, field surveys). The reliability depends heavily on the accuracy of the measurement tools and methodology used.
Evaluating reliability involves considering data source reputation, data age, and consistency. Comparing data from multiple sources can help verify accuracy and identify discrepancies.
Q 15. Describe your experience working with large datasets of geographic information.
Working with large geographic datasets is a core part of my expertise. I’m proficient in handling various formats, including shapefiles, GeoJSON, and databases like PostGIS. My experience involves cleaning, processing, and analyzing data using tools like QGIS and ArcGIS. This includes tasks such as:
- Data Cleaning: Identifying and correcting inconsistencies, errors, and missing values in the data.
- Spatial Analysis: Performing operations like buffer analysis, overlay analysis, and proximity analysis to derive meaningful insights.
- Data Visualization: Creating maps and charts to communicate spatial patterns and relationships effectively. For example, I recently used a large dataset of traffic incidents to identify high-risk areas within a city, leading to recommendations for improved traffic management.
- Data Integration: Combining data from multiple sources to create a comprehensive geographic picture. For instance, I’ve integrated census data with crime statistics to understand the relationship between demographics and crime rates.
I’m comfortable with both vector and raster data and understand the nuances of working with different coordinate systems and projections. My experience ensures accurate and insightful analysis of even the most complex geographic datasets.
Career Expert Tips:
- Ace those interviews! Prepare effectively by reviewing the Top 50 Most Common Interview Questions on ResumeGemini.
- Navigate your job search with confidence! Explore a wide range of Career Tips on ResumeGemini. Learn about common challenges and recommendations to overcome them.
- Craft the perfect resume! Master the Art of Resume Writing with ResumeGemini’s guide. Showcase your unique qualifications and achievements effectively.
- Don’t miss out on holiday savings! Build your dream resume with ResumeGemini’s ATS optimized templates.
Q 16. How would you identify potential safety concerns associated with a particular route or location?
Identifying safety concerns along a route or at a location requires a multi-faceted approach. I begin by considering several factors:
- Crime Data: Analyzing crime statistics for the area, focusing on incidents like robberies, assaults, and vandalism. Online resources and police department databases are valuable here.
- Infrastructure: Assessing the condition of roads, sidewalks, and street lighting. Poorly lit areas or roads with significant potholes pose risks.
- Traffic Patterns: Studying traffic flow and volume to pinpoint high-risk areas such as intersections with many accidents or roads with high speeds and few pedestrian crossings.
- Environmental Factors: Considering potential hazards like steep inclines, unstable terrain, or areas prone to flooding.
- Community Feedback: Reviewing reports and feedback from residents, businesses, or law enforcement about safety issues.
For example, a poorly lit alleyway with a history of robberies would immediately be flagged as a high-risk area. By combining these data points, I can create a comprehensive safety assessment and suggest mitigations, such as improved lighting, increased police patrols, or improved signage.
Q 17. How would you interpret and utilize demographic data related to a specific geographic area?
Demographic data provides crucial insights for understanding the characteristics of a population within a specific geographic area. This information can be used in various applications, such as urban planning, business development, and social services.
My approach involves:
- Data Acquisition: Sourcing demographic information from reliable sources like census data, market research reports, and government agencies.
- Data Interpretation: Analyzing variables such as age, income, education, ethnicity, and household size to understand the population’s composition.
- Spatial Analysis: Mapping demographic data to identify clusters and spatial patterns. For example, identifying areas with a high concentration of elderly residents would help in planning for senior-focused services.
- Correlation Analysis: Exploring the relationship between demographic variables and other factors like crime rates or business performance to inform strategic decisions.
For example, I recently used demographic data to help a client determine the optimal location for a new grocery store. By identifying an area with a large population, high disposable income, and limited access to fresh food, we were able to maximize the likelihood of success.
Q 18. How would you use local geography and street knowledge to solve a customer service issue?
My local geography and street knowledge are invaluable assets in resolving customer service issues. Consider a scenario where a customer reports a delivery problem. Knowing the local street layout, traffic patterns, and potential delivery challenges (e.g., limited access, one-way streets) allows me to quickly understand the situation and find a solution.
For instance, if a customer reports a missed delivery in a complex apartment building with multiple entrances, I can use my knowledge to determine the most efficient way to contact the building management, or even provide alternative delivery options based on my understanding of the area’s accessibility. This saves time and improves customer satisfaction.
Similarly, if there’s a service outage in a particular neighborhood, familiarity with the underlying infrastructure (e.g., knowing which streets run parallel to the main utility lines) allows me to better assist in assessing the scope and impact of the problem and provide more accurate estimates on restoration times. This kind of detailed local knowledge provides context that simply can’t be obtained from digital maps alone.
Q 19. Describe a time you had to navigate an unfamiliar area. How did you approach it?
Navigating unfamiliar areas requires a systematic approach. Recently, I had to navigate a rural area in a remote part of the state for a field survey. My approach was:
- Pre-Trip Planning: I studied detailed maps beforehand, identifying key landmarks and alternative routes.
- Technology Utilization: I used GPS navigation, but also carried a paper map as a backup in case of technological failure.
- Local Inquiry: I asked locals for directions when necessary, demonstrating respect and actively listening to their advice, which often included valuable insights beyond map data.
- Flexibility: I remained adaptable and flexible to unexpected road closures or detours.
- Observation: I paid close attention to road signs, landmarks, and changes in the terrain.
This combination of preparation and adaptability allowed me to reach my destination safely and efficiently, even in challenging conditions.
Q 20. How familiar are you with local zoning regulations and their impact on location-based decisions?
Familiarity with local zoning regulations is critical for informed location-based decisions. These regulations dictate what can and cannot be built in a specific area, impacting everything from residential development to commercial projects. For example, knowing zoning classifications (residential, commercial, industrial) helps determine the suitability of a site for a particular business. Understanding regulations regarding building height, setbacks, parking requirements, and density limits is essential for planning and avoiding costly delays or legal issues.
I regularly consult local zoning ordinances and maps to assess the feasibility of projects. This involves understanding the impact of different zoning designations on property values, development costs, and overall project viability. I also consider the potential for zoning changes and their implications for long-term planning. For instance, a zoning change allowing higher density housing near a transit hub could significantly impact the desirability and value of nearby properties.
Q 21. How would you estimate the population density of a specific area based on available data?
Estimating population density requires leveraging available data sources and applying appropriate methodologies. The most accurate method depends on the data available.
Methods:
- Census Data: If census data is available at a granular level (e.g., block group or census tract), it provides the most accurate way to estimate population density by dividing the population count by the area of the geographic unit.
- Address-based data: If you have access to a reliable address database, you can use this information (combined with a GIS system) to estimate the number of residential units in an area and then leverage occupancy rates to estimate population count.
- Sampling techniques: If data is limited, using sampling methods may be necessary. This approach involves randomly selecting representative samples from within the area and extrapolating to estimate the population density for the entire area.
Example: To estimate the population density of a neighborhood using census data, I would obtain the total population count from census records for that neighborhood and divide it by its total area (usually obtained from GIS tools or land-use maps). This gives me the population per square kilometer or mile, providing a clear picture of population density.
Q 22. Describe your experience using GIS software for route optimization or spatial analysis.
GIS software is invaluable for route optimization and spatial analysis. My experience spans several years, working extensively with ArcGIS and QGIS. I’ve used these tools to solve various problems, from finding the most efficient delivery routes for a logistics company to identifying optimal locations for new retail outlets.
For route optimization, I typically leverage network analysis tools. This involves importing road network data, defining origin and destination points, and then using algorithms like Dijkstra’s algorithm or the Traveling Salesperson Problem solver to find the shortest or most efficient routes, considering factors like distance, travel time, and road restrictions. For example, I once optimized delivery routes for a pizza chain, reducing delivery times by 15% by identifying shorter routes and avoiding congested areas during peak hours.
Spatial analysis involves manipulating and interpreting geographically referenced data. I’ve used GIS to perform tasks like buffer analysis (identifying areas within a certain distance of a point or line), overlay analysis (combining multiple layers of data to identify relationships), and proximity analysis (measuring distances between features). A recent project involved analyzing crime data overlaid with demographic information to identify areas with high crime rates and low socio-economic indicators, assisting in resource allocation for law enforcement.
Q 23. How would you assess the economic impact of a proposed infrastructure project on a local area?
Assessing the economic impact of an infrastructure project requires a multi-faceted approach. It involves analyzing both direct and indirect effects on the local economy.
- Direct Impacts: These are the immediate, readily quantifiable effects, like job creation during construction, increased property values near the project, and direct spending by the project developers. For instance, a new highway might increase property values along its route.
- Indirect Impacts: These are more subtle and harder to quantify, such as increased tourism due to improved accessibility, stimulation of local businesses, and changes in commuting patterns leading to reduced transport costs. A new bridge connecting a previously isolated town might greatly benefit local businesses by attracting tourists and boosting trade.
To perform this assessment, I would gather data on employment, property values, business revenue, and transportation costs before and after the project. I would then use econometric modeling techniques and GIS to compare these data sets and quantify the changes attributable to the infrastructure project. This could involve cost-benefit analysis to weigh the project’s costs against its economic benefits.
Q 24. Describe your experience working with real-time traffic data to optimize travel routes.
Working with real-time traffic data is crucial for optimizing travel routes in dynamic environments. I have experience integrating data feeds from various sources, including Google Maps APIs, traffic sensors, and incident reporting systems, into GIS and route optimization software.
My approach involves constantly updating the route based on the latest traffic information. Algorithms are used to recalculate the optimal path by considering speed, congestion levels, and potential delays. This is particularly useful for navigation apps or fleet management systems, which can offer real-time route adjustments to avoid traffic jams and minimize travel time. For example, I worked on a project where we developed a system that automatically rerouted delivery trucks around traffic accidents, significantly reducing delivery delays.
The key is to choose appropriate algorithms that can handle the large volumes of real-time data efficiently, while considering accuracy and computational limitations.
Q 25. How would you identify areas prone to flooding or other natural hazards based on geographic data?
Identifying areas prone to flooding or other natural hazards involves analyzing various geographic data layers using GIS. This is a crucial step in disaster preparedness and mitigation.
- Elevation Data: Digital Elevation Models (DEMs) provide information about the terrain’s elevation, which helps identify low-lying areas susceptible to flooding.
- Hydrological Data: Data on river systems, drainage patterns, and historical rainfall patterns helps model the potential extent of flooding. GIS tools can simulate the flow of water based on these data.
- Geological Data: Information on soil type, geology, and fault lines helps assess the risk of landslides and other geological hazards.
- Historical Hazard Data: Historical records of flooding, earthquakes, and other hazards provide crucial information about areas previously affected.
By overlaying these data layers in a GIS, we can identify areas where multiple risk factors converge, indicating a higher probability of future hazards. This information can be used to develop effective mitigation strategies, such as improved drainage systems, building codes, or evacuation plans.
Q 26. How would you use local street knowledge to identify potential business opportunities?
Local street knowledge is a powerful tool for identifying business opportunities. It’s about understanding the nuances of a neighborhood: its demographics, traffic patterns, existing businesses, and potential gaps in the market.
For instance, observing high foot traffic in a specific area with limited nearby coffee shops suggests a potential opportunity for a new café. Similarly, noticing an influx of young families moving into a neighborhood might indicate a need for family-oriented businesses. Identifying areas with a lack of parking might point towards opportunities for parking services or off-street parking development.
Furthermore, my street-level understanding includes knowledge of local zoning regulations, which are often visually evident (e.g., commercial vs. residential zones). This helps assess the feasibility of different business ideas based on zoning allowances.
Q 27. How familiar are you with street naming conventions and addressing systems?
I am very familiar with street naming conventions and addressing systems. This knowledge is crucial for accurate geographic referencing and data management. Different regions have varying conventions.
For example, in many North American cities, street names often follow a grid pattern, while European cities might have more complex, historically evolved naming systems. Understanding these differences is critical when working with geographic data from diverse sources. Furthermore, I understand the importance of address ranges within a street. Understanding the system of even/odd numbering on opposite sides of the street, which provides context for relative locations along that street.
My knowledge extends to different addressing systems, including the use of zip codes, postal codes, and unique identifiers in database systems. Accurate geographic referencing is essential for ensuring the quality and integrity of any geospatial analysis or project.
Q 28. Describe your experience with using public transportation to navigate a city.
My experience with public transportation is extensive. I regularly use buses, subways, and trains to navigate various cities. This practical experience provides valuable insight into the challenges and efficiencies of different systems.
This hands-on experience allows me to understand the limitations and strengths of transit systems: the frequency of services, accessibility to certain areas, and the overall user experience. This knowledge directly informs my work in route optimization and travel time estimations. For example, while working on a project that involved modeling public transportation routes, my own experiences provided valuable insights into the factors like transfer times and potential delays due to overcrowding.
This isn’t just about using public transit myself; it is a deep understanding of how public transport networks operate, and how that information can be integrated with other datasets to form more comprehensive spatial understanding.
Key Topics to Learn for Local Geography and Street Knowledge Interview
- Understanding Local Boundaries: Mastering the geographical limits of your target area, including neighboring regions and significant landmarks.
- Major Transportation Networks: Thorough knowledge of public transport routes (buses, trains, subways), major roads, highways, and their interconnectivity.
- Points of Interest (POIs): Familiarity with key locations such as hospitals, schools, parks, commercial centers, and government buildings; being able to quickly identify their relative locations.
- Navigational Skills: Demonstrate your ability to effectively use maps (physical and digital) and provide clear directions, accounting for potential traffic or road closures.
- Local Demographics and Trends: Understanding the population distribution, key demographics, and prevalent trends within the region – this showcases broader awareness.
- Problem-Solving in Spatial Contexts: Practice mentally mapping routes, estimating travel times, and identifying optimal paths based on given scenarios.
- Impact of Geography on Local Services: Analyze how geographical factors influence the accessibility and distribution of essential services within the community.
- Data Interpretation and Analysis (if applicable): If the role involves data, practice interpreting maps, charts, and other spatial data to draw meaningful conclusions.
Next Steps
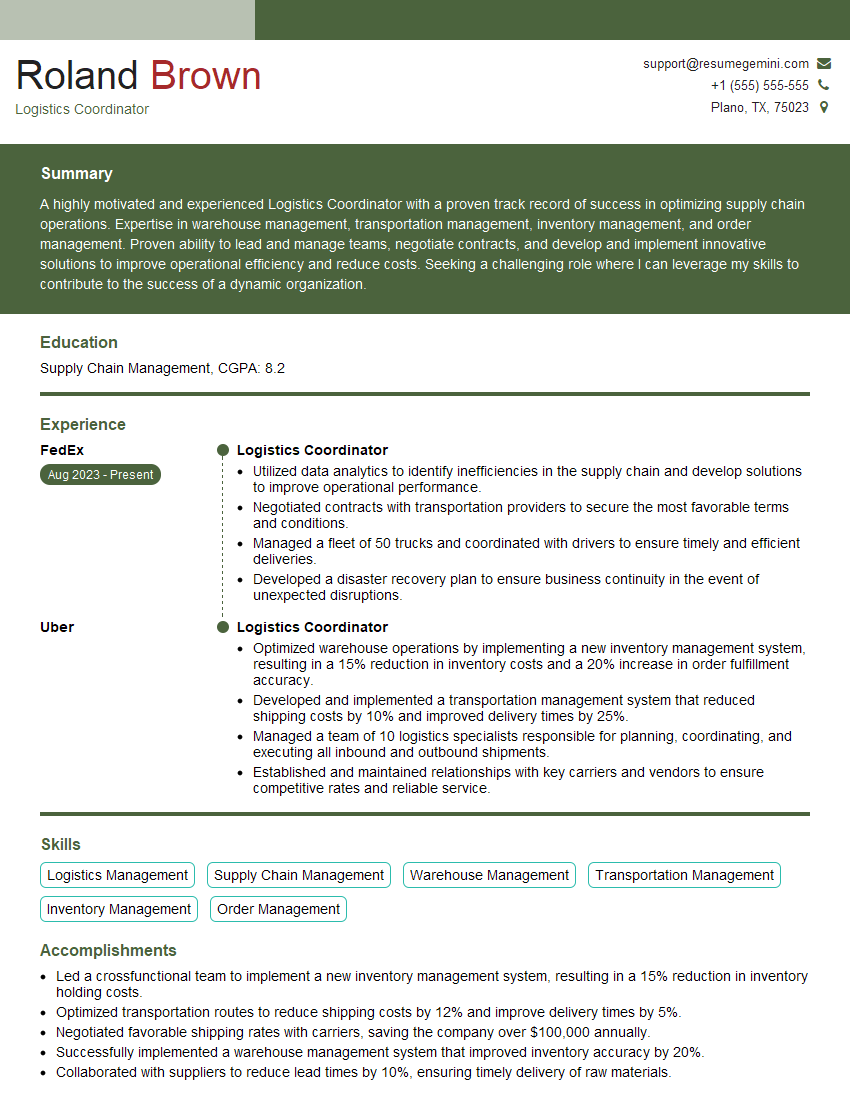
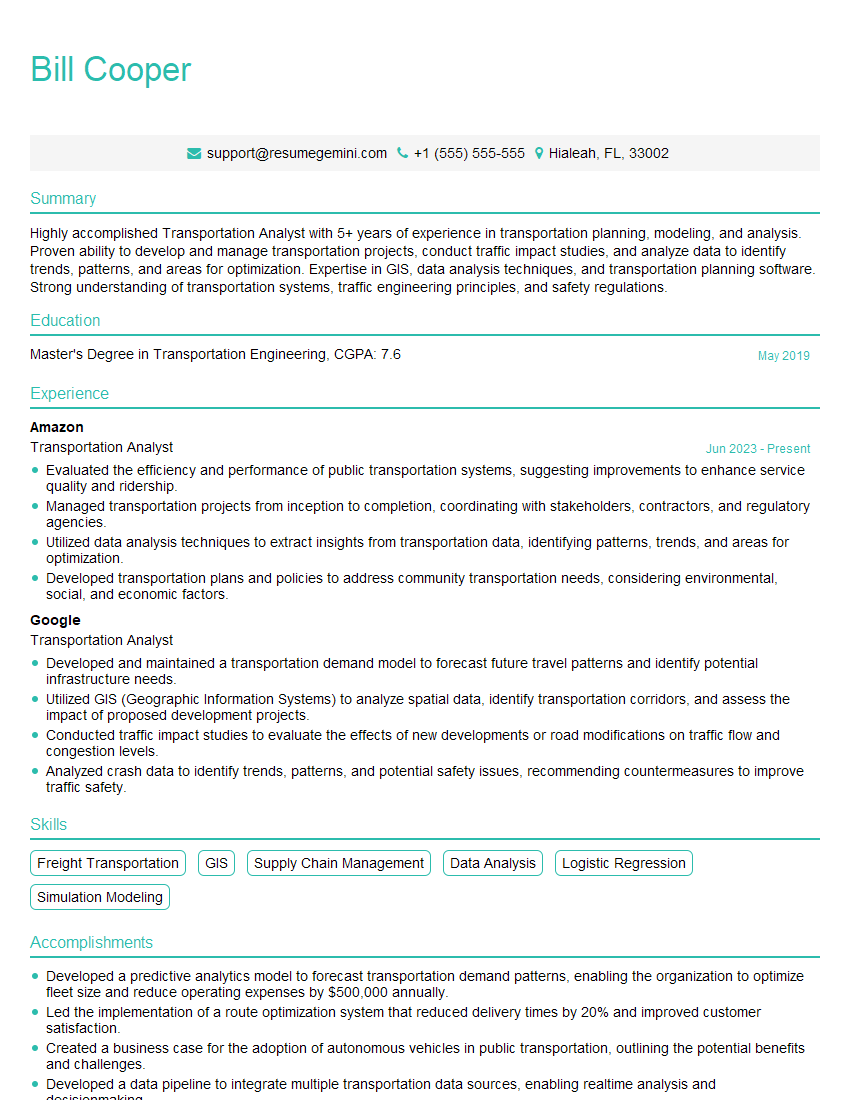
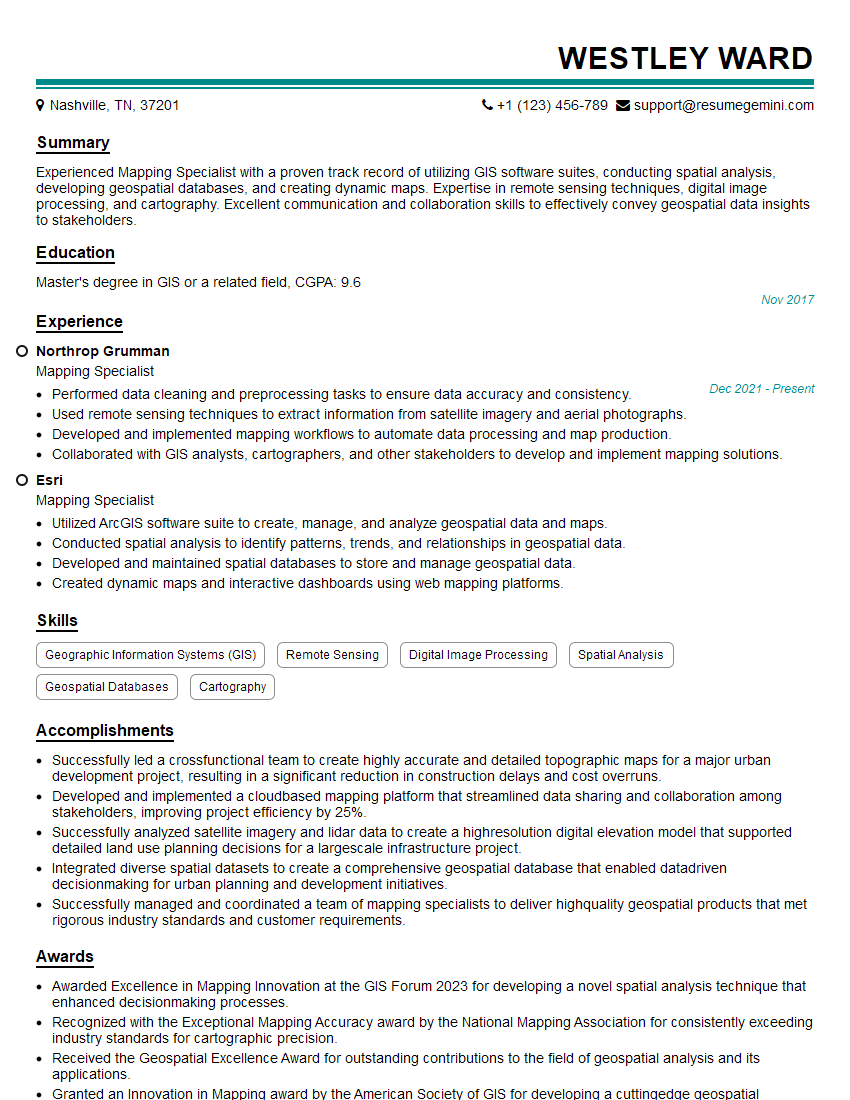
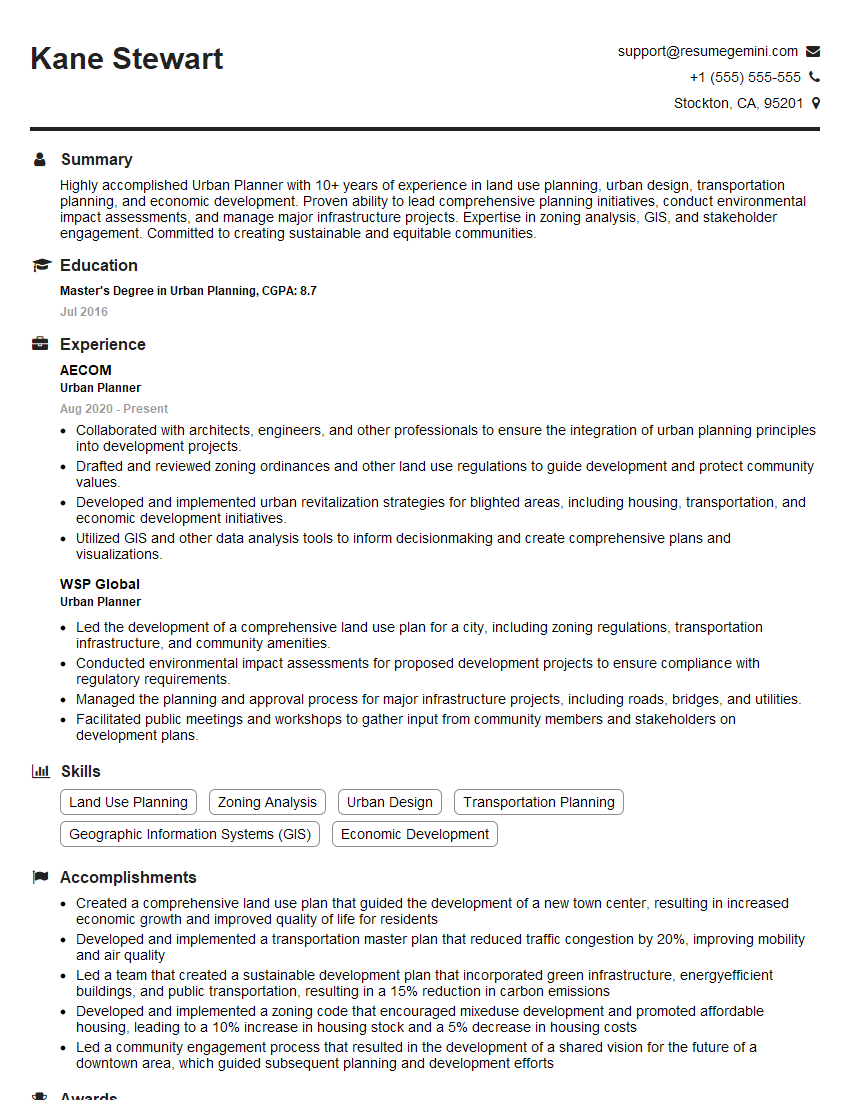
Mastering Local Geography and Street Knowledge is crucial for many roles, showcasing your practical understanding of the area and your ability to navigate its complexities. This skill directly impacts efficiency and client service, making you a valuable asset to any team. To significantly boost your job prospects, create an ATS-friendly resume that highlights your relevant skills and experience effectively. ResumeGemini is a trusted resource that can help you build a professional resume tailored to your specific needs. Examples of resumes tailored to Local Geography and Street Knowledge are available on ResumeGemini to guide you in showcasing your unique skills and experience. Invest in a strong resume – it’s your first impression with potential employers.
Explore more articles
Users Rating of Our Blogs
Share Your Experience
We value your feedback! Please rate our content and share your thoughts (optional).
What Readers Say About Our Blog
Hello,
We found issues with your domain’s email setup that may be sending your messages to spam or blocking them completely. InboxShield Mini shows you how to fix it in minutes — no tech skills required.
Scan your domain now for details: https://inboxshield-mini.com/
— Adam @ InboxShield Mini
Reply STOP to unsubscribe
Hi, are you owner of interviewgemini.com? What if I told you I could help you find extra time in your schedule, reconnect with leads you didn’t even realize you missed, and bring in more “I want to work with you” conversations, without increasing your ad spend or hiring a full-time employee?
All with a flexible, budget-friendly service that could easily pay for itself. Sounds good?
Would it be nice to jump on a quick 10-minute call so I can show you exactly how we make this work?
Best,
Hapei
Marketing Director
Hey, I know you’re the owner of interviewgemini.com. I’ll be quick.
Fundraising for your business is tough and time-consuming. We make it easier by guaranteeing two private investor meetings each month, for six months. No demos, no pitch events – just direct introductions to active investors matched to your startup.
If youR17;re raising, this could help you build real momentum. Want me to send more info?
Hi, I represent an SEO company that specialises in getting you AI citations and higher rankings on Google. I’d like to offer you a 100% free SEO audit for your website. Would you be interested?
Hi, I represent an SEO company that specialises in getting you AI citations and higher rankings on Google. I’d like to offer you a 100% free SEO audit for your website. Would you be interested?
good
