Feeling uncertain about what to expect in your upcoming interview? We’ve got you covered! This blog highlights the most important Monitoring and Diagnostics interview questions and provides actionable advice to help you stand out as the ideal candidate. Let’s pave the way for your success.
Questions Asked in Monitoring and Diagnostics Interview
Q 1. Explain the difference between monitoring and diagnostics.
Monitoring and diagnostics are closely related but distinct processes in system management. Think of it like this: monitoring is like regularly checking your car’s dashboard – you’re observing various metrics like speed, fuel level, and engine temperature to ensure everything is running smoothly. Diagnostics, on the other hand, kicks in when something goes wrong. It’s like taking your car to a mechanic after noticing a strange noise; you’re investigating the root cause of the problem to fix it.
More formally, monitoring involves the continuous observation of system performance and resource utilization through various metrics. This provides a proactive overview of system health. Diagnostics, conversely, focuses on identifying the root cause of issues detected during monitoring. It involves in-depth analysis of logs, traces, and other system data to pinpoint the source of failures and performance bottlenecks.
In short, monitoring helps you prevent issues, while diagnostics helps you resolve them.
Q 2. Describe your experience with various monitoring tools (e.g., Prometheus, Grafana, Datadog, Nagios).
I have extensive experience with a variety of monitoring tools, each with its own strengths.
- Prometheus: I’ve used Prometheus extensively for its powerful time-series database and flexible query language (PromQL). Its pull-based architecture allows for efficient scaling and robust data collection. For instance, I used Prometheus to monitor the performance of a microservices architecture, tracking metrics like request latency and error rates for each service. This allowed for quick identification of bottlenecks and improved our ability to scale individual services based on actual usage.
- Grafana: I utilize Grafana for visualizing data collected by various sources, including Prometheus. Its interactive dashboards and customizable visualizations make it an invaluable tool for monitoring and alerting. I’ve successfully implemented dashboards visualizing complex metrics across multiple systems, allowing for a holistic view of our infrastructure’s performance.
- Datadog: Datadog is a powerful all-in-one monitoring platform that provides monitoring, tracing, and logging capabilities in a single solution. I’ve used it in projects requiring a unified platform with seamless integration between monitoring components and easier configuration management.
- Nagios: I have experience with Nagios, particularly in situations requiring more traditional system monitoring approaches. Its strength lies in its agent-based architecture and ease of setup for basic server monitoring in less complex environments. I’ve used it for basic network device and server health checks.
My choice of tool depends heavily on the specific needs of the project, considering factors like scale, complexity, and budget. For large-scale, complex systems, Datadog or a combination of Prometheus and Grafana often provides the best solution. For smaller, simpler deployments, Nagios may suffice.
Q 3. How do you define and measure key performance indicators (KPIs) for system health?
Defining and measuring KPIs for system health depends on the specific system and its critical functions. However, some common KPIs include:
- Uptime/Availability: Percentage of time the system is operational and available to users. Calculated by subtracting downtime from total time and dividing by total time.
- Latency: Time taken for a request to be processed and a response to be returned. This can be measured for various operations, like API calls or database queries.
- Error Rate: Percentage of requests that result in errors. High error rates indicate problems requiring immediate attention.
- Throughput: Number of requests or operations processed per unit of time. Indicates the system’s capacity to handle load.
- Resource Utilization (CPU, Memory, Disk I/O): Percentage of resources being used by the system. High utilization might point to resource constraints or inefficient code.
- Database Performance (Query Times, Connections): Measures database efficiency in handling requests.
The chosen metrics should be relevant to the system’s critical business functions and should allow for a quick assessment of its health. For example, an e-commerce website might prioritize KPIs related to transaction completion time and error rate, while a social media platform might focus on response time and user concurrency.
Q 4. Explain your approach to designing a monitoring system for a new application.
Designing a monitoring system for a new application involves a structured approach:
- Identify Critical Components: Define the key parts of the application and their dependencies (databases, message queues, external APIs, etc.).
- Define Key Metrics: Based on the critical components, determine the relevant KPIs (e.g., request latency, error rate, CPU usage, memory usage). The metrics chosen should align with the application’s business objectives.
- Choose Monitoring Tools: Select appropriate tools based on scalability requirements, budget, and existing infrastructure. This might involve a combination of tools as discussed earlier.
- Implement Monitoring Agents: Deploy agents on servers and containers to collect the defined metrics. The chosen agent type should match the system where the application will run.
- Create Dashboards: Develop dashboards in Grafana or a similar tool to visualize the collected metrics. This is a crucial step for easily observing application health.
- Configure Alerting: Set up alerts based on predefined thresholds. Thresholds should be chosen carefully to avoid alert fatigue and ensure that alerts trigger only for significant issues.
- Testing & Refinement: Thoroughly test the monitoring system and refine the metrics and alerts as needed. This process is iterative; the right metrics are often discovered through analysis and refinement over time.
For example, when monitoring a new e-commerce application, I would focus on transaction processing time, order completion rate, inventory levels, and the health of the payment gateway. Proper monitoring ensures a quick response to issues and prevents business disruption.
Q 5. Describe your experience with setting up alerts and thresholds for different system metrics.
Setting up alerts and thresholds requires careful consideration. My approach involves:
- Understanding Metric Behavior: I thoroughly analyze the historical data of the metrics to understand their typical ranges and fluctuations. This prevents setting thresholds that trigger false alarms.
- Establishing Baselines: I establish baselines for each metric to provide a reference point for deviations.
- Defining Thresholds: I define thresholds that are based on statistical analysis (e.g., using standard deviations) and business requirements. The goal is to alert on significant deviations rather than minor fluctuations.
- Prioritization: I prioritize alerts based on severity and impact. Critical errors receive immediate attention, whereas less critical events might be bundled for later review.
- Testing Alerts: I rigorously test all alerts to ensure that they trigger appropriately.
Example: For an API endpoint, I might set an alert if the average response time exceeds 500ms for more than 5 minutes. I also configure an alert for error rates exceeding 2% for a 10-minute period. These thresholds balance sensitivity with a practical alert frequency that wouldn’t lead to unnecessary interruptions.
Q 6. How do you handle alert fatigue?
Alert fatigue, the overwhelming number of alerts leading to inaction, is a serious problem. I employ several strategies to mitigate it:
- Intelligent Alerting: Using sophisticated alerting tools that aggregate similar alerts and filter out noise reduces the sheer number of alerts received.
- Threshold Refinement: I continually review and adjust alert thresholds, focusing on alerting on genuine incidents, rather than minor fluctuations. Statistical analysis and machine learning can help identify these fluctuations.
- Alert Grouping: Grouping similar alerts together into more concise summaries simplifies the overview.
- On-call Rotation and Escalation: Implement a well-defined on-call rotation and escalation procedure to ensure that alerts are addressed promptly and efficiently.
- Automated Remediation: Where possible, automate the resolution of certain types of alerts. This reduces the number of alerts requiring manual intervention.
- Feedback Loop: Regularly review alerts to identify false positives or areas for improvement in the monitoring system. This feedback loop continually enhances the process and reduces the noise.
The key is to focus on actionable alerts that truly signal an issue requiring immediate attention.
Q 7. Explain your experience with log management and analysis tools.
My experience with log management and analysis tools is extensive. I’ve worked with tools like:
- Elasticsearch, Logstash, and Kibana (ELK Stack): The ELK stack is powerful for centralizing, processing, and analyzing logs from various sources. I’ve used it extensively for analyzing application logs, system logs, and security logs to detect anomalies, debug issues, and track down security incidents. I have experience configuring pipelines to parse different log formats and optimize query performance.
- Splunk: Splunk is another powerful log management solution offering features such as real-time search, indexing, and visualization of log data. I’ve used it in environments requiring advanced search capabilities and sophisticated dashboards for analyzing large volumes of log data.
- Graylog: Graylog is an open-source log management platform that I’ve used for smaller-scale deployments where cost-effectiveness and flexibility are critical.
Beyond the tools themselves, my approach to log management involves proper log rotation and storage policies, enabling efficient searching and analysis while optimizing disk space usage. I also utilize advanced search techniques and regular expression matching to find specific events within logs. For instance, during a recent security incident, using regular expressions on application logs allowed for rapid identification of unauthorized access attempts.
Q 8. How do you troubleshoot performance bottlenecks in a distributed system?
Troubleshooting performance bottlenecks in a distributed system requires a systematic approach. Think of it like detective work – you need to gather clues, analyze them, and deduce the culprit. It’s rarely a single point of failure; it’s usually a combination of factors.
My approach involves these steps:
- Identify the bottleneck: Use monitoring tools to pinpoint slow areas. This might involve looking at metrics like CPU utilization, memory usage, I/O latency, network bandwidth, and database query times. Tools like Prometheus, Grafana, and Datadog are invaluable here. For example, if I see consistently high CPU utilization on a specific microservice, that’s a prime suspect.
- Isolate the affected components: Once you’ve identified a slow area, you need to determine which specific components are involved. Distributed tracing tools like Jaeger or Zipkin are crucial for following requests across multiple services and identifying the exact point of failure.
- Analyze logs and metrics: Thoroughly examine application logs, system logs, and monitoring metrics to identify error messages, unusual patterns, or resource exhaustion. This provides clues about the root cause. For instance, consistently high error rates in a particular log file might indicate a bug in a specific function.
- Reproduce the issue (if possible): Sometimes, reproducing the problem in a controlled environment (like a staging environment) simplifies debugging. This allows for targeted testing and experimentation to isolate the cause.
- Implement and test fixes: Once the root cause is identified, implement solutions. This might involve code changes, database optimizations, infrastructure upgrades, or scaling up resources. Always test your fixes thoroughly in a non-production environment before deploying to production.
- Monitor for improvement: After implementing a fix, closely monitor the system to ensure that the performance bottleneck is resolved and that the fix doesn’t introduce new problems.
For example, I once worked on a system where a specific database query was causing significant performance issues. By analyzing slow query logs and optimizing the query, we improved response times dramatically.
Q 9. Describe your experience with capacity planning and forecasting.
Capacity planning and forecasting is all about predicting future resource needs and ensuring the system can handle the expected load. It’s like planning a party – you need to estimate how many guests will show up and ensure you have enough food, drinks, and space.
My experience involves using various techniques, including:
- Historical data analysis: Examining past trends in resource usage (CPU, memory, network traffic, database size, etc.) to project future needs. This is the foundation of any effective forecast.
- Load testing: Simulating real-world usage patterns to determine the system’s performance under stress. Tools like JMeter and k6 allow you to simulate hundreds or thousands of concurrent users, revealing breaking points.
- Forecasting models: Employing statistical models (e.g., linear regression, exponential smoothing) to predict future resource requirements based on historical data and anticipated growth. This enables proactive scaling rather than reactive firefighting.
- Scenario planning: Considering various future scenarios (e.g., sudden traffic spikes, new feature launches) and planning for worst-case scenarios to ensure system resilience.
In a previous role, I used historical data and load testing to project the database size needed for the next 12 months. This allowed us to proactively upgrade the database hardware, preventing performance degradation due to storage limitations.
Q 10. What are some common causes of application performance degradation?
Application performance degradation can stem from numerous sources. Think of it as a car – many parts must function correctly for optimal performance. If one part fails, the entire system suffers.
Common causes include:
- Code inefficiencies: Poorly written code, memory leaks, inefficient algorithms, or excessive database queries can significantly impact performance.
- Database issues: Slow queries, inadequate indexing, or database lock contention can bottleneck the entire application.
- Network bottlenecks: Limited bandwidth, high latency, or network congestion can hamper communication between different parts of the system.
- Resource exhaustion: Insufficient CPU, memory, or disk space on servers can lead to performance slowdowns or crashes. This is similar to running out of gas in your car.
- Third-party dependencies: Problems with external APIs or services can negatively impact application performance.
- Hardware failures: Failing hardware components (e.g., disks, network cards) can lead to performance degradation or outages.
- Software bugs: Unexpected errors in the application code can cause performance issues or crashes.
For example, a poorly optimized database query taking several seconds to execute can cause significant delays for users, even if the rest of the system is performing well.
Q 11. How do you investigate and resolve system outages?
Investigating and resolving system outages is a critical skill. It’s like a medical emergency – swift and accurate diagnosis is vital. My approach follows a structured process:
- Acknowledge and contain: The first step is to acknowledge the outage and start containing the damage. This might involve switching to a backup system or limiting access to the affected services to prevent further problems.
- Gather information: Collect data from various sources, such as monitoring dashboards, logs, and user reports. This provides crucial clues about the nature and scope of the outage.
- Identify the root cause: Based on the gathered information, pinpoint the root cause. This is often a multi-step process involving checking system logs, network monitoring data, application metrics, and database activity.
- Implement a fix: Once the root cause is identified, implement a fix. This could involve anything from restarting a server to deploying a code patch or restoring from a backup.
- Monitor and verify: After implementing the fix, closely monitor the system to ensure it’s functioning correctly and that the outage isn’t recurring. This involves watching key performance indicators and checking logs for any errors.
- Post-mortem analysis: Following resolution, perform a post-mortem analysis to understand what caused the outage, how it was handled, and what could be improved to prevent future occurrences. This helps build a culture of continuous improvement.
In one instance, a network outage in our data center caused a complete system failure. By working with the network team, we identified the problem quickly, restored network connectivity, and implemented better redundancy in our network infrastructure.
Q 12. What is your experience with root cause analysis (RCA)?
Root cause analysis (RCA) is a systematic process to identify the underlying cause of a problem, not just the symptoms. It’s not enough to treat the fever; you need to find the underlying infection. I’ve extensive experience in conducting RCA using several frameworks, including the 5 Whys and the Fishbone diagram.
The 5 Whys involves repeatedly asking “why” to drill down to the root cause. For example:
- Problem: Website is slow.
- Why? Database is slow.
- Why? Too many unoptimized queries.
- Why? Lack of proper indexing.
- Why? Inadequate database design review process.
The Fishbone diagram (also known as the Ishikawa diagram) helps visualize the potential causes of a problem, categorized by different factors (e.g., people, methods, machines, materials, environment, measurement).
Regardless of the framework used, a successful RCA requires:
- Data gathering: Collect data from various sources, including logs, metrics, and interviews.
- Collaboration: Involve relevant stakeholders to get multiple perspectives.
- Objectivity: Analyze the data objectively, avoiding assumptions or biases.
- Documentation: Document the findings and recommendations to ensure that lessons are learned and acted upon.
RCA isn’t just about fixing the immediate problem; it’s about preventing it from happening again.
Q 13. Explain your approach to incident management.
My approach to incident management follows industry best practices, focusing on speed, efficiency, and collaboration. It’s like a well-orchestrated team responding to a fire – everyone has a role and works together efficiently.
Key elements include:
- Clear communication: Establish a communication plan to keep stakeholders informed. This often involves using incident management tools like PagerDuty or Opsgenie to manage alerts and notifications.
- Rapid response: Assemble a skilled team promptly to address the incident.
- Structured process: Follow a predefined process for incident management, typically involving stages such as detection, diagnosis, response, recovery, and post-mortem.
- Root cause identification: Use techniques such as RCA to identify the underlying cause of the incident.
- Escalation procedures: Establish clear escalation procedures to ensure that senior personnel are involved when necessary.
- Knowledge sharing: Document the incident and its resolution to build a knowledge base and improve future incident response.
For example, I’ve implemented an incident management system using a ticketing system that integrates with our monitoring tools, automatically routing alerts to the appropriate teams based on the nature of the incident. This ensured faster response times and more efficient resolution.
Q 14. Describe your experience with different types of monitoring (e.g., infrastructure, application, network).
My experience encompasses various types of monitoring, each offering a different perspective on the system’s health and performance. Think of it as a medical checkup – you need different tests (blood pressure, heart rate, etc.) to get a complete picture.
I’ve worked with:
- Infrastructure monitoring: This involves monitoring the underlying hardware and infrastructure (servers, networks, storage) to ensure it’s functioning correctly. Metrics include CPU usage, memory usage, disk I/O, network traffic, and server uptime. Tools like Nagios, Zabbix, and Prometheus are commonly used.
- Application monitoring: This focuses on the application itself, tracking metrics such as response times, error rates, transaction throughput, and resource utilization within the application. Tools such as AppDynamics, Dynatrace, and New Relic are popular choices.
- Network monitoring: This involves monitoring network devices and connections to ensure network availability, performance, and security. Metrics include bandwidth usage, latency, packet loss, and network connectivity. Tools like SolarWinds and PRTG are commonly used for this purpose.
- Log monitoring: This involves collecting and analyzing logs from various system components to identify errors, warnings, and other events. Tools like ELK stack (Elasticsearch, Logstash, Kibana) and Splunk are frequently used for log management and analysis.
In a past role, I integrated multiple monitoring tools to create a central dashboard providing a holistic view of the entire system, enabling proactive issue detection and swift incident response.
Q 15. How do you ensure the accuracy and reliability of your monitoring data?
Ensuring the accuracy and reliability of monitoring data is paramount. It’s like having a reliable compass when navigating a complex system. Inaccuracy can lead to flawed decisions and missed critical issues. My approach involves a multi-layered strategy:
- Data Validation: I implement rigorous checks at every stage, from the source (e.g., verifying sensor readings against known good values or secondary sources) to the aggregation and storage. This often includes sanity checks: Are values within expected ranges? Are there unexpected spikes or drops? I utilize tools and techniques like checksums and data consistency checks to catch anomalies early on.
- Redundancy and Failover: I build redundancy into the monitoring infrastructure itself. Multiple sensors, probes, and data collection points minimize the risk of single points of failure. If one sensor fails, others pick up the slack. Implementing failover mechanisms ensures continuous data flow even in the face of unexpected outages.
- Data Source Verification: I meticulously document and test all data sources. I ensure each data point is properly labeled, tagged, and contextualized. This allows for easy tracing and helps prevent misinterpretation. I prioritize using reliable and proven data sources.
- Regular Calibration and Maintenance: Monitoring systems require ongoing calibration and maintenance. Just like a car needs regular tune-ups, our monitoring systems need regular reviews to ensure accuracy. This includes periodic checks on the health of sensors, data pipelines, and databases.
- Alerting Thresholds: Careful selection and testing of alerting thresholds is vital. False positives can desensitize operators, while false negatives can lead to missed critical events. I work closely with stakeholders to establish appropriate threshold values, always striving for a balance between sensitivity and minimizing alert fatigue.
For example, in a recent project monitoring a large e-commerce platform, we implemented a multi-layered approach involving redundant web servers, database replication, and multiple monitoring agents. This ensured that even with server failures, we had reliable data and minimal service disruption.
Career Expert Tips:
- Ace those interviews! Prepare effectively by reviewing the Top 50 Most Common Interview Questions on ResumeGemini.
- Navigate your job search with confidence! Explore a wide range of Career Tips on ResumeGemini. Learn about common challenges and recommendations to overcome them.
- Craft the perfect resume! Master the Art of Resume Writing with ResumeGemini’s guide. Showcase your unique qualifications and achievements effectively.
- Don’t miss out on holiday savings! Build your dream resume with ResumeGemini’s ATS optimized templates.
Q 16. Explain your experience with creating and maintaining dashboards.
Dashboards are the cockpit of a monitoring system, providing a clear and concise view of system health. My experience encompasses the entire lifecycle, from design and development to ongoing maintenance and optimization.
- Design Principles: I design dashboards with the end-user in mind, focusing on clear visualization, intuitive navigation, and relevant information density. I avoid clutter and prioritize the most critical metrics. Consideration is given to different user roles and their specific needs. I often use wireframing and prototyping tools to iterate on the design before implementation.
- Data Aggregation and Transformation: I leverage tools and techniques to aggregate and transform raw monitoring data into meaningful insights. This may involve calculations, filtering, and normalization to present data in a digestible format. For example, I might aggregate individual server CPU utilizations to show overall cluster utilization.
- Technology Selection: I have experience with a variety of dashboarding tools such as Grafana, Kibana, and custom solutions built using frameworks like React or Angular. The choice of technology depends on the specific needs of the project, considering factors such as scalability, integration with existing systems, and cost.
- Maintenance and Optimization: Dashboards are not static; they require ongoing maintenance. This includes updating data sources, refining visualizations, addressing any performance bottlenecks, and adapting to evolving business needs. Regular review and feedback from users are incorporated to ensure its effectiveness.
For instance, I recently built a Grafana dashboard for a large-scale application monitoring network traffic, CPU utilization, and disk space across multiple servers. The dashboard provided real-time insights, helped identify performance bottlenecks, and significantly reduced the time to resolution for incidents.
Q 17. What are your preferred methods for visualizing monitoring data?
Visualizing monitoring data effectively is crucial for quick identification of trends, anomalies, and critical events. My preferred methods depend on the type of data and the intended audience, but some commonly used methods are:
- Line Charts: Ideal for showing trends over time, such as CPU utilization, network traffic, or application response times.
- Bar Charts and Histograms: Effective for comparing values across different categories or showing the distribution of data. For example, comparing server response times across different regions.
- Heatmaps: Useful for visualizing large datasets by color-coding values, such as showing network latency across various locations.
- Scatter Plots: Excellent for identifying correlations between two variables. For example, identifying a relationship between memory usage and application performance.
- Gauges and Meters: Great for displaying key performance indicators (KPIs) at a glance, such as CPU usage or disk space availability. They provide a quick visual indication of system health.
- Geographic Maps: When dealing with geographically distributed systems, maps are crucial for visualizing data location and performance across different regions.
I avoid overly complex visualizations that could obscure the data. Simplicity and clarity are key to ensuring that the dashboards are readily understood by all users. Color palettes are carefully chosen for accessibility and to minimize cognitive overload.
Q 18. How do you ensure the scalability of your monitoring system?
Scalability is essential for any monitoring system. As the monitored environment grows, the monitoring system must adapt gracefully, handling increasing data volume and complexity without compromising performance. My strategies for ensuring scalability include:
- Horizontal Scaling: Employing a distributed architecture where multiple monitoring agents collect data and forward it to a central aggregation point. This allows for easy addition of more agents as the monitored environment expands.
- Data Aggregation and Sampling: Aggregating data at different levels helps to reduce the volume of data that needs to be processed and stored. Sampling techniques can be used to reduce the frequency of data collection for less critical metrics.
- Efficient Data Storage: Utilizing scalable databases such as time-series databases (like InfluxDB or Prometheus) designed to handle large volumes of time-stamped data. These databases are optimized for querying and retrieval of time-series data.
- Asynchronous Processing: Using asynchronous processing frameworks to ensure that data ingestion and processing are not bottlenecked by slow-performing tasks. This allows for efficient handling of large volumes of data.
- Load Balancing: Distributing the load across multiple servers using load balancing techniques. This helps to prevent overload on any single server, ensuring high availability and performance.
For example, in a previous project, we used a horizontally scalable architecture with multiple Prometheus agents collecting metrics from hundreds of microservices, forwarding the data to a central Prometheus server. This setup could handle the increasing volume of metrics as the number of microservices grew.
Q 19. What is your experience with automating monitoring tasks?
Automating monitoring tasks is crucial for improving efficiency and reducing manual effort. I have extensive experience in automating various aspects of monitoring, using tools like Ansible, Terraform, and scripting languages like Python and Bash.
- Automated Provisioning: Using infrastructure-as-code tools (like Terraform) to automate the deployment and configuration of monitoring agents and infrastructure.
- Automated Alerting: Configuring alerts based on predefined thresholds and conditions, delivering notifications via various channels like email, SMS, or collaboration tools like Slack.
- Automated Incident Response: Implementing automated actions to mitigate incidents, such as automatically scaling up resources or restarting failing services based on predefined rules.
- Automated Reporting: Generating regular reports on system performance and health, identifying trends and anomalies.
- Automated Testing: Creating automated tests to verify the health and accuracy of the monitoring system itself.
For instance, I automated the deployment of our monitoring agents using Ansible playbooks, which simplified the process and reduced the risk of human error. We also automated the generation of daily performance reports, saving significant time and resources.
Q 20. How do you handle conflicting alerts?
Conflicting alerts can be a major problem, leading to alert fatigue and delayed responses to critical issues. My approach to handling conflicting alerts involves:
- Alert Correlation: Implementing alert correlation mechanisms to group related alerts together. This helps to reduce the number of alerts and provide a more comprehensive view of the problem.
- Alert Deduplication: Using techniques to identify and suppress duplicate alerts, improving the signal-to-noise ratio.
- Contextual Information: Enriching alerts with contextual information, such as the affected components, potential root causes, and relevant logs. This helps to prioritize and resolve alerts more efficiently.
- Alert Prioritization: Using a scoring system or other prioritization rules to identify the most critical alerts first. This ensures that the most pressing issues are addressed promptly.
- Alert Suppression: Implementing temporary alert suppression when dealing with known issues or planned maintenance activities. This reduces the number of unnecessary alerts.
For example, if multiple alerts indicate issues with a particular microservice, an alert correlation system would group these alerts together, providing a consolidated view of the problem. This allows engineers to focus on addressing the root cause instead of reacting to multiple individual alerts.
Q 21. Explain your experience with integrating monitoring tools with other systems.
Integrating monitoring tools with other systems is critical for providing a holistic view of the system and automating workflows. My experience encompasses a wide range of integration techniques:
- APIs: Using APIs (Application Programming Interfaces) to exchange data between monitoring tools and other systems, such as ticketing systems, incident management tools, and configuration management databases. This enables automated workflows and provides a centralized view of incidents.
- Message Queues: Using message queues (such as RabbitMQ or Kafka) to asynchronously exchange data, enabling decoupling and improving scalability. This is especially useful for high-volume data streams.
- Database Integration: Integrating monitoring data with existing databases to provide historical context and facilitate advanced analytics. This enables trend analysis and predictive modelling.
- Log Management Systems: Integrating monitoring tools with log management systems (like ELK stack or Splunk) to correlate monitoring data with log entries, providing more comprehensive insights into system behavior.
- Custom Integrations: Developing custom integrations when necessary to connect with systems that lack readily available APIs.
For example, I integrated our monitoring system with a ticketing system, enabling automatic creation of tickets when critical alerts were triggered. This streamlined incident management and improved response times. Another example involved integrating our monitoring data with a machine learning platform to build predictive models for infrastructure capacity planning.
Q 22. Describe your experience with different monitoring architectures (e.g., centralized, distributed).
Monitoring architectures can be broadly categorized into centralized and distributed systems. A centralized architecture collects all monitoring data into a single point, often a server or a cluster of servers. This simplifies management and provides a single pane of glass for viewing system health. However, it can become a single point of failure and struggle with scalability as the volume of data increases. Think of it like having one central control room for a large building – everything reports there, but if that room fails, you lose everything.
A distributed architecture, on the other hand, distributes the monitoring workload across multiple nodes. This improves scalability, resilience, and performance. Each node might monitor a specific segment of the infrastructure, aggregating data at a higher level. Imagine instead having multiple smaller control rooms spread across the building, each monitoring a specific wing. A failure in one area doesn’t bring the whole system down.
In my experience, I’ve worked with both. In one role, we used a centralized architecture based on a commercial monitoring platform (e.g., Datadog, Prometheus). This was suitable for a smaller application stack. Later, in a large cloud-native environment, we leveraged a distributed architecture based on Prometheus and Grafana, allowing us to scale horizontally and handle the vast amount of data generated by numerous microservices.
Q 23. How do you prioritize monitoring tasks?
Prioritizing monitoring tasks is crucial for efficiency and effectiveness. I typically use a risk-based approach, considering the impact and likelihood of failure. I consider several factors:
- Criticality of the system: Applications directly impacting revenue or customer experience are given higher priority.
- Frequency of failure: Systems with a history of frequent failures are prioritized for more frequent and thorough monitoring.
- Potential impact of failure: The severity of the potential impact, including financial loss, reputational damage, or safety risks, greatly influence priority.
- Business requirements: Service Level Agreements (SLAs) and other business requirements dictate which metrics are most important to track.
I utilize a system for scoring potential issues based on these factors. This score helps determine the level of monitoring, the frequency of alerts, and the escalation processes. For example, a system with high criticality and a high likelihood of failure would get top priority, with real-time monitoring, sophisticated alerting, and immediate escalation protocols in place.
Q 24. What are some common challenges in monitoring and diagnostics?
Monitoring and diagnostics present several common challenges. One key challenge is alert fatigue – an overwhelming number of alerts, many of which are false positives, leading to ignored alerts. This is often due to poorly configured thresholds or a lack of context in the alert messages.
Another significant challenge is data volume and complexity. Modern systems generate a massive amount of data, and effectively analyzing this data to pinpoint the root cause of issues is difficult. Tools that leverage machine learning and advanced analytics are becoming increasingly critical in addressing this.
Finally, keeping up with technological changes within the monitoring landscape is an ongoing effort. The continuous emergence of new technologies requires continuous learning and adaptation to best leverage new tools and approaches.
Q 25. How do you stay current with the latest monitoring technologies?
Staying up-to-date with monitoring technologies is crucial. I use several methods:
- Following industry blogs and publications: Websites and publications like InfoQ, The Register, and dedicated monitoring blogs provide updates on new tools and best practices.
- Attending conferences and webinars: Conferences such as monitoring-focused events offer valuable insights and networking opportunities.
- Participating in online communities: Platforms like Stack Overflow and Reddit communities provide avenues to discuss issues and learn from peers.
- Hands-on experimentation: I regularly experiment with new tools and technologies to understand their capabilities and limitations.
- Formal training courses: Vendor-specific training and certifications help with in-depth understanding of particular technologies.
A key aspect is also focusing on the underlying principles of monitoring and diagnostics rather than just specific tools. This fundamental understanding helps in adapting to emerging technologies.
Q 26. Describe your experience with security considerations related to monitoring.
Security is paramount in monitoring. Sensitive data, such as application logs, configuration files, and metrics, often contain confidential information. Therefore, appropriate security measures must be implemented at every stage:
- Secure data transmission: Use encryption (TLS/SSL) for all communication between monitored systems and the monitoring infrastructure.
- Access control: Restrict access to monitoring data and tools using role-based access control (RBAC).
- Data anonymization and obfuscation: Remove or mask sensitive data from logs and metrics before storing or transmitting them.
- Regular security audits: Perform regular security audits and penetration testing to identify vulnerabilities.
- Secure storage: Store monitoring data in secure storage systems with appropriate access controls.
For example, ensuring that the monitoring agents are properly secured and authenticated to prevent unauthorized access is crucial. Similarly, regularly reviewing and updating security policies for the monitoring system is essential.
Q 27. What is your experience with using synthetic transactions for monitoring?
Synthetic transactions are crucial for proactive monitoring. They simulate real-user interactions with the application to detect performance issues before they impact actual users. I have extensive experience in implementing and managing synthetic transaction monitoring.
For instance, I’ve used synthetic transactions to monitor the availability and response time of critical web services. By simulating login attempts, data retrieval, and other user actions, we can quickly identify issues such as slow database queries, network bottlenecks, or server outages.
The key benefits include early detection of problems, improved mean time to resolution (MTTR), and a better understanding of end-user experience. They are also invaluable in capacity planning, allowing us to anticipate and proactively address potential performance limitations.
Q 28. How would you approach building a monitoring system for a microservices architecture?
Building a monitoring system for a microservices architecture requires a distributed approach that can scale with the number of services. A centralized system would quickly become overwhelmed. My approach would involve:
- Service-level monitoring: Implement monitoring agents within each microservice to collect metrics (CPU, memory, requests per second) and logs.
- Distributed tracing: Utilize tools like Jaeger or Zipkin to trace requests across multiple services, helping pinpoint bottlenecks and failures.
- Metrics aggregation: Aggregate metrics from individual services into a central dashboard for overall system visibility. Prometheus is an excellent choice for this.
- Alerting based on service health: Configure alerts based on key metrics and log patterns specific to each service.
- Automated testing and canary deployments: Integrate monitoring with automated tests to ensure new deployments don’t negatively impact performance.
The key is to ensure that the monitoring system is flexible and scalable enough to handle the dynamic nature of a microservices environment. This involves using technologies that can automatically discover and monitor new services as they are deployed.
Key Topics to Learn for Monitoring and Diagnostics Interview
- System Monitoring Fundamentals: Understanding key performance indicators (KPIs), metrics, and thresholds for various system components (servers, networks, applications).
- Log Analysis and Management: Practical experience with log aggregation tools, log parsing techniques, and identifying patterns indicative of issues or anomalies.
- Alerting and Notification Systems: Designing effective alerting strategies, configuring monitoring tools to trigger alerts based on predefined criteria, and managing alert fatigue.
- Troubleshooting and Root Cause Analysis: Applying systematic problem-solving methodologies to pinpoint the root cause of system failures and performance bottlenecks. This includes utilizing various diagnostic tools and techniques.
- Monitoring Tool Expertise: Familiarity with popular monitoring tools (e.g., Prometheus, Grafana, Nagios, Zabbix) and their capabilities. Be prepared to discuss your experience with specific tools.
- Cloud Monitoring: Understanding cloud-specific monitoring challenges and solutions, including utilizing cloud provider monitoring services (e.g., AWS CloudWatch, Azure Monitor, Google Cloud Monitoring).
- Performance Optimization Techniques: Practical application of performance optimization strategies based on monitoring data, including identifying bottlenecks and implementing solutions to improve system performance.
- Data Visualization and Reporting: Creating clear and concise reports and visualizations from monitoring data to communicate insights to stakeholders.
- Security Monitoring: Understanding security-related monitoring aspects, including intrusion detection and prevention systems, and security information and event management (SIEM).
- Automation and Scripting: Experience with automating monitoring tasks and creating scripts to streamline workflows and improve efficiency.
Next Steps
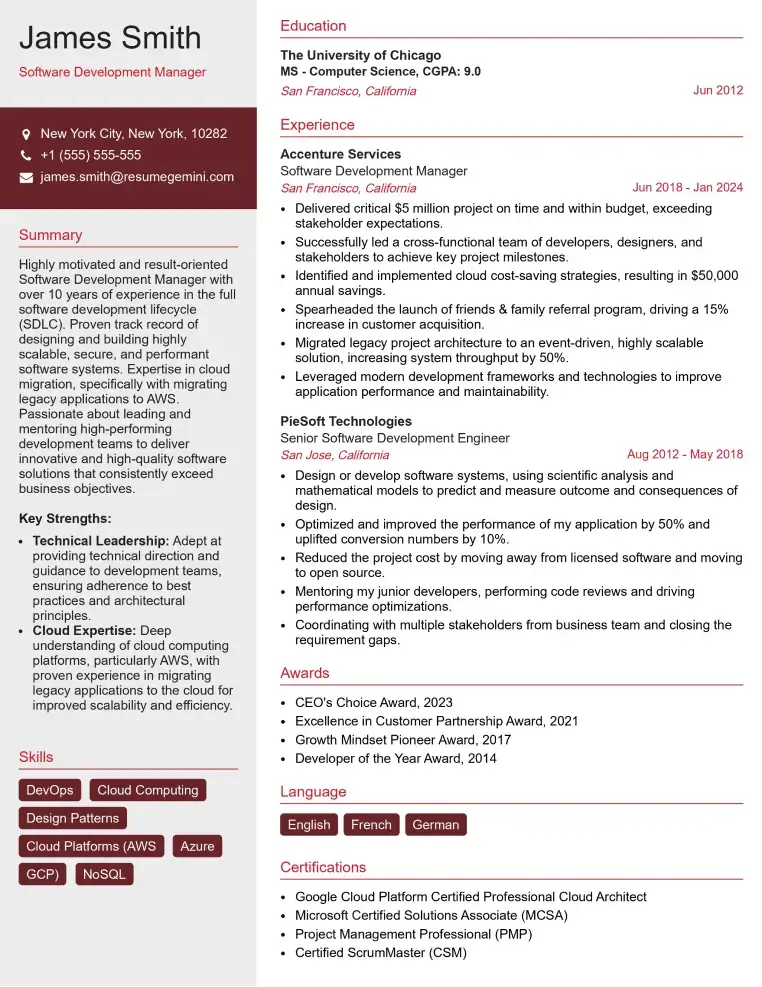
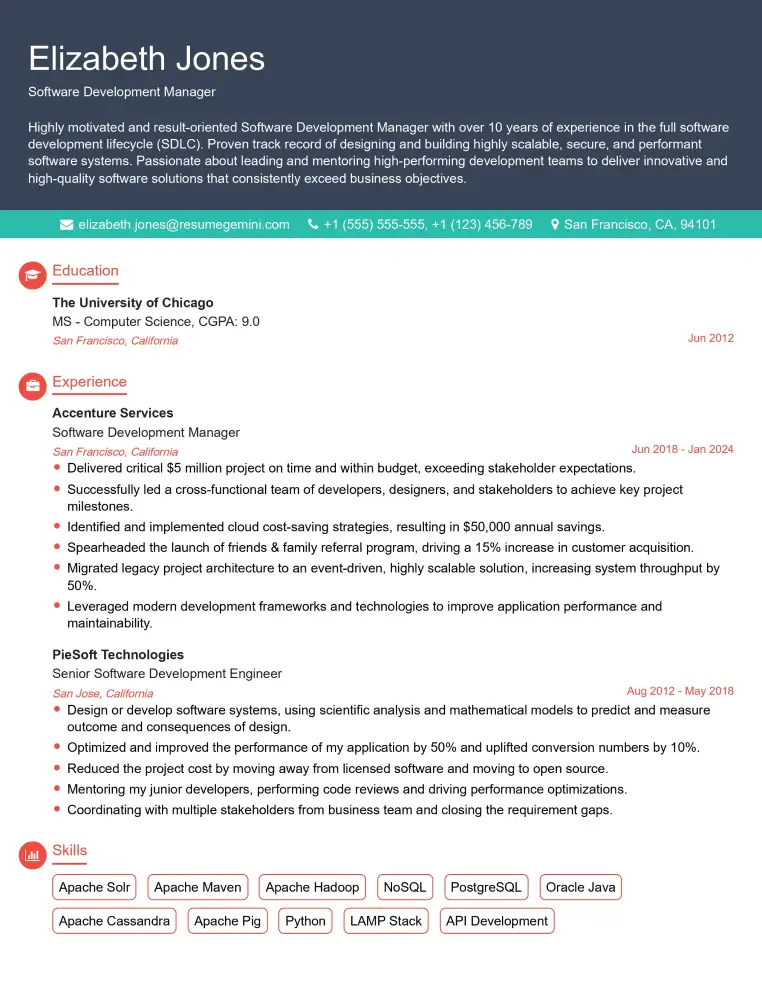
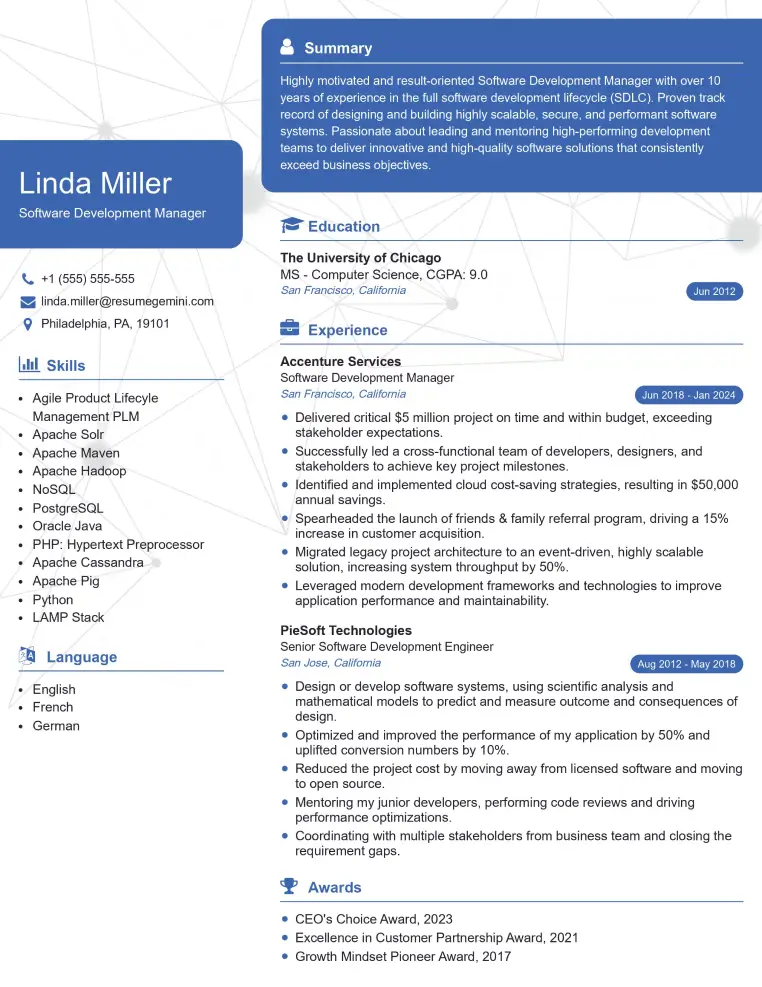
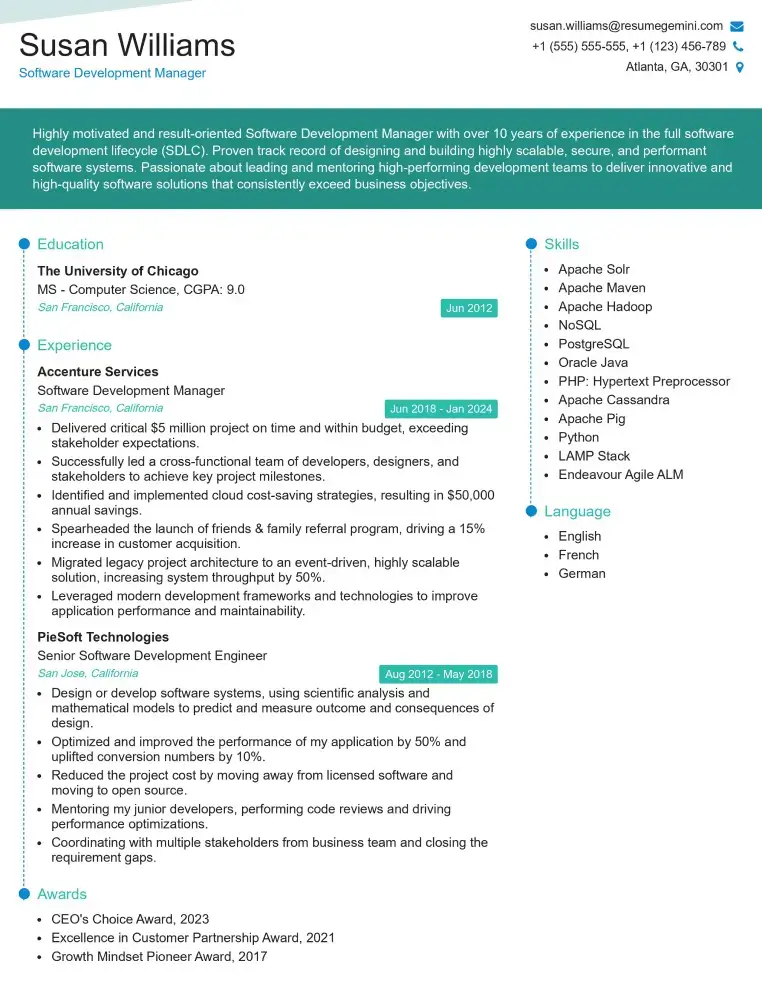
Mastering Monitoring and Diagnostics is crucial for a successful and rewarding career in IT. These skills are highly sought after, opening doors to advanced roles with increased responsibility and compensation. To significantly enhance your job prospects, focus on building a compelling, ATS-friendly resume that highlights your expertise. ResumeGemini can be a trusted partner in this process, offering a streamlined and effective way to craft a professional resume that showcases your unique skills and experience. Examples of resumes tailored specifically to Monitoring and Diagnostics roles are available to help you get started.
Explore more articles
Users Rating of Our Blogs
Share Your Experience
We value your feedback! Please rate our content and share your thoughts (optional).
What Readers Say About Our Blog
Hello,
We found issues with your domain’s email setup that may be sending your messages to spam or blocking them completely. InboxShield Mini shows you how to fix it in minutes — no tech skills required.
Scan your domain now for details: https://inboxshield-mini.com/
— Adam @ InboxShield Mini
Reply STOP to unsubscribe
Hi, are you owner of interviewgemini.com? What if I told you I could help you find extra time in your schedule, reconnect with leads you didn’t even realize you missed, and bring in more “I want to work with you” conversations, without increasing your ad spend or hiring a full-time employee?
All with a flexible, budget-friendly service that could easily pay for itself. Sounds good?
Would it be nice to jump on a quick 10-minute call so I can show you exactly how we make this work?
Best,
Hapei
Marketing Director
Hey, I know you’re the owner of interviewgemini.com. I’ll be quick.
Fundraising for your business is tough and time-consuming. We make it easier by guaranteeing two private investor meetings each month, for six months. No demos, no pitch events – just direct introductions to active investors matched to your startup.
If youR17;re raising, this could help you build real momentum. Want me to send more info?
Hi, I represent an SEO company that specialises in getting you AI citations and higher rankings on Google. I’d like to offer you a 100% free SEO audit for your website. Would you be interested?
Hi, I represent an SEO company that specialises in getting you AI citations and higher rankings on Google. I’d like to offer you a 100% free SEO audit for your website. Would you be interested?
good
