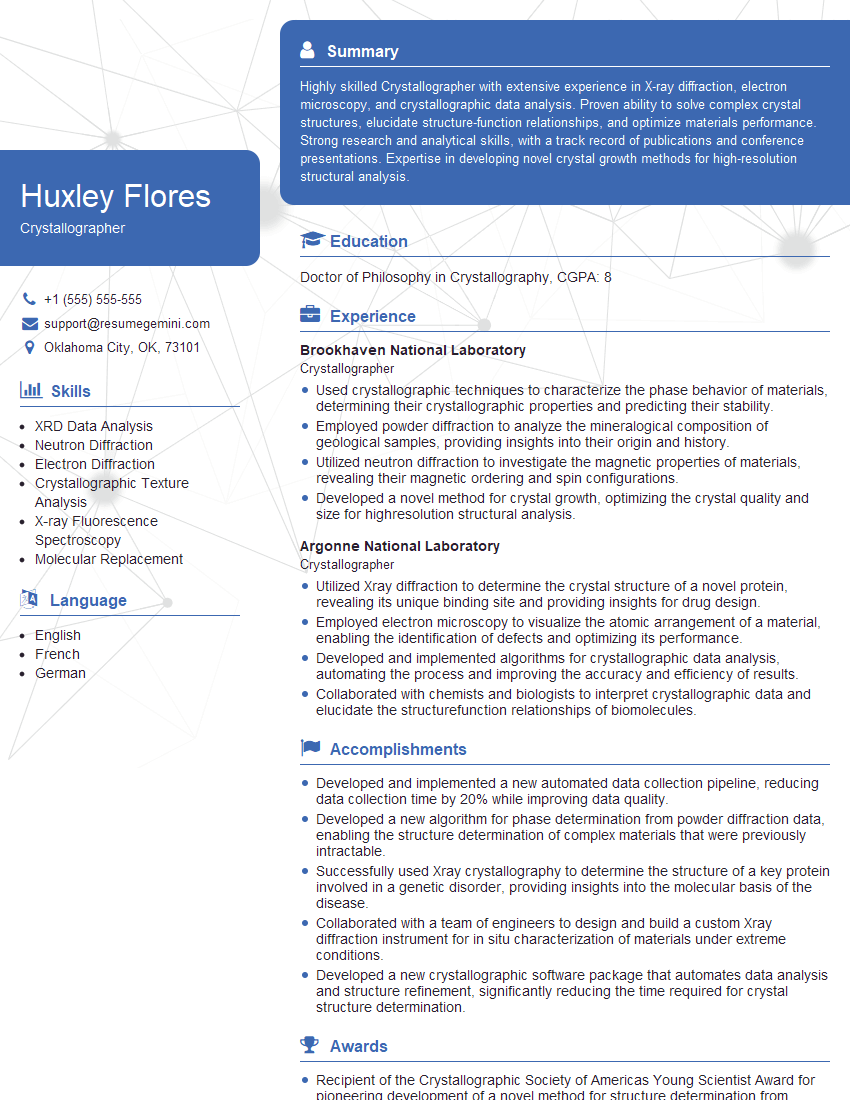
Every successful interview starts with knowing what to expect. In this blog, we’ll take you through the top Physical Property Characterization interview questions, breaking them down with expert tips to help you deliver impactful answers. Step into your next interview fully prepared and ready to succeed.
Questions Asked in Physical Property Characterization Interview
Q 1. Explain the difference between density and specific gravity.
Density and specific gravity both describe how much mass is packed into a given volume, but they differ in their reference points. Density is the mass of a substance per unit volume, typically expressed in grams per cubic centimeter (g/cm³) or kilograms per cubic meter (kg/m³). It’s an absolute measure. For example, the density of water is approximately 1 g/cm³ at 4°C. This means 1 cubic centimeter of water has a mass of 1 gram.
Specific gravity, on the other hand, is the ratio of the density of a substance to the density of a reference substance, usually water at 4°C. It’s a dimensionless quantity. Since it’s a ratio, it’s unaffected by changes in units of measurement. A specific gravity of 2 means the substance is twice as dense as water. This is particularly useful in comparing the relative densities of different materials quickly. For instance, knowing that gold has a specific gravity around 19 tells us it’s significantly denser than water (and most other materials).
Q 2. Describe the principles behind thermal gravimetric analysis (TGA).
Thermal gravimetric analysis (TGA) measures the change in mass of a material as a function of temperature or time under a controlled atmosphere. The principle is straightforward: a sample is heated (or cooled) at a controlled rate, and a sensitive balance continuously monitors its weight. Any weight loss or gain is recorded, providing information about the material’s thermal stability and decomposition behavior.
Imagine baking a cake. TGA would be like precisely weighing the cake batter at the start and then weighing it at various points during baking. Any weight loss might indicate the evaporation of water or other volatile components. TGA can thus identify events like dehydration, oxidation, decomposition, and volatilization. The resulting TGA curve plots weight (%) on the y-axis and temperature (°C or time) on the x-axis. Distinct steps or plateaus in the curve indicate specific thermal events, which can be further analyzed to identify the components and their decomposition temperatures.
For example, a TGA curve showing a gradual weight loss at a certain temperature range could indicate the evaporation of a solvent. A sharp weight loss at a higher temperature might indicate the decomposition of the main material itself. These curves are crucial in determining the purity, thermal stability, and decomposition kinetics of materials, essential in various industries, including pharmaceuticals and polymers.
Q 3. How would you determine the viscosity of a non-Newtonian fluid?
Determining the viscosity of a non-Newtonian fluid requires a different approach than for Newtonian fluids (whose viscosity is constant). Non-Newtonian fluids exhibit viscosity that changes with shear rate or shear stress. This means their flow behavior is dependent on how much force is applied to them. A simple example is ketchup – it’s thick in the bottle (low shear rate) but flows easily when you shake it (high shear rate).
Several techniques can measure non-Newtonian fluid viscosity:
- Rheometers are the gold standard. They apply controlled shear stress or shear rate to the sample and measure the resulting shear rate or shear stress, respectively. This gives a complete rheological profile, showing viscosity changes across a range of shear rates. Different rheometer geometries (e.g., cone-and-plate, parallel plates) are selected based on the fluid’s properties and anticipated behavior.
- Viscometers provide simpler viscosity measurements at specific shear rates. Examples include rotational viscometers (like Brookfield viscometers) which measure the torque required to rotate a spindle in the fluid. The measured torque is related to viscosity.
- Capillary viscometers measure the time it takes for a fluid to flow through a capillary tube. This is suitable for less viscous non-Newtonian fluids.
The choice of technique depends on the fluid’s properties and the level of detail needed. Rheometers are preferred for comprehensive analysis, whereas viscometers offer a quicker, simpler approach for specific shear rates.
Q 4. What are the limitations of using DSC for characterizing materials?
Differential Scanning Calorimetry (DSC) is a powerful technique for analyzing the thermal behavior of materials but has certain limitations:
- Sample Mass and Heat Capacity: DSC sensitivity is influenced by the sample size and its heat capacity. Very small or very large samples can lead to inaccurate results. The sample must have sufficient heat capacity to yield a measurable signal.
- Kinetic Limitations: DSC primarily measures heat flow, not reaction kinetics directly. While it can indicate the onset temperature of a reaction, it doesn’t always provide accurate kinetic parameters (activation energy, reaction order) without additional analysis.
- Heat Transfer Limitations: Efficient heat transfer between the sample and the calorimeter is crucial. Poor thermal contact (e.g., due to sample morphology or high viscosity) can lead to distorted results.
- Baseline Drift and Noise: DSC measurements can suffer from baseline drift (gradual change in the baseline signal) and noise, which can obscure subtle thermal transitions. Careful baseline correction and signal processing techniques are needed.
- Calibration and Instrument Effects: Accurate DSC measurements rely on proper instrument calibration and compensation for instrument-specific effects. These factors can introduce uncertainties in the final results.
- Limited Qualitative Information: Although DSC gives valuable quantitative information about heat flow, it often provides limited qualitative information about the nature of the transitions observed.
Despite these limitations, DSC remains a widely used technique when properly applied and the limitations considered during data interpretation.
Q 5. Explain the principles of X-ray diffraction (XRD) and its applications in materials characterization.
X-ray diffraction (XRD) is based on the constructive interference of X-rays scattered from a crystalline material. When a beam of X-rays interacts with a crystal lattice, the waves are scattered by the atoms in the lattice. If the path difference between the scattered waves is a multiple of the wavelength, constructive interference occurs, leading to a diffracted beam. This interference pattern is unique to the material’s crystal structure and lattice parameters.
Principles: Bragg’s Law (nλ = 2d sinθ) governs the diffraction process, where:
- n is an integer (order of diffraction)
- λ is the wavelength of the X-rays
- d is the interplanar spacing in the crystal lattice
- θ is the angle of incidence (and diffraction)
By measuring the angles (2θ) at which diffraction peaks occur, we can determine the interplanar spacing (d) and, ultimately, the crystal structure.
Applications in Materials Characterization:
- Phase Identification: XRD is used to identify crystalline phases present in a material by comparing the diffraction pattern to known databases.
- Crystal Structure Determination: XRD can determine the crystal structure (unit cell dimensions, space group) of a material.
- Crystallite Size and Strain Analysis: Line broadening in the diffraction peaks can provide information about crystallite size and strain within the material.
- Orientation Analysis: The intensity of the diffraction peaks can be used to determine the preferred orientation of crystallites in a material (texture).
- Quantitative Phase Analysis: The relative intensities of the diffraction peaks can be used to determine the relative amounts of different phases present in a material.
XRD is a versatile non-destructive technique widely used in various fields, including materials science, mineralogy, chemistry, and forensic science. For example, it’s used in the semiconductor industry to analyze thin films and identify any unwanted phases that might affect device performance.
Q 6. How do you interpret a stress-strain curve?
A stress-strain curve depicts the relationship between stress (force per unit area) and strain (deformation per unit length) of a material subjected to tensile or compressive loading. It reveals important information about the material’s mechanical properties.
Interpreting the Curve:
- Elastic Region: The initial linear portion of the curve represents the elastic region. Here, the material deforms elastically, meaning it returns to its original shape after the load is removed. The slope of this region represents Young’s modulus (E), a measure of the material’s stiffness.
- Yield Point: The point where the curve deviates from linearity is the yield point. Beyond this point, plastic deformation begins, meaning the material will not return to its original shape even after the load is removed. The yield strength is the stress at the yield point.
- Plastic Region: This region represents plastic deformation. The material undergoes permanent deformation. It may show work hardening (strain hardening), indicated by an increase in stress required for further deformation.
- Ultimate Tensile Strength: The highest point on the curve represents the ultimate tensile strength, the maximum stress the material can withstand before failure.
- Fracture Point: The point where the curve terminates indicates the fracture point, where the material breaks.
- Ductility: The elongation to fracture reflects the material’s ductility, indicating its ability to deform plastically before fracture. A higher elongation means greater ductility.
- Toughness: The area under the stress-strain curve represents the material’s toughness, its ability to absorb energy before fracture.
By carefully analyzing the stress-strain curve, engineers and material scientists can determine crucial mechanical parameters used in material selection and design for various applications. A brittle material will have a sharp drop after the yield point with little plastic deformation, whereas a ductile material will show substantial plastic deformation before fracture.
Q 7. Describe different techniques for measuring surface area.
Measuring surface area is critical in numerous applications, particularly for materials with high surface-to-volume ratios like catalysts, adsorbents, and powders. Several techniques exist, each with its strengths and weaknesses:
- Gas Adsorption (BET method): The Brunauer-Emmett-Teller (BET) method is the most widely used technique. It involves adsorbing a gas (typically nitrogen) onto the material’s surface at low temperatures. The amount of gas adsorbed is related to the surface area. The BET equation is used to analyze the adsorption isotherm and calculate the surface area.
- Liquid Adsorption: Similar to gas adsorption, but uses a liquid adsorbate. While simpler than gas adsorption, it’s less precise and may be affected by wetting properties.
- Electron Microscopy (Image Analysis): Scanning electron microscopy (SEM) and transmission electron microscopy (TEM) can provide images of the material’s surface. Image analysis software can be used to estimate surface area, but this method is time-consuming and can be subjective depending on image resolution and interpretation.
- Micromeritics (Particle Size Analysis): Techniques like laser diffraction and sieve analysis measure particle size distribution. Assuming a particle shape, one can calculate the surface area from the particle size data, but this approach relies on assumptions about particle shape which might not be accurate.
- Turbidimetric method: This technique measures the scattering of light by particles in suspension which can indirectly be used to estimate the surface area.
The choice of method depends on the nature of the material, desired accuracy, and available resources. For high accuracy and precise surface area determination, the BET method is the preferred choice. Each technique has its limitations and the choice should be dictated by the specific application and material.
Q 8. What is the significance of glass transition temperature (Tg)?
Glass transition temperature (Tg) is the temperature at which an amorphous solid, such as a polymer or glass, transitions from a hard, brittle state to a more rubbery or viscous state. Think of it like this: imagine a perfectly arranged stack of oranges. At low temperatures, they’re firmly packed. As you increase the temperature, the oranges begin to jiggle and move around more, eventually losing their rigid structure. This transition isn’t a sharp melting point like with ice, but rather a gradual change over a temperature range.
The significance of Tg lies in its profound impact on the material’s properties. Below Tg, the material is hard and brittle, while above Tg, it becomes softer, more flexible, and potentially more susceptible to deformation. Knowing the Tg is crucial for numerous applications. For instance, in the plastics industry, Tg dictates the use temperature range of a plastic product. A plastic cup designed for hot beverages must have a Tg significantly higher than the expected temperature to avoid softening and deformation.
In pharmaceuticals, Tg influences the stability and shelf life of drug formulations. Changes in Tg can influence drug dissolution and bioavailability. Similarly, in food science, understanding Tg is vital in maintaining the texture and shelf life of products like confectionery.
Q 9. Explain the concept of crystallinity in polymers.
Crystallinity in polymers refers to the degree of structural order within the polymer chains. Imagine a bowl of perfectly cooked spaghetti (crystalline) versus a bowl of tangled spaghetti (amorphous). In a crystalline polymer, the polymer chains are arranged in a highly ordered, three-dimensional structure, similar to the regular arrangement of atoms in a crystal. This order results in regions with a high degree of packing efficiency.
Conversely, in an amorphous polymer, the chains are randomly arranged, lacking long-range order. The degree of crystallinity significantly influences the material’s properties. Crystalline polymers are generally stronger, stiffer, more opaque, and have higher melting points compared to their amorphous counterparts. The degree of crystallinity can be influenced by factors such as the polymer’s chemical structure, molecular weight, processing conditions (e.g., cooling rate), and additives.
Determining the degree of crystallinity typically involves techniques like X-ray diffraction (XRD), differential scanning calorimetry (DSC), and density measurements. XRD directly measures the ordered crystalline regions, while DSC measures the heat absorbed or released during melting or crystallization. Density measurements leverage the fact that crystalline regions have higher densities than amorphous regions.
Q 10. How would you determine the particle size distribution of a powder?
Determining the particle size distribution of a powder is essential for many applications, as particle size impacts properties like flowability, reactivity, and dissolution rate. Several techniques can be employed, each with its strengths and limitations.
- Sieve Analysis: This is a simple and cost-effective method suitable for relatively large particles (typically >75 µm). It involves passing the powder through a series of sieves with progressively smaller mesh sizes, weighing the retained material on each sieve to obtain the particle size distribution.
- Laser Diffraction: This is a widely used technique for a broad range of particle sizes (0.01 µm to 3 mm). A laser beam is passed through a dispersed powder sample, and the scattered light intensity is measured at various angles. This information is then used to calculate the particle size distribution based on Mie scattering theory.
- Dynamic Light Scattering (DLS): This method is ideal for measuring the size of particles in the nanometer range (1 nm to 1 µm) in liquid suspensions. It measures the fluctuations in light scattering intensity caused by Brownian motion of the particles. This information is then used to determine the particle size and its distribution.
- Image Analysis: This technique involves taking microscopic images of the powder sample and using software to analyze the images and determine the size and shape of individual particles. It is particularly useful for characterizing irregular-shaped particles.
The choice of technique depends on the particle size range, material properties, and the required accuracy.
Q 11. Describe the principles of dynamic mechanical analysis (DMA).
Dynamic Mechanical Analysis (DMA) is a powerful technique used to characterize the viscoelastic properties of materials as a function of temperature, frequency, or time. Viscoelastic materials exhibit both viscous (liquid-like) and elastic (solid-like) behavior. Think of silly putty: it can be stretched like an elastic solid but also flows like a liquid if left undisturbed.
DMA works by applying a sinusoidal oscillatory force (stress) to a sample and measuring the resulting deformation (strain). The relationship between stress and strain reveals the material’s storage modulus (E’), representing the elastic component, and loss modulus (E”), representing the viscous component. The ratio of E” to E’ is known as the tan delta (tan δ), which indicates the damping or energy dissipation capacity of the material.
By varying temperature or frequency, DMA can reveal transitions such as the glass transition temperature (Tg) and melting point (Tm) of a material. It finds widespread applications in polymer science, materials engineering, and food science to determine material stiffness, damping, and other viscoelastic properties that are strongly dependent on the material’s structure and composition.
Q 12. Explain how to interpret a rheological flow curve.
A rheological flow curve, often presented as shear stress versus shear rate, depicts how a material’s viscosity changes with the applied shear force. The shear rate represents how quickly the material is being deformed, and the shear stress is the force required to cause this deformation.
Several flow behaviors are observed:
- Newtonian fluids: These materials show a linear relationship between shear stress and shear rate. The viscosity remains constant regardless of the shear rate. Water is a classic example.
- Shear-thinning fluids (pseudoplastic): The viscosity decreases with increasing shear rate. Many polymer solutions and paints exhibit this behavior. Imagine ketchup; it’s difficult to pour out of the bottle but flows easily once you start shaking it.
- Shear-thickening fluids (dilatant): The viscosity increases with increasing shear rate. Cornstarch and water mixtures demonstrate this behavior, becoming solid-like when stirred vigorously.
- Bingham plastics: These materials show a yield stress, meaning they require a certain amount of force to start flowing. Toothpaste is an example.
Interpreting the flow curve helps determine the material’s rheological properties, crucial for designing processes involving fluid flow, such as pumping, mixing, and coating.
Q 13. What is the difference between tensile strength and yield strength?
Tensile strength and yield strength are both mechanical properties that describe a material’s resistance to deformation under tensile stress. However, they represent different points on the stress-strain curve.
Tensile strength is the maximum stress a material can withstand before it fractures. It represents the ultimate strength of the material. Think of it as the point where the material breaks completely. Imagine a rubber band stretched until it snaps; that breaking point corresponds to the tensile strength.
Yield strength, on the other hand, is the stress at which the material begins to deform plastically, meaning the deformation becomes permanent even after the stress is removed. It is the point where the material starts to yield and deform beyond its elastic limit. Think of bending a paperclip; once you’ve bent it past its yield strength, it won’t return to its original shape.
Therefore, yield strength indicates the onset of permanent deformation, while tensile strength represents the ultimate strength before fracture. The values differ because most materials exhibit elastic deformation before they yield and break.
Q 14. Describe different techniques used for measuring contact angle.
Contact angle measurement quantifies the wettability of a solid surface by a liquid. The contact angle is the angle formed at the three-phase boundary where the liquid, solid, and gas (usually air) meet. A low contact angle (<90°) indicates good wetting (the liquid spreads easily on the surface), while a high contact angle (>90°) indicates poor wetting (the liquid beads up on the surface).
Several techniques are employed for contact angle measurement:
- Sessile Drop Method: A droplet of known volume is placed on the solid surface, and the contact angle is measured directly using a goniometer or image analysis software. This is the most common and versatile technique.
- Wilhelmy Plate Method: A flat plate of the solid material is partially immersed in the liquid, and the force required to pull the plate out of the liquid is measured. This force is then used to calculate the contact angle.
- Capillary Rise Method: This method is suitable for porous materials. The liquid rises spontaneously in the pores of the material, and the height of the liquid column is used to calculate the contact angle.
The choice of technique depends on the nature of the solid surface and the required accuracy. Contact angle measurements are crucial in numerous applications, including surface coating, adhesion science, and material science.
Q 15. How would you characterize the porosity of a material?
Porosity refers to the amount of void space in a material. It’s essentially the percentage of a material’s volume that’s occupied by pores or voids, rather than the solid material itself. We characterize porosity using several methods, depending on the material and the level of detail required.
- Mercury intrusion porosimetry: This technique forces mercury into the pores under pressure. The pressure required to penetrate pores of a given size is related to the pore size distribution. It’s excellent for determining pore size and total porosity in materials with a wide range of pore sizes.
- Gas adsorption: This method measures the amount of gas (like nitrogen) adsorbed onto the surface of the material at various pressures. The amount of adsorption is directly related to the surface area of the pores, providing information on the porosity and specific surface area. This is particularly useful for materials with small pores (microporous materials).
- Image analysis: Microscopic images (SEM, optical microscopy) can be analyzed to directly measure the pore area and volume. This is a relatively straightforward method but can be time-consuming for large samples.
- Archimedes’ principle (for macroscopic porosity): This classic method involves measuring the weight of a dry sample, the weight of a saturated sample, and the weight of the sample submerged in water. The difference in weights allows for calculation of the volume of the pores and thus the porosity.
For example, a porous ceramic filter would have high porosity to allow for fluid flow, while a dense metal alloy would have very low porosity. The choice of method depends on the material’s properties and the desired information. A highly porous material like a sponge might be best analyzed using image analysis or Archimedes’ principle, while a material with fine pores, like a zeolite, would benefit from gas adsorption.
Career Expert Tips:
- Ace those interviews! Prepare effectively by reviewing the Top 50 Most Common Interview Questions on ResumeGemini.
- Navigate your job search with confidence! Explore a wide range of Career Tips on ResumeGemini. Learn about common challenges and recommendations to overcome them.
- Craft the perfect resume! Master the Art of Resume Writing with ResumeGemini’s guide. Showcase your unique qualifications and achievements effectively.
- Don’t miss out on holiday savings! Build your dream resume with ResumeGemini’s ATS optimized templates.
Q 16. Explain the principles behind electron microscopy (SEM/TEM).
Electron microscopy, encompassing both Scanning Electron Microscopy (SEM) and Transmission Electron Microscopy (TEM), uses a beam of electrons to image materials at high magnification. The principles differ slightly between the two techniques.
SEM: In SEM, a focused beam of electrons scans across the surface of a sample. Interactions between the electrons and the sample produce various signals, including secondary electrons, backscattered electrons, and X-rays. Secondary electrons provide high-resolution topographical images, showing the surface texture. Backscattered electrons provide information about the sample’s composition, with heavier elements appearing brighter. X-rays provide elemental analysis through energy-dispersive X-ray spectroscopy (EDS).
TEM: TEM involves transmitting a beam of electrons through a very thin sample. The electrons interact with the sample’s atoms, diffracting or scattering depending on the sample’s structure. This creates an image showing the internal structure of the material, often at atomic resolution. TEM is particularly useful for analyzing the crystalline structure, grain boundaries, and defects within a material.
Think of it like this: SEM is like looking at the surface of a terrain with a powerful magnifying glass, while TEM is like slicing the terrain thin and shining light through it to see its internal layers.
Both techniques are invaluable in materials science, allowing for the visualization of features too small to be seen with optical microscopes. SEM is often used for surface characterization and elemental analysis, while TEM is used for high-resolution imaging of microstructure and crystallography.
Q 17. How do you interpret FTIR spectra?
Fourier Transform Infrared Spectroscopy (FTIR) measures the absorption or transmission of infrared light by a material. The resulting spectrum shows peaks at specific wavelengths (or wavenumbers), which correspond to the vibrational modes of the molecules in the sample. Interpreting FTIR spectra involves identifying these peaks and relating them to specific functional groups or molecular structures.
Each functional group (e.g., O-H, C=O, C-H) absorbs infrared light at characteristic wavenumbers. A strong peak at a particular wavenumber indicates the presence of a specific functional group in the sample. The intensity of the peak is proportional to the concentration of that functional group. Libraries of known spectra are used to identify the peaks and thus the molecular components present.
For example, a broad peak around 3300 cm-1 typically indicates the presence of an O-H group (like in alcohols or carboxylic acids), while a sharp peak around 1700 cm-1 usually suggests a C=O group (like in ketones or aldehydes). Analyzing the position, shape, and intensity of peaks allows for identification of various functional groups and ultimately, the material’s composition.
It’s important to note that spectral interpretation requires expertise and knowledge of the possible components within the sample. Reference standards and software can help with peak identification and analysis.
Q 18. Describe the different types of chromatography and their applications.
Chromatography is a separation technique used to separate the components of a mixture based on their different affinities for a stationary and a mobile phase. Several types exist, each with unique applications:
- Gas Chromatography (GC): Separates volatile compounds based on their boiling points and interactions with a stationary phase in a column. It’s commonly used in environmental monitoring, petroleum analysis, and forensic science.
- High-Performance Liquid Chromatography (HPLC): Separates compounds dissolved in a liquid mobile phase based on their interactions with a stationary phase. It’s widely used in pharmaceutical analysis, food analysis, and biochemical research.
- Thin-Layer Chromatography (TLC): A simple and inexpensive method that separates compounds on a thin layer of absorbent material (like silica gel). It’s used for preliminary analysis and qualitative identification of components.
- Size Exclusion Chromatography (SEC): Separates molecules based on their size and shape. Larger molecules elute faster because they cannot penetrate the pores of the stationary phase as readily. This is valuable for determining molecular weight distribution of polymers.
- Ion Chromatography (IC): Separates ions based on their charge and affinity for an ion-exchange resin. It’s used for analysis of inorganic ions in water and other samples.
The choice of chromatography method depends on the properties of the compounds to be separated and the desired level of detail. For example, GC is ideal for separating volatile organic compounds, while HPLC is suitable for analyzing non-volatile and thermally labile molecules.
Q 19. What are the advantages and disadvantages of different spectroscopic techniques?
Various spectroscopic techniques offer different advantages and disadvantages:
- FTIR: Advantages include speed, ease of use, minimal sample preparation, and identification of functional groups. Disadvantages are its limited sensitivity for some components and potential interference from water.
- UV-Vis Spectroscopy: Advantages are its simplicity, speed, and application in quantifying analytes with conjugated pi-systems. Disadvantages include its limited structural information and potential interference from other absorbing species.
- Nuclear Magnetic Resonance (NMR): Advantages include high structural detail and identification of many types of nuclei. Disadvantages are lower sensitivity compared to other techniques, the need for specialized equipment, and limited applicability to certain nuclei or systems.
- X-ray Diffraction (XRD): Advantages are its ability to identify crystalline phases and determine crystal structure. Disadvantages include its limited applicability to amorphous materials and the need for crystalline samples.
The best technique depends on the specific application and the properties of the material being studied. For example, if the goal is to identify functional groups in an organic molecule, FTIR might be preferred. If detailed structural information is needed, NMR would be a more appropriate choice. A decision matrix considering the available equipment, cost, sample requirements, and desired information is crucial.
Q 20. How would you determine the refractive index of a material?
The refractive index (RI) is a measure of how much light bends (refracts) when passing from one medium to another. Several methods exist for determining the RI of a material:
- Abbe Refractometer: This is a common and relatively simple method for measuring the RI of liquids and transparent solids. The instrument uses a prism to measure the critical angle of refraction, which is then related to the RI.
- Prismatic Method: A more basic method involves measuring the angle of refraction using Snell’s Law: n1sinθ1 = n2sinθ2, where n1 and n2 are the refractive indices of the two media, and θ1 and θ2 are the angles of incidence and refraction, respectively.
- Ellipsometry: This is a more sophisticated technique that measures the polarization changes of light reflected from a surface. This technique can be used to determine the RI and thickness of thin films.
For example, to determine the RI of a liquid using an Abbe refractometer, a few drops of the liquid are placed on the prism, and the RI is read directly from the scale. The choice of method depends on the material’s state (liquid, solid, thin film), transparency, and the desired level of accuracy.
Q 21. Explain the concept of hardness testing and its different methods.
Hardness testing measures a material’s resistance to indentation or scratching. Several methods exist, each using a different indenter and measurement technique:
- Brinell Hardness Test: Uses a hardened steel or carbide ball indenter to indent the material under a specified load. The hardness is calculated based on the size of the indentation.
- Rockwell Hardness Test: Measures the depth of penetration of an indenter (either a diamond cone or steel ball) under a major and minor load. Various Rockwell scales exist (e.g., A, B, C) depending on the material and indenter used.
- Vickers Hardness Test: Uses a square-based diamond pyramid indenter, and hardness is calculated from the diagonal length of the indentation. It’s suitable for a wide range of materials, from soft metals to very hard ceramics.
- Shore Durometer: Measures the resistance of a material to indentation by a small indenter. This is commonly used for softer materials, like rubber and plastics.
The choice of method depends on the material’s hardness and the required accuracy. Brinell is often used for softer metals, Rockwell for a wider range of materials, Vickers for harder materials and precise measurements, and Shore for soft elastomers. Each test provides a numerical hardness value, which can be compared to standards to assess the material’s properties.
Q 22. How do you determine the thermal conductivity of a material?
Determining the thermal conductivity of a material involves measuring its ability to transfer heat. Several methods exist, each with its strengths and limitations. One common method is the steady-state method. This involves applying a known heat flux across a sample of known dimensions and measuring the resulting temperature gradient. Thermal conductivity (k) is then calculated using Fourier’s Law: q = -k * (dT/dx), where ‘q’ is the heat flux, ‘dT’ is the temperature difference across the sample, and ‘dx’ is the sample thickness. Imagine it like this: think of a hot plate with a slab of material on top, and a thermometer measuring the temperature at the top and bottom. The faster the heat travels through the material, the higher the thermal conductivity.
Another method is the transient plane source (TPS) technique, which uses a sensor that both generates and measures heat. This method is particularly useful for measuring the thermal conductivity of liquids and solids with low thermal conductivity. The advantage here is it requires smaller samples and less time to perform a measurement.
The choice of method depends on factors such as the material’s properties, the desired accuracy, and the available equipment. For instance, highly anisotropic materials might require more sophisticated techniques like laser flash analysis.
Q 23. Describe the principles behind atomic force microscopy (AFM).
Atomic Force Microscopy (AFM) is a powerful technique used to image surfaces at the nanoscale. It works by scanning a sharp tip, usually made of silicon or silicon nitride, across a sample’s surface. This tip is attached to a cantilever, a tiny beam that bends in response to forces between the tip and the sample. These forces, which can be van der Waals forces, electrostatic forces, or magnetic forces, cause the cantilever to deflect.
A laser beam reflected off the back of the cantilever is used to detect these tiny deflections. A photodiode measures changes in the reflected laser beam’s position, providing information about the surface topography. Different AFM modes exist, such as contact mode, tapping mode, and non-contact mode, each optimized for various sample types and surface properties. Contact mode provides high resolution but can damage soft samples. Tapping mode mitigates this issue by intermittently contacting the surface, while non-contact mode avoids contact altogether, suitable for delicate samples but with lower resolution.
Think of it like running your finger over a surface to feel its texture, but with a much, much smaller, sharper ‘finger’ that can detect incredibly fine details, and a system that measures the force needed and creates a topographical map of what that surface looks like at the atomic scale.
Q 24. Explain different methods for determining the melting point of a material.
Determining the melting point of a material involves observing the temperature at which it transitions from a solid to a liquid state. The most common method is using a melting point apparatus, which typically involves placing a small amount of the sample in a capillary tube and heating it slowly while observing the temperature. The temperature at which the sample begins to melt and the temperature at which it is completely melted are recorded. This is simple and readily accessible for many lab settings.
Differential Scanning Calorimetry (DSC) provides a more sophisticated approach. DSC measures the heat flow associated with phase transitions. As the sample melts, it absorbs heat, resulting in a characteristic endothermic peak in the DSC curve. The temperature at the peak’s onset is typically taken as the melting point. DSC provides more accurate and detailed information, including the enthalpy of fusion.
Other methods include hot-stage microscopy, where the melting process is observed visually under a microscope, and thermal analysis techniques such as thermogravimetric analysis (TGA), which can be used in combination with other methods to analyze melting processes with weight loss or gain.
The choice of method depends on the accuracy required, the amount of sample available, and the nature of the material. For example, DSC is preferred for precise measurements and obtaining thermodynamic data, while a simple melting point apparatus is suitable for routine quality control checks.
Q 25. What are the different types of mechanical testing performed on materials?
Mechanical testing assesses a material’s response to applied forces. The specific tests employed depend on the material’s intended application and properties of interest. Common categories include:
- Tensile testing: Measures a material’s strength, ductility, and Young’s modulus by applying a uniaxial tensile load. Think pulling a metal bar until it breaks.
- Compression testing: Determines the material’s compressive strength and stiffness by applying a compressive load. Imagine squashing a cube.
- Flexural testing (bending): Measures the material’s strength and stiffness when subjected to bending loads. Think bending a piece of wood or plastic.
- Shear testing: Evaluates the material’s resistance to shear forces, where two layers slide past each other. Think cutting a piece of paper.
- Hardness testing: Assesses the material’s resistance to indentation. Common methods include Rockwell, Brinell, and Vickers hardness tests.
- Impact testing: Measures the material’s resistance to sudden, high-energy impacts. Examples include Izod and Charpy impact tests.
- Fatigue testing: Determines the material’s endurance limit – the maximum stress it can withstand for a specified number of cycles without failure. This is crucial in applications with repetitive loads such as airplane wings or engine components.
The selection of mechanical tests is crucial for ensuring the safety and reliability of engineered components and structures.
Q 26. How would you troubleshoot a failed experiment in physical property characterization?
Troubleshooting a failed physical property characterization experiment requires a systematic approach. First, carefully review the experimental procedure and identify potential sources of error. This might involve checking the calibration of equipment, ensuring the proper sample preparation, or verifying the accuracy of the measurements. Think of it like detective work! Check for any obvious signs of error such as incorrect temperature settings or failure in recording data.
Next, analyze the results. Look for any anomalies or inconsistencies that could indicate a problem. Were there any unusual readings? Did the data deviate significantly from expected values? Compare to previous successful runs to highlight any deviations.
If the problem isn’t immediately apparent, consider repeating the experiment with modifications to eliminate possible error sources. Maybe a different sample preparation method or a more controlled environment is required. It’s crucial to keep detailed records of each step to track the progression.
If the problem persists, consult relevant literature, seek advice from colleagues, or contact the equipment manufacturer for technical support. Sometimes, a fresh perspective can reveal a subtle error that has been overlooked.
Q 27. Describe a time you had to overcome a technical challenge during a materials characterization experiment.
During a research project involving the characterization of a novel polymer composite, we encountered a significant challenge with obtaining consistent and reliable data from tensile testing. Initial results were highly variable, which cast doubt on the material’s mechanical properties. After careful examination, we discovered that the problem stemmed from inconsistencies in the sample preparation. Although we meticulously followed the established protocol, minor variations in the curing process were affecting the final mechanical properties.
To address this issue, we implemented a more rigorous protocol to precisely control the curing temperature and time. We also introduced additional quality control steps to ensure the uniformity of the prepared samples. Using a controlled environment chamber and a dedicated curing oven improved temperature control and reproducibility. The revised protocol led to significantly improved consistency in the tensile testing results, allowing us to accurately characterize the composite’s mechanical properties and publish our findings with confidence.
Key Topics to Learn for Physical Property Characterization Interview
- Thermophysical Properties: Understanding concepts like density, viscosity, thermal conductivity, and specific heat capacity. Explore their measurement techniques and applications in material science and process engineering.
- Mechanical Properties: Mastering tensile strength, yield strength, elasticity, hardness, and fracture toughness. Be prepared to discuss practical applications in material selection and structural design, including relevant testing methods.
- Rheological Properties: Familiarize yourself with the behavior of fluids under stress, including viscosity, elasticity, and viscoelasticity. Discuss applications in polymer science, food processing, and other industries requiring flow characterization.
- Optical Properties: Gain a solid understanding of refractive index, transparency, absorption, and scattering of light. Discuss applications in optical materials, coatings, and characterization techniques like spectroscopy.
- Surface Properties: Explore surface area, porosity, wettability, and surface energy. Be ready to discuss techniques like BET analysis and contact angle measurements and their relevance in catalysis, adsorption, and drug delivery.
- Data Analysis and Interpretation: Develop strong skills in analyzing experimental data, understanding error analysis, and interpreting results effectively. This is crucial for drawing meaningful conclusions and presenting your findings professionally.
- Instrumental Techniques: Gain familiarity with common techniques used in physical property characterization, such as microscopy (SEM, TEM), spectroscopy (FTIR, NMR), chromatography (GC, HPLC), and thermal analysis (DSC, TGA). Understand their principles and applications.
Next Steps
Mastering Physical Property Characterization opens doors to exciting careers in diverse fields, from materials science and engineering to pharmaceuticals and nanotechnology. A strong understanding of these concepts is highly sought after by employers. To maximize your job prospects, it’s crucial to present your skills effectively. Creating an ATS-friendly resume is key to getting your application noticed. We highly recommend using ResumeGemini to build a professional and impactful resume that highlights your expertise in Physical Property Characterization. ResumeGemini offers tools and examples specifically tailored to this field, helping you stand out from the competition. Examples of resumes tailored to Physical Property Characterization are available to help guide your resume creation.
Explore more articles
Users Rating of Our Blogs
Share Your Experience
We value your feedback! Please rate our content and share your thoughts (optional).
