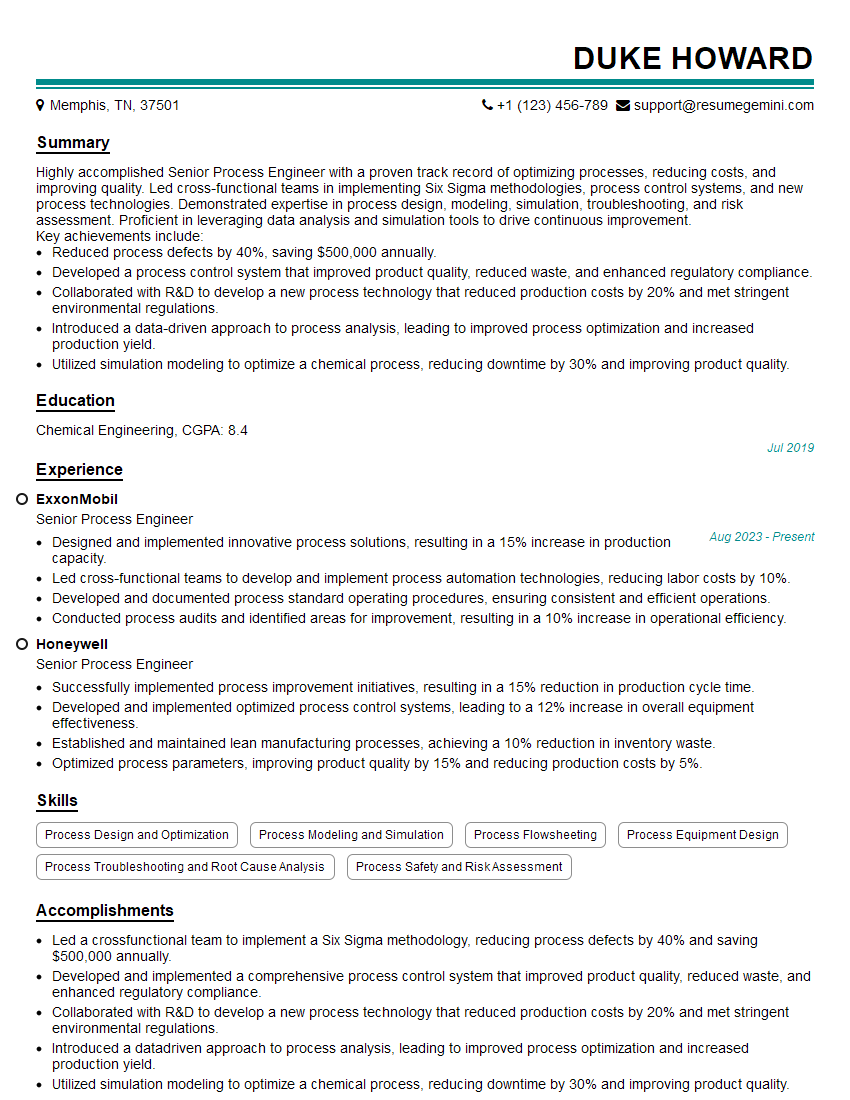
Every successful interview starts with knowing what to expect. In this blog, we’ll take you through the top Process Optimization and Control interview questions, breaking them down with expert tips to help you deliver impactful answers. Step into your next interview fully prepared and ready to succeed.
Questions Asked in Process Optimization and Control Interview
Q 1. Explain the difference between open-loop and closed-loop control systems.
The core difference between open-loop and closed-loop control systems lies in their feedback mechanisms. An open-loop system operates based on pre-programmed instructions without considering the actual output. Think of a toaster: you set the time, and it runs for that duration regardless of whether the bread is perfectly toasted. The output is not monitored or used to adjust the process.
In contrast, a closed-loop system, also known as a feedback control system, uses the output to continuously adjust the input. A thermostat is a classic example. It measures the room temperature (output) and compares it to the setpoint (desired temperature). If the actual temperature is lower, it activates the heater; if it’s higher, it turns it off. This continuous feedback loop ensures the system maintains the desired output.
In process optimization, closed-loop control offers significantly greater accuracy and stability. Open-loop control is suitable for simpler, less demanding applications where precise control isn’t critical.
Q 2. Describe your experience with Lean manufacturing principles.
My experience with Lean manufacturing principles is extensive, spanning several projects across different industries. I’ve actively participated in implementing Lean methodologies to streamline processes, reduce waste (muda), and improve overall efficiency. This involved applying tools such as:
- Value Stream Mapping (VSM): I’ve led multiple VSM workshops to visually map out processes, identifying non-value-added steps and bottlenecks. For example, in a previous project at a food processing plant, VSM helped us identify redundant transportation steps, leading to a 15% reduction in processing time.
- 5S Methodology (Sort, Set in Order, Shine, Standardize, Sustain): I’ve implemented 5S to improve workplace organization and reduce waste. This involved training staff on the principles of 5S and conducting regular audits to maintain improvements.
- Kaizen Events (Continuous Improvement): I have facilitated numerous Kaizen events, engaging cross-functional teams to identify and implement quick, incremental improvements. This collaborative approach fosters a culture of continuous improvement within organizations.
My work has consistently demonstrated the effectiveness of Lean principles in driving operational excellence and enhancing profitability.
Q 3. How familiar are you with Six Sigma methodologies (DMAIC, DMADV)?
I’m highly familiar with Six Sigma methodologies, particularly DMAIC and DMADV.
DMAIC (Define, Measure, Analyze, Improve, Control) is a data-driven approach to improving existing processes. I’ve used DMAIC to reduce defects, improve cycle times, and enhance overall process capability. For instance, in one project, we used DMAIC to reduce the defect rate in a semiconductor manufacturing process from 3% to less than 0.5% by identifying and addressing root causes of defects.
DMADV (Define, Measure, Analyze, Design, Verify) focuses on designing new processes or products that meet predefined quality requirements. I’ve applied DMADV in new product development projects to ensure robust and reliable processes from the outset. This often involves the use of Design of Experiments (DOE) to optimize process parameters and minimize variability.
Q 4. What are some common process control strategies (e.g., PID control)?
Several common process control strategies exist, with Proportional-Integral-Derivative (PID) control being the most widely used. PID control adjusts the manipulated variable based on three components:
- Proportional (P): The controller output is proportional to the error (difference between setpoint and actual value). This provides immediate response to deviations.
- Integral (I): The controller output is proportional to the integral of the error over time. This eliminates steady-state errors, ensuring the system reaches the setpoint eventually.
- Derivative (D): The controller output is proportional to the rate of change of the error. This anticipates future errors and prevents overshoot or oscillations.
Other common strategies include:
- On-Off Control: A simple strategy where the controller is either fully on or fully off, suitable for less demanding applications.
- Feedforward Control: Anticipates disturbances by using a model of the process to adjust the input before the disturbance affects the output.
- Model Predictive Control (MPC): A sophisticated technique that uses a process model to predict future behavior and optimize control actions over a given time horizon.
The choice of control strategy depends on the specific process requirements and complexity.
Q 5. How do you identify bottlenecks in a manufacturing process?
Identifying bottlenecks in a manufacturing process involves a systematic approach combining data analysis and process observation. Here’s a step-by-step process:
- Data Collection: Gather data on cycle times, production rates, inventory levels, and machine utilization for each stage of the process.
- Process Mapping: Create a visual representation of the process flow, including all steps and their durations. This could involve a flowchart or value stream map.
- Identify Critical Points: Analyze the data to identify stages with significantly longer cycle times, higher defect rates, or low utilization rates. These are potential bottlenecks.
- Bottleneck Verification: Observe the process firsthand to validate the identified bottlenecks and understand their root causes. This might involve interviewing workers and observing material flow.
- Root Cause Analysis: Use tools like the 5 Whys or Fishbone diagrams to investigate the root causes of the bottlenecks. These could include equipment limitations, inefficient procedures, material shortages, or operator skill gaps.
For example, in a previous project, we identified a bottleneck at a particular assembly station due to a poorly designed workstation layout. By redesigning the layout and improving work organization, we significantly increased the throughput of that station.
Q 6. Explain your understanding of process capability analysis (e.g., Cp, Cpk).
Process capability analysis assesses whether a process is capable of consistently producing output within specified customer requirements or specifications. Cp and Cpk are key metrics used in this analysis.
Cp (Process Capability Index) indicates the inherent capability of a process, irrespective of its centering. It measures the spread of the process data relative to the specification limits. A Cp value greater than 1 suggests the process is capable, while a value less than 1 indicates that the process is not capable of meeting the specifications.
Cpk (Process Capability Index – considering centering) considers both the spread of the process data and its centering relative to the target value. Cpk takes into account the potential bias (off-center) of the process. A Cpk value greater than 1 indicates the process is capable and centered, ensuring that the process is producing output that meets the customer requirements. A Cpk less than 1 suggests the process is not capable, even if Cp might suggest otherwise because of poor centering.
For example, if a process has a Cp of 1.5 but a Cpk of 0.8, this indicates that the process is inherently capable but its output is consistently off-target, not meeting customer needs.
Q 7. Describe your experience with statistical process control (SPC).
My experience with Statistical Process Control (SPC) is extensive. I’ve implemented and utilized SPC tools to monitor process performance, identify process variations, and prevent defects. I’m proficient in using control charts (e.g., X-bar and R charts, p-charts, c-charts) to track key process parameters and detect shifts or trends indicating potential problems.
I’ve utilized SPC in various applications, including:
- Monitoring production processes: Identifying and addressing process instability before it leads to defects or out-of-spec products.
- Improving process consistency: Reducing process variation and improving the overall quality of the output.
- Diagnosing process problems: Using control charts to pinpoint the root causes of process variation.
- Supporting process improvement initiatives: Providing data-driven evidence to justify process changes and track the effectiveness of improvement efforts.
For example, I successfully implemented an SPC program in a packaging plant, leading to a significant reduction in packaging defects and improved customer satisfaction.
Q 8. How would you use data analysis to improve a process?
Data analysis is crucial for process improvement. It allows us to move beyond gut feelings and anecdotal evidence to identify areas for optimization based on concrete data. The process typically involves several steps:
- Data Collection: This involves identifying relevant data sources, which could range from manufacturing equipment sensors, CRM systems, or even manual data entry. The key is to collect data that reflects the process’s key performance indicators (KPIs).
- Data Cleaning and Preprocessing: Raw data is often messy. This step involves handling missing values, outliers, and inconsistencies to ensure data accuracy and reliability. Techniques like data imputation and outlier detection are employed here.
- Exploratory Data Analysis (EDA): This involves visualizing the data to understand patterns, trends, and relationships. Histograms, scatter plots, and box plots are common tools. For example, a scatter plot might reveal a correlation between machine speed and defect rate.
- Statistical Analysis: Techniques like regression analysis, ANOVA, or control charts are used to identify statistically significant relationships between variables and KPIs. This helps pinpoint the root causes of inefficiencies.
- Actionable Insights: The final and most important step. The analysis should lead to specific, measurable, achievable, relevant, and time-bound (SMART) actions. For example, if the analysis shows a strong correlation between operator training and defect rate, we might recommend additional training for operators.
Example: In a manufacturing setting, we might analyze sensor data from a production line to identify bottlenecks and optimize the flow of materials. By analyzing data on cycle times, downtime, and defect rates, we can pinpoint the exact source of delays and implement targeted improvements.
Q 9. What are some common process optimization techniques?
Many techniques exist for process optimization. The best choice depends on the specific process and its challenges. Here are a few common ones:
- Lean Manufacturing: Focuses on eliminating waste (muda) in all forms, including defects, overproduction, waiting, transportation, inventory, motion, and over-processing. Tools include Value Stream Mapping, 5S, Kanban, and Kaizen.
- Six Sigma: A data-driven approach to minimizing defects and variability. It utilizes statistical methods like DMAIC (Define, Measure, Analyze, Improve, Control) to identify and eliminate root causes of defects.
- Design of Experiments (DOE): A statistical method used to determine the optimal settings of process parameters by systematically varying inputs and measuring the corresponding outputs. It’s particularly useful for complex processes with many variables.
- Simulation: Using software to model and analyze a process, allowing for the testing of different scenarios and optimization strategies without disrupting the real-world process. This is helpful for identifying potential bottlenecks and evaluating the impact of changes.
- Business Process Re-engineering (BPR): A radical approach involving fundamental rethinking and redesign of business processes to achieve dramatic improvements in performance. Often involves technology changes.
Example: A company using Lean might implement Kanban to manage inventory, reducing storage costs and lead times. A company using Six Sigma might conduct a DMAIC project to reduce the number of defects in a manufacturing process.
Q 10. How do you measure the effectiveness of a process improvement initiative?
Measuring the effectiveness of process improvement is critical for demonstrating ROI and justifying further investment. Key metrics depend on the specific initiative’s goals, but some common measures include:
- Key Performance Indicators (KPIs): These are quantifiable measures that reflect the success of the process. Examples include cycle time reduction, defect rate reduction, customer satisfaction scores, throughput increase, and cost savings.
- Return on Investment (ROI): Calculates the financial benefits of the improvement initiative relative to its costs. It’s essential for demonstrating the economic value of the changes.
- Before-and-After Comparisons: Comparing KPI values before and after implementing the improvements provides a clear picture of the impact.
- Statistical Significance Testing: Using statistical tests to determine whether observed improvements are statistically significant, ruling out chance occurrences.
- Customer Feedback: Gathering customer feedback through surveys or other methods can provide qualitative data on the impact of the improvements on customer satisfaction.
Example: If a process improvement initiative aimed to reduce cycle time, we would track the average cycle time before and after the changes, using statistical tests to verify if the reduction is significant. We’d also calculate the ROI by comparing cost savings (e.g., reduced labor costs, less waste) against the investment in the initiative.
Q 11. Describe your experience with process simulation software.
I have extensive experience with various process simulation software packages, including Arena, AnyLogic, and Simio. My experience covers building discrete event simulation models to represent different processes, such as manufacturing lines, supply chains, or call centers. I’ve used these models for:
- Bottleneck Identification: Identifying bottlenecks in processes that limit throughput and capacity.
- Capacity Planning: Determining the required capacity of different resources to meet demand.
- What-If Analysis: Evaluating the impact of different changes to the process, such as adding equipment or changing staffing levels, without risking real-world disruptions.
- Optimization: Using simulation software to find optimal process configurations that maximize throughput, minimize costs, or improve other relevant metrics.
Example: In a recent project for a logistics company, I built an AnyLogic model of their warehouse operations. The simulation helped identify a bottleneck in the order picking process, which was addressed by reconfiguring the warehouse layout and optimizing the picking routes. This resulted in a 15% increase in order fulfillment efficiency.
Q 12. How do you handle process deviations and unexpected events?
Process deviations and unexpected events are inevitable. Handling them effectively requires a proactive and reactive approach:
- Proactive Measures: This involves implementing robust process controls, such as automated alerts for deviations, preventative maintenance schedules, and establishing clear escalation procedures. This includes establishing standard operating procedures (SOPs) to guide operators during normal and abnormal events.
- Reactive Measures: When deviations occur, immediate action is needed. This involves using monitoring systems to detect deviations, swiftly investigating the root cause using techniques such as the 5 Whys, and taking corrective actions to restore the process to its normal state. A well-defined escalation path ensures timely involvement of appropriate personnel.
- Post-Incident Analysis: After resolving the deviation, it’s vital to conduct a thorough post-incident analysis to understand the root cause and implement preventive measures to prevent similar occurrences in the future. This often involves documenting lessons learned and updating SOPs.
Example: If a manufacturing line unexpectedly stops due to a machine malfunction, the immediate response involves troubleshooting the equipment and restarting the line. A post-incident analysis will then investigate the root cause of the malfunction (e.g., worn parts, lack of preventative maintenance) and implement corrective actions to prevent future occurrences.
Q 13. Explain your experience with root cause analysis.
Root cause analysis is a systematic process for identifying the underlying cause of a problem, rather than just addressing its symptoms. I’m proficient in several root cause analysis techniques, including:
- 5 Whys: A simple but effective technique that involves repeatedly asking “why” to uncover the root cause. While seemingly basic, it’s powerful in its simplicity.
- Fishbone Diagram (Ishikawa Diagram): A visual tool that organizes potential causes into categories (e.g., people, methods, machines, materials, environment, measurements) to identify potential root causes.
- Fault Tree Analysis (FTA): A deductive technique that graphically represents the relationships between various events and their contributing factors, leading to a top-level undesired event.
- Failure Mode and Effects Analysis (FMEA): A proactive technique used to identify potential failure modes in a process and assess their potential impact. This helps prioritize preventive measures.
Example: If a product consistently fails a quality inspection, using the 5 Whys might reveal a sequence like: 1. Why are the products failing? – Because of dimensional inaccuracies. 2. Why are there dimensional inaccuracies? – Because the machine isn’t calibrated correctly. 3. Why is the machine not calibrated? – Because the calibration procedure is not followed. 4. Why is the calibration procedure not followed? – Because the operators are not adequately trained. 5. Why are the operators not trained? – Because there was insufficient training budget. The root cause is ultimately insufficient training budget, not the faulty products themselves.
Q 14. How would you design a control chart for a specific process?
Designing a control chart involves several steps:
- Define the Process and Data: Identify the specific process to be monitored and the relevant data to be collected. This data should be continuous (e.g., weight, temperature, dimension) or attribute (e.g., number of defects).
- Choose the Appropriate Control Chart: The choice depends on the type of data:
- X-bar and R chart: Used for continuous data, monitoring the average and range of subgroups.
- X-bar and s chart: Also for continuous data, using standard deviation instead of range.
- p-chart: Used for attribute data, monitoring the proportion of defectives.
- c-chart: Used for attribute data, monitoring the number of defects per unit.
- Collect Data: Gather data from the process. It’s important to collect data over a sufficient period to capture natural variation.
- Calculate Control Limits: Calculate the upper control limit (UCL) and lower control limit (LCL) using appropriate statistical formulas. These limits define the range of natural variation for the process. Commonly this involves calculating the average and standard deviation of the collected data.
- Plot the Data: Plot the data on the control chart, indicating the UCL, LCL, and the centerline (average).
- Interpret the Chart: Analyze the chart for patterns and points outside the control limits. Points outside the limits suggest special cause variation requiring investigation. Patterns within the limits (e.g., trends) might also suggest a need for process improvement even if they don’t directly break the control limits.
Example: To monitor the diameter of manufactured parts, we’d use an X-bar and R chart. We’d collect data from samples of parts at regular intervals, calculate the average diameter and range for each sample, and then plot these values on the chart. Points outside the control limits would signal a problem that requires immediate attention, such as a machine malfunction or a change in raw materials.
Q 15. Describe your experience with different types of control valves.
My experience encompasses a wide range of control valves, crucial components in process control systems. I’ve worked extensively with various types, including:
- Globe Valves: These are versatile and commonly used for throttling flow. I’ve utilized them in numerous applications, from regulating steam flow in power generation to controlling chemical feed rates in a pharmaceutical plant. Their adjustability is key, and understanding their inherent characteristics, like pressure drop versus flow rate, is vital for accurate control.
- Ball Valves: These are excellent for on/off service due to their quick-opening and closing capabilities. I’ve incorporated them in safety systems where rapid shutoff is paramount, like emergency shutdowns in pipelines or chemical reactors. Their simple design reduces maintenance needs, though selecting the appropriate material for corrosion resistance is crucial.
- Butterfly Valves: Ideal for large-diameter lines, they offer low pressure drop but might not be as precise for throttling as globe valves. I have experience optimizing their use in water treatment facilities, adjusting flow rates while minimizing energy consumption.
- Diaphragm Valves: These are especially useful for handling slurries or corrosive fluids due to their unique design. I’ve employed them in wastewater treatment plants, ensuring consistent flow despite the presence of abrasive particles. The selection process always considers material compatibility and the potential for clogging.
Beyond the valve type itself, I’m proficient in sizing valves appropriately, selecting the right actuator (pneumatic, electric, hydraulic), and understanding the impact of valve characteristics on overall process performance and stability. Proper valve selection and maintenance are critical for avoiding costly downtime and ensuring process safety.
Career Expert Tips:
- Ace those interviews! Prepare effectively by reviewing the Top 50 Most Common Interview Questions on ResumeGemini.
- Navigate your job search with confidence! Explore a wide range of Career Tips on ResumeGemini. Learn about common challenges and recommendations to overcome them.
- Craft the perfect resume! Master the Art of Resume Writing with ResumeGemini’s guide. Showcase your unique qualifications and achievements effectively.
- Don’t miss out on holiday savings! Build your dream resume with ResumeGemini’s ATS optimized templates.
Q 16. How do you ensure the safety of workers during process optimization?
Worker safety is paramount in any process optimization project. My approach integrates safety considerations at every stage, starting with a comprehensive risk assessment. This includes identifying potential hazards – chemical exposure, high-pressure systems, moving machinery – and establishing appropriate control measures.
- Lockout/Tagout Procedures (LOTO): Strict adherence to LOTO protocols is mandatory before any maintenance or modification of equipment. I ensure all team members are thoroughly trained and comply with these procedures.
- Personal Protective Equipment (PPE): Appropriate PPE, including safety glasses, gloves, respirators, and hearing protection, is provided and its proper usage is enforced. Regular inspections ensure PPE is in good working order.
- Safety Training: All personnel involved in process optimization activities receive comprehensive safety training. This includes hazard identification, emergency procedures, and the safe handling of equipment and chemicals. Refresher training is conducted regularly.
- Permit-to-Work Systems: For high-risk activities, permit-to-work systems are implemented to control access to hazardous areas and ensure that work is conducted under controlled conditions.
- Regular Safety Audits: Frequent safety audits are conducted to identify and correct potential hazards and to ensure compliance with safety regulations. The findings are documented and addressed promptly.
Safety isn’t just a checklist; it’s a continuous mindset. Open communication and a culture of safety are fundamental to a productive and safe work environment. I proactively involve the workforce in identifying hazards and suggesting improvements.
Q 17. What are some common challenges in process optimization projects?
Process optimization projects, while promising increased efficiency and profitability, often encounter several challenges. Some of the most common include:
- Data Acquisition and Quality: Obtaining reliable and accurate process data is often a significant hurdle. Incomplete or noisy data can lead to inaccurate models and ineffective optimizations. This requires careful planning of data collection strategies and rigorous data validation techniques.
- Model Uncertainty: Process models are simplifications of reality, and uncertainties in model parameters can significantly impact optimization results. Robust optimization techniques that account for model uncertainty are crucial.
- Process Constraints: Optimization problems are often subject to various constraints, such as operating limits, safety regulations, and equipment limitations. Handling these constraints effectively is vital for finding feasible and practical solutions. Linear and non-linear programming techniques play a critical role here.
- Integration Challenges: Integrating optimization solutions with existing control systems and operator interfaces can be complex, requiring careful planning and collaboration with IT and automation teams.
- Resistance to Change: Implementing changes within an organization can face resistance from personnel who are accustomed to existing workflows. Effective change management strategies are necessary to address this.
- Unexpected Events and Disturbances: Process upsets or unexpected events can disrupt the optimized operation. Robust control strategies that maintain stability in the face of disturbances are critical.
Successfully navigating these challenges requires a multidisciplinary approach, combining technical expertise with effective project management and strong communication skills.
Q 18. How do you communicate technical information to non-technical audiences?
Communicating complex technical information to non-technical audiences is a key skill in process optimization. I employ several strategies:
- Analogies and Visual Aids: Relating technical concepts to everyday experiences helps non-technical stakeholders grasp the underlying principles. For example, explaining feedback control using a thermostat analogy simplifies a complex concept. Visual aids such as charts, graphs, and diagrams are also incredibly effective.
- Simplified Language and Terminology: Avoiding technical jargon and using plain language ensures clarity. If technical terms are unavoidable, I always provide clear and concise definitions.
- Storytelling: Framing technical information within a compelling narrative makes it more memorable and engaging. I might relate the impact of process improvements to real-world examples, such as reduced energy consumption leading to cost savings.
- Focus on Key Messages: Identifying and emphasizing the most important aspects of the information ensures that the core message is clearly understood.
- Interactive Presentations: Instead of lengthy presentations, interactive sessions with Q&A allow for clarification and address any confusion.
Ultimately, effective communication ensures alignment and buy-in from all stakeholders, critical for the successful implementation of process optimization projects.
Q 19. Describe your experience with project management methodologies.
My project management experience encompasses various methodologies, including:
- Agile: In projects requiring adaptability and iterative development, I leverage Agile principles. The iterative nature of Agile allows for incorporating feedback early in the process, adjusting to changing requirements and priorities efficiently.
- Waterfall: For projects with clearly defined requirements and a linear progression, a Waterfall approach can be highly effective. Its structured nature provides a clear roadmap and facilitates progress tracking.
- Lean: Lean principles help in streamlining processes and eliminating waste, improving overall efficiency and reducing project duration. This focuses on delivering value quickly and minimizing unnecessary steps.
- Six Sigma: Six Sigma methodologies, with their emphasis on data-driven decision-making and continuous improvement, are valuable for process optimization projects. The DMAIC (Define, Measure, Analyze, Improve, Control) framework is frequently employed to identify and resolve process inefficiencies.
I tailor my approach to the specific project requirements, often integrating elements from different methodologies to optimize the project lifecycle. Consistent project tracking, risk management, and effective communication remain critical regardless of the chosen methodology.
Q 20. How do you prioritize multiple process improvement projects?
Prioritizing multiple process improvement projects requires a systematic approach. I typically utilize a framework combining several criteria:
- Business Value: The potential financial return (cost savings, increased revenue) is a primary consideration. Projects with higher potential ROI are prioritized.
- Strategic Alignment: Projects aligned with the overall business strategy and long-term goals receive higher priority.
- Urgency and Risk: Projects with urgent deadlines or high-risk factors (safety, regulatory compliance) are prioritized to minimize potential disruptions.
- Feasibility and Resources: Projects’ feasibility, considering available resources (budget, personnel, technology), is carefully assessed. Unrealistic projects are deferred or broken down into smaller, manageable tasks.
- Impact and Scope: The potential impact on the overall process and the project scope is evaluated. Smaller, quicker projects might be prioritized to show early wins and build momentum.
Using a weighted scoring system for each criterion allows for objective comparison and ranking of projects. Regular reviews and adjustments to the prioritization are essential, reflecting evolving business needs and project progress.
Q 21. Explain your experience with different types of sensors and actuators.
My experience with sensors and actuators is extensive, covering a broad range of technologies crucial for effective process control and optimization.
- Sensors: I’ve worked with various sensor types, including temperature sensors (thermocouples, RTDs), pressure sensors (differential pressure, absolute pressure), flow sensors (Coriolis, ultrasonic, orifice plates), level sensors (ultrasonic, radar, float switches), and analytical sensors (pH, conductivity, gas analyzers). The choice of sensor depends on the specific application, accuracy requirements, and environmental conditions.
- Actuators: Similarly, I have experience with pneumatic, electric, and hydraulic actuators for controlling valves, pumps, and other process equipment. Pneumatic actuators are frequently used for their inherent safety features, electric actuators for precision and automation, and hydraulic actuators for high force applications.
Beyond the selection of sensors and actuators, I understand the critical importance of calibration, proper installation, and regular maintenance to ensure data accuracy and reliable equipment operation. The integration of these components into a robust process control system is essential for effective process optimization. For example, in a chemical reactor, precise temperature and pressure measurements from sensors feed data to a control system, which then adjusts valve positions (via actuators) to maintain optimal operating conditions.
Q 22. How familiar are you with different process control architectures?
My familiarity with process control architectures is extensive. I’ve worked with a range of systems, from simple single-loop controllers to complex distributed control systems (DCS) and supervisory control and data acquisition (SCADA) systems. Understanding the architecture is crucial for effective optimization.
- Single-loop controllers: These are basic systems focusing on one specific process variable, like temperature or pressure, using a proportional-integral-derivative (PID) controller. Think of a simple thermostat regulating room temperature – a classic example.
- Distributed Control Systems (DCS): These are more sophisticated systems that manage multiple loops and processes across a plant, offering redundancy and advanced control strategies. They often involve multiple interconnected controllers communicating via a network. I have experience with DCS platforms like Siemens PCS7 and Honeywell Experion.
- Supervisory Control and Data Acquisition (SCADA): These systems provide a higher-level overview and control of multiple processes, often spanning a larger geographical area. SCADA systems visualize data from various sources, allowing operators to monitor and control the entire operation. My experience includes working with SCADA systems for water treatment plants and manufacturing facilities.
- Advanced Process Control (APC): This involves using more sophisticated algorithms, like model predictive control (MPC), to optimize multiple variables simultaneously. This leads to improved efficiency and reduced waste. I’ve successfully implemented APC strategies to minimize energy consumption in a chemical processing plant.
Choosing the right architecture depends on the complexity of the process, scalability requirements, and budget constraints. My experience enables me to recommend and implement the most suitable architecture for any given scenario.
Q 23. Describe your experience with automation technologies.
My automation experience is broad and spans various technologies, focusing on increasing efficiency and reducing human error. I’m proficient in programming PLCs (Programmable Logic Controllers) using languages like ladder logic and structured text. I’ve also worked extensively with Human-Machine Interfaces (HMIs) for process visualization and control.
- PLC Programming: I’ve developed and debugged PLC programs for various applications, including robotic control, automated material handling, and process sequencing. For example, I once developed a PLC program to optimize the packaging line in a food manufacturing plant, resulting in a 15% increase in throughput.
- SCADA/HMI Development: I have experience designing and implementing HMIs that provide intuitive process monitoring and control. This includes creating custom dashboards and alarm management systems. I prefer using SCADA systems that support historical data logging and reporting features for performance analysis.
- Industrial Networking: I’m familiar with various industrial communication protocols such as Ethernet/IP, Profibus, and Modbus, which are essential for seamless data exchange between different automation components.
- Robotics Integration: I’ve worked on integrating robots into automated systems, programming their movements and coordinating their actions with other automation equipment. This often involves using robot-specific programming languages and interfaces.
My goal is always to leverage automation to create robust, reliable, and efficient processes.
Q 24. How do you ensure the accuracy and reliability of process data?
Data accuracy and reliability are paramount in process optimization. My approach is multi-faceted and involves both preventative measures and robust validation techniques.
- Calibration and Maintenance: Regular calibration of sensors and instruments is crucial. I implement scheduled maintenance programs to ensure the continued accuracy of measurement equipment. A well-maintained system minimizes the risk of faulty data.
- Data Validation: I use statistical process control (SPC) techniques to monitor data for inconsistencies and outliers. Control charts (e.g., Shewhart charts, CUSUM charts) are essential tools for detecting deviations from expected behavior. Any anomalous data points trigger investigations to identify and correct the root cause.
- Redundancy and Cross-Checking: Employing redundant sensors or using multiple measurement methods allows for cross-checking and verification of data. This enhances reliability, especially in critical process variables.
- Data Logging and Auditing: A comprehensive data logging system with appropriate security measures ensures data integrity and traceability. This is vital for compliance and troubleshooting.
By combining these strategies, I ensure that the data used for process optimization is accurate, reliable, and trustworthy, forming a solid foundation for informed decisions.
Q 25. Explain your understanding of feedback control loops.
Feedback control loops are the cornerstone of process automation. They involve continuously measuring a process variable, comparing it to a setpoint (desired value), and then adjusting a manipulated variable to minimize the error. Think of it like a thermostat: it measures the room temperature (process variable), compares it to the setpoint (desired temperature), and adjusts the heating/cooling system (manipulated variable) to maintain the desired temperature.
The most common type is a Proportional-Integral-Derivative (PID) controller. It uses three control actions:
- Proportional (P): The controller’s response is proportional to the error. A larger error leads to a larger corrective action.
- Integral (I): This action addresses persistent errors, eliminating offset by accumulating past errors. It ensures that the system reaches the setpoint even with constant disturbances.
- Derivative (D): This action anticipates future errors based on the rate of change of the error. It helps dampen oscillations and improves stability.
Tuning the PID controller is crucial for optimal performance. This involves adjusting the P, I, and D gains to achieve the desired balance between speed of response, stability, and minimal overshoot. I use various tuning methods, including Ziegler-Nichols and auto-tuning algorithms, to optimize the controller for specific processes.
Q 26. How do you handle conflicts between different stakeholders during process optimization?
Stakeholder conflicts are inevitable in process optimization projects. My approach involves proactive communication, collaborative problem-solving, and a data-driven approach to decision-making.
- Open Communication: I facilitate open communication channels among stakeholders, including production, engineering, maintenance, and management. This ensures everyone understands the goals, constraints, and potential impacts of the optimization project.
- Collaborative Workshops: I use workshops and meetings to identify and address conflicting priorities. These sessions involve brainstorming potential solutions and reaching consensus through constructive dialogue.
- Data-Driven Decision Making: I present data-backed evidence to justify recommendations, minimizing biases and subjective opinions. This ensures that decisions are based on objective facts and analysis.
- Prioritization and Trade-offs: Often, optimizing one aspect of a process may negatively affect another. I help stakeholders identify and prioritize key performance indicators (KPIs) and make informed trade-offs based on the overall business objectives.
- Conflict Resolution Techniques: I am familiar with various conflict resolution techniques, such as negotiation, mediation, and arbitration, to help navigate disagreements and find mutually acceptable solutions.
My experience shows that by prioritizing open communication and collaboration, we can transform conflicts into opportunities for improvement and build stronger relationships among stakeholders.
Q 27. Describe your experience with implementing process changes in a manufacturing environment.
I have significant experience implementing process changes in manufacturing environments, focusing on delivering tangible improvements in efficiency, quality, and safety. My approach is systematic and includes the following steps:
- Needs Assessment and Gap Analysis: The first step involves a thorough assessment of the current process, identifying bottlenecks and areas for improvement. This often involves data collection, process mapping, and benchmarking against industry best practices.
- Design and Simulation: Once improvement opportunities are identified, I design potential solutions, using simulation tools where appropriate, to predict the impact of proposed changes before implementation. This minimizes risks and allows for optimization before live implementation.
- Implementation Planning: A detailed implementation plan outlines tasks, timelines, resources, and responsibilities. This plan addresses potential challenges and mitigates risks associated with the changeover.
- Testing and Validation: After implementation, rigorous testing is crucial to validate that the changes achieve the desired results and meet quality standards. This may involve pilot runs or phased rollouts.
- Training and Support: Providing adequate training to operators and maintenance personnel is essential for the success of process changes. Ongoing support and troubleshooting are also necessary to address any unforeseen issues.
- Monitoring and Optimization: Post-implementation, continuous monitoring is required to ensure the process remains optimized and effective. Data analysis helps identify further opportunities for refinement and improvement.
In one project, I implemented a lean manufacturing approach in a packaging facility, leading to a 20% reduction in lead time and a 10% decrease in production costs.
Q 28. What are your salary expectations for this role?
My salary expectations are commensurate with my experience and skills in process optimization and control. Given my extensive background and proven track record of delivering significant improvements in manufacturing environments, I am seeking a salary range of [Insert Salary Range Here]. However, I am also open to discussing this further based on the specifics of the role and the overall compensation package.
Key Topics to Learn for Process Optimization and Control Interview
- Process Modeling and Simulation: Understanding different modeling techniques (e.g., statistical, dynamic) and their application in predicting process behavior. Consider practical examples like developing a simulation model for a manufacturing process to optimize throughput.
- Statistical Process Control (SPC): Mastering control charts (e.g., Shewhart, CUSUM) for monitoring process stability and identifying assignable causes of variation. Think about how SPC can be implemented to improve the quality of a product or service.
- Advanced Process Control (APC): Familiarize yourself with model predictive control (MPC), PID controllers, and their applications in optimizing complex industrial processes. Explore case studies demonstrating the benefits of implementing APC strategies.
- Optimization Algorithms: Gain a working knowledge of optimization techniques like linear programming, nonlinear programming, and evolutionary algorithms. Be prepared to discuss their strengths and weaknesses in various contexts.
- Process Data Analytics: Understanding how to extract insights from process data using statistical methods and data visualization tools. Practice interpreting data to identify areas for improvement and support decision-making.
- Lean Manufacturing Principles: Familiarize yourself with Lean methodologies like Kaizen, Value Stream Mapping, and 5S, and how they relate to process optimization and waste reduction. Be ready to discuss real-world examples of Lean implementation.
- Six Sigma Methodology: Understand the DMAIC (Define, Measure, Analyze, Improve, Control) cycle and its application in process improvement projects. Prepare to discuss your experience with Six Sigma tools and techniques.
Next Steps
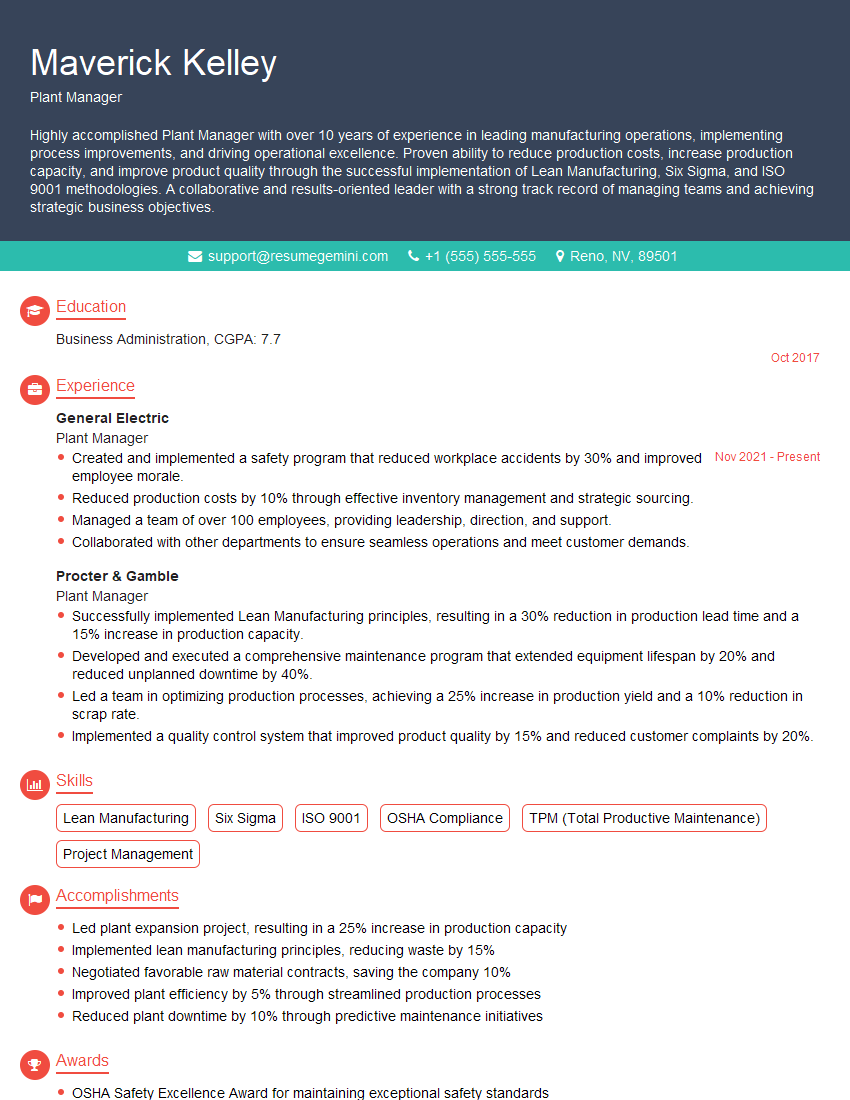
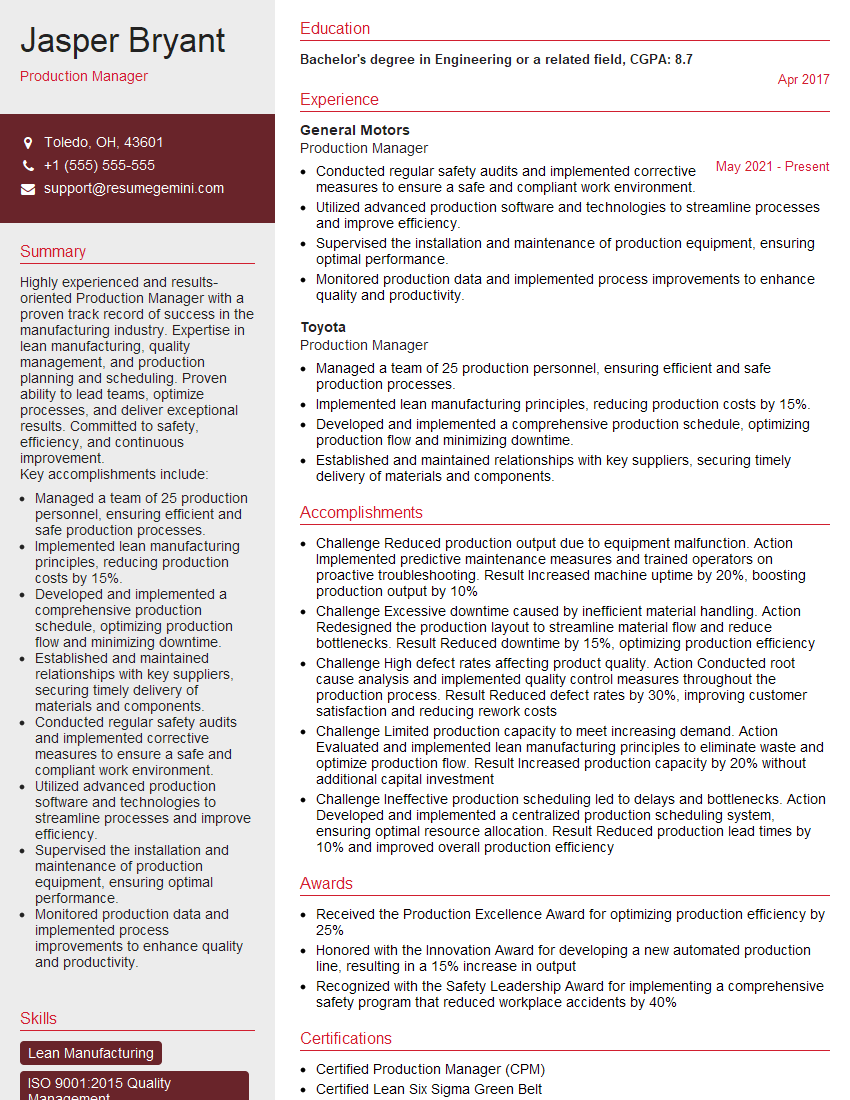
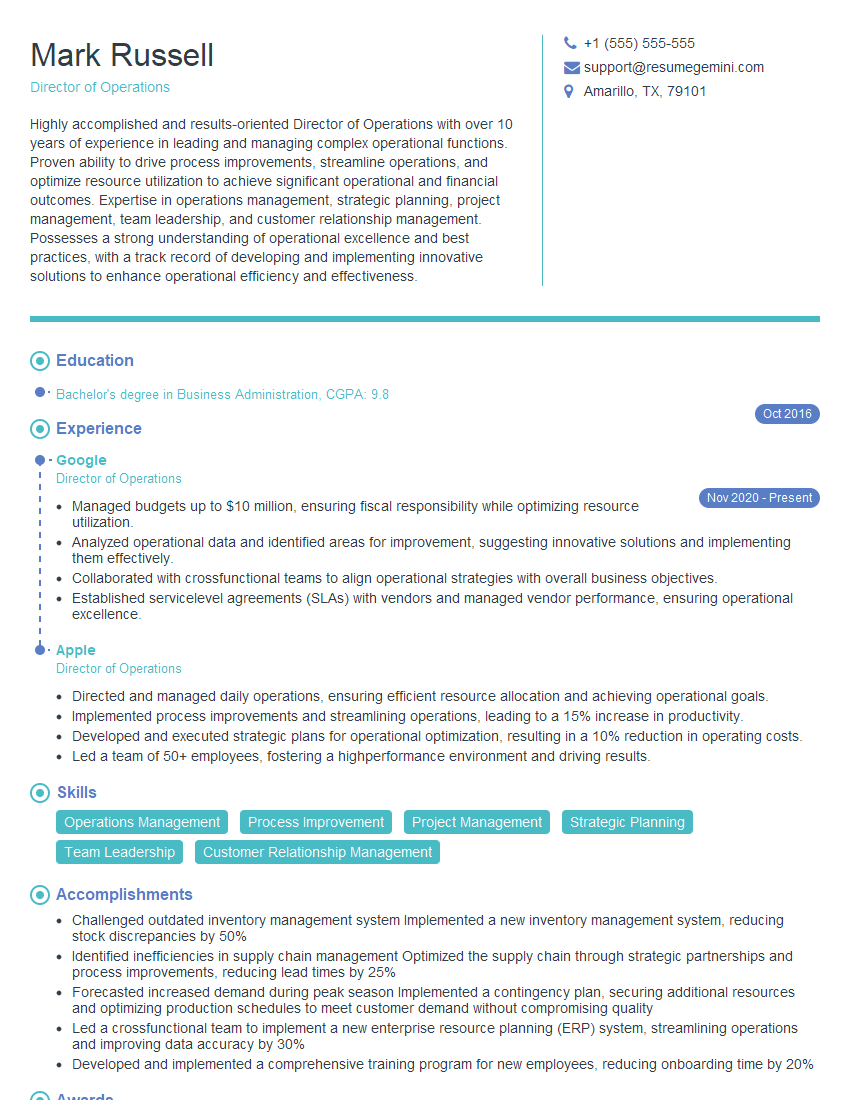
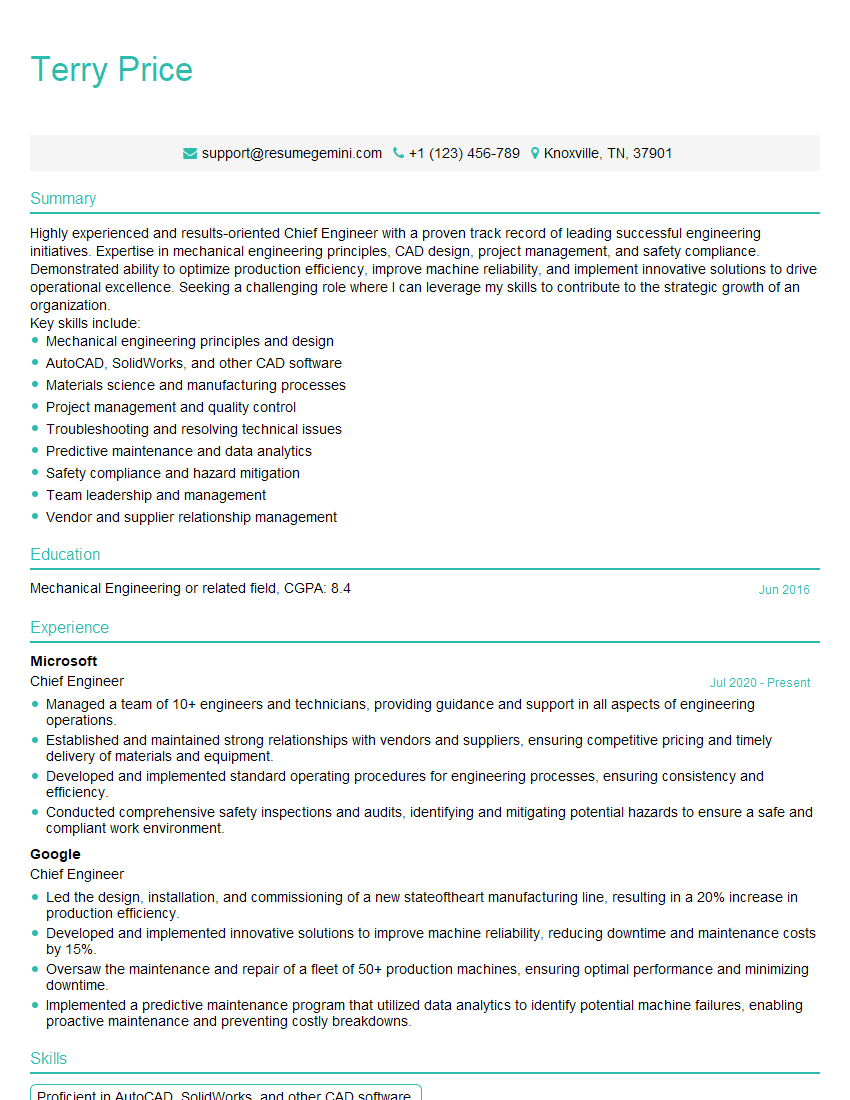
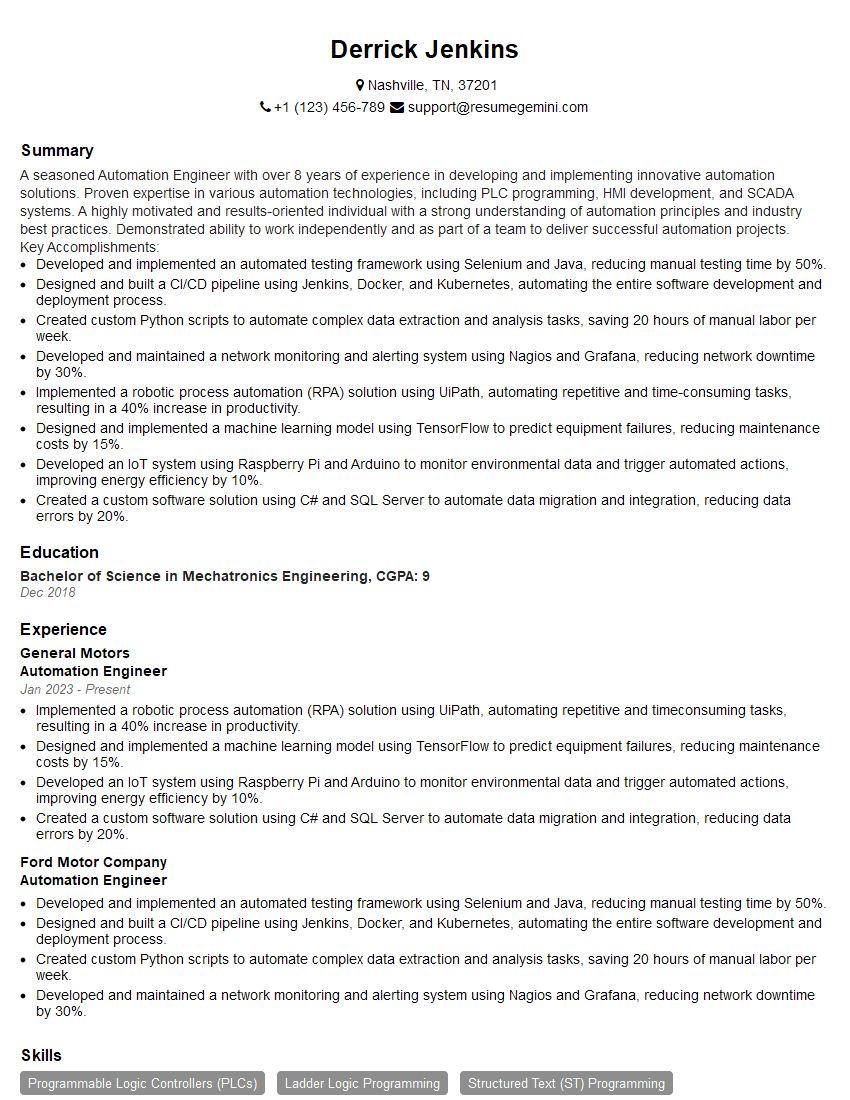
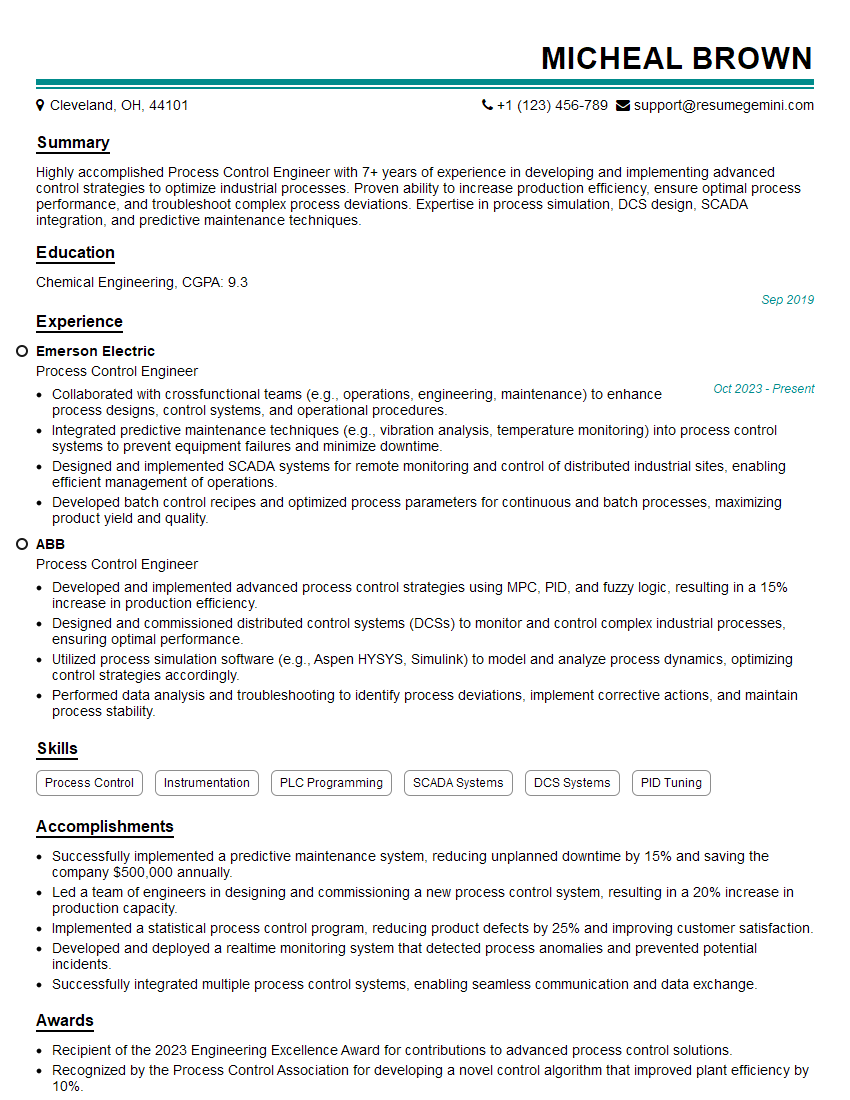
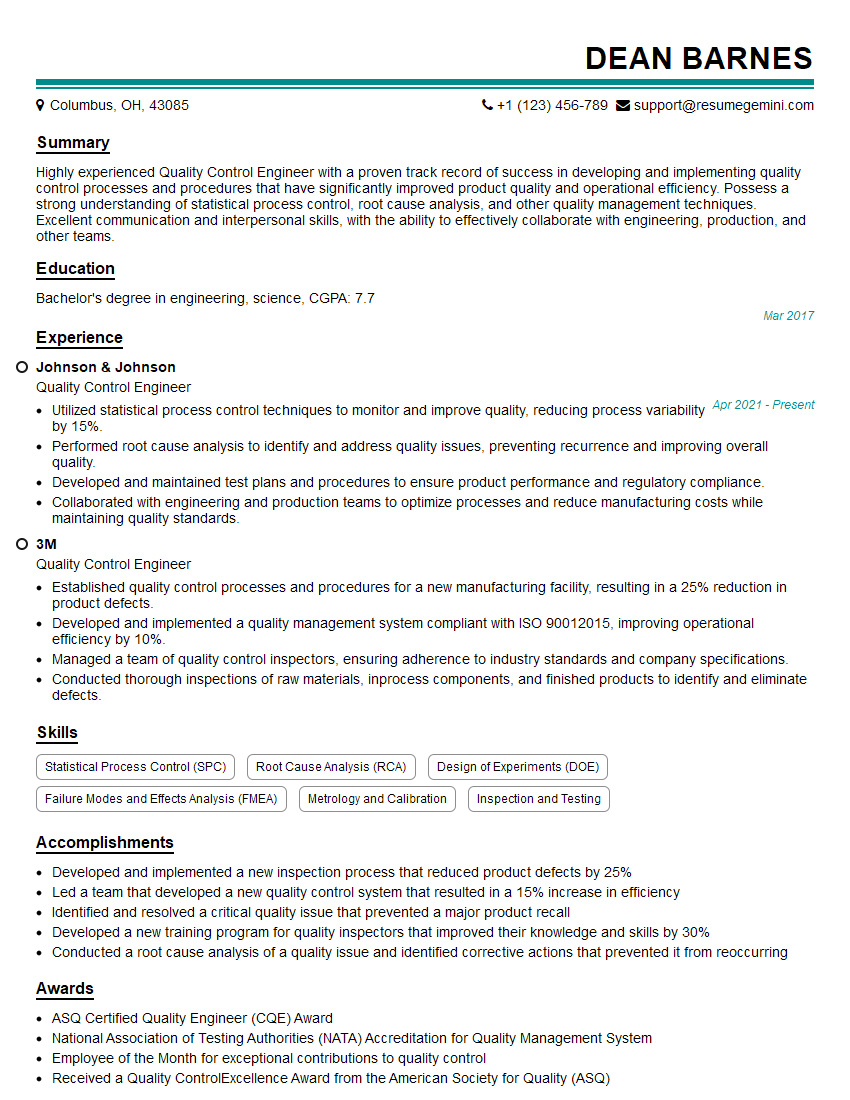
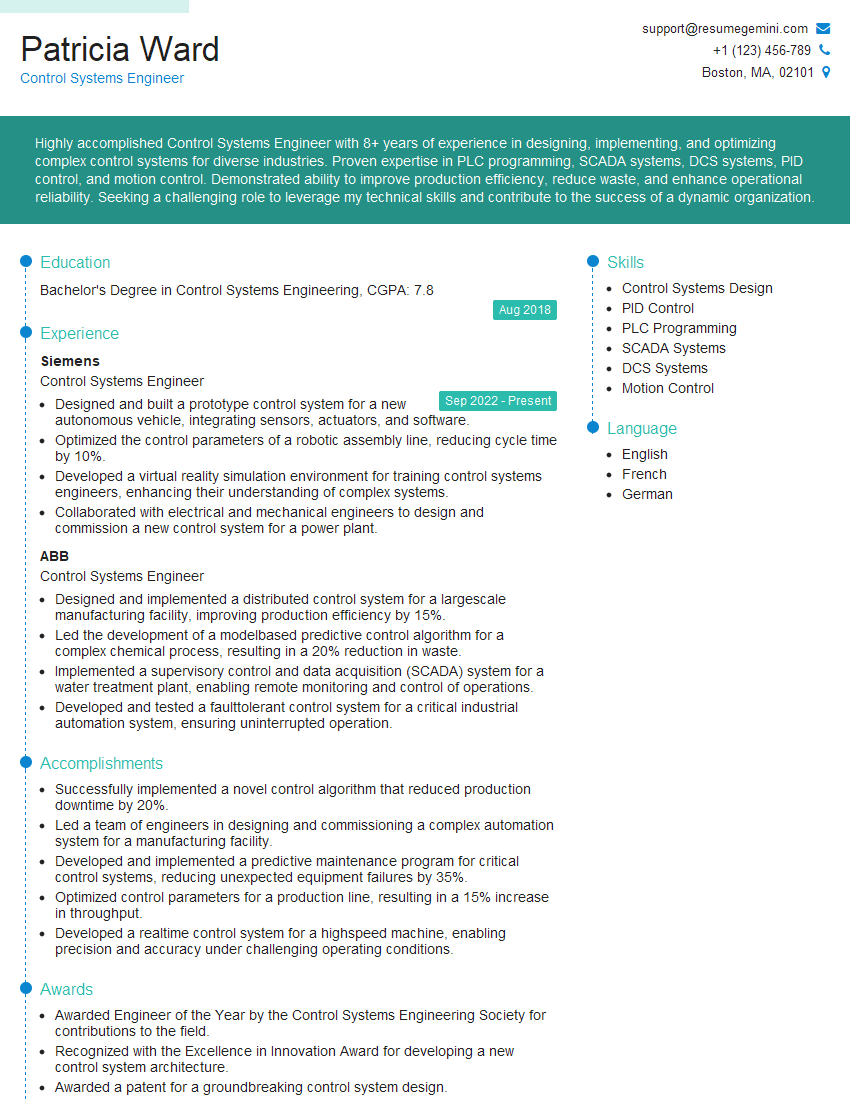
Mastering Process Optimization and Control opens doors to exciting and high-impact roles across various industries. Demonstrating your expertise effectively is key to landing your dream job. Building a strong, ATS-friendly resume is crucial for getting your application noticed by recruiters. To help you create a resume that showcases your skills and experience in the best possible light, we strongly recommend using ResumeGemini. ResumeGemini provides a user-friendly platform for crafting professional resumes, and we have included examples of resumes tailored to Process Optimization and Control to guide you. Take the next step towards your career advancement – build a compelling resume that highlights your capabilities and lands you that interview!
Explore more articles
Users Rating of Our Blogs
Share Your Experience
We value your feedback! Please rate our content and share your thoughts (optional).
What Readers Say About Our Blog
Hello,
We found issues with your domain’s email setup that may be sending your messages to spam or blocking them completely. InboxShield Mini shows you how to fix it in minutes — no tech skills required.
Scan your domain now for details: https://inboxshield-mini.com/
— Adam @ InboxShield Mini
Reply STOP to unsubscribe
Hi, are you owner of interviewgemini.com? What if I told you I could help you find extra time in your schedule, reconnect with leads you didn’t even realize you missed, and bring in more “I want to work with you” conversations, without increasing your ad spend or hiring a full-time employee?
All with a flexible, budget-friendly service that could easily pay for itself. Sounds good?
Would it be nice to jump on a quick 10-minute call so I can show you exactly how we make this work?
Best,
Hapei
Marketing Director
Hey, I know you’re the owner of interviewgemini.com. I’ll be quick.
Fundraising for your business is tough and time-consuming. We make it easier by guaranteeing two private investor meetings each month, for six months. No demos, no pitch events – just direct introductions to active investors matched to your startup.
If youR17;re raising, this could help you build real momentum. Want me to send more info?
Hi, I represent an SEO company that specialises in getting you AI citations and higher rankings on Google. I’d like to offer you a 100% free SEO audit for your website. Would you be interested?
Hi, I represent an SEO company that specialises in getting you AI citations and higher rankings on Google. I’d like to offer you a 100% free SEO audit for your website. Would you be interested?
good

