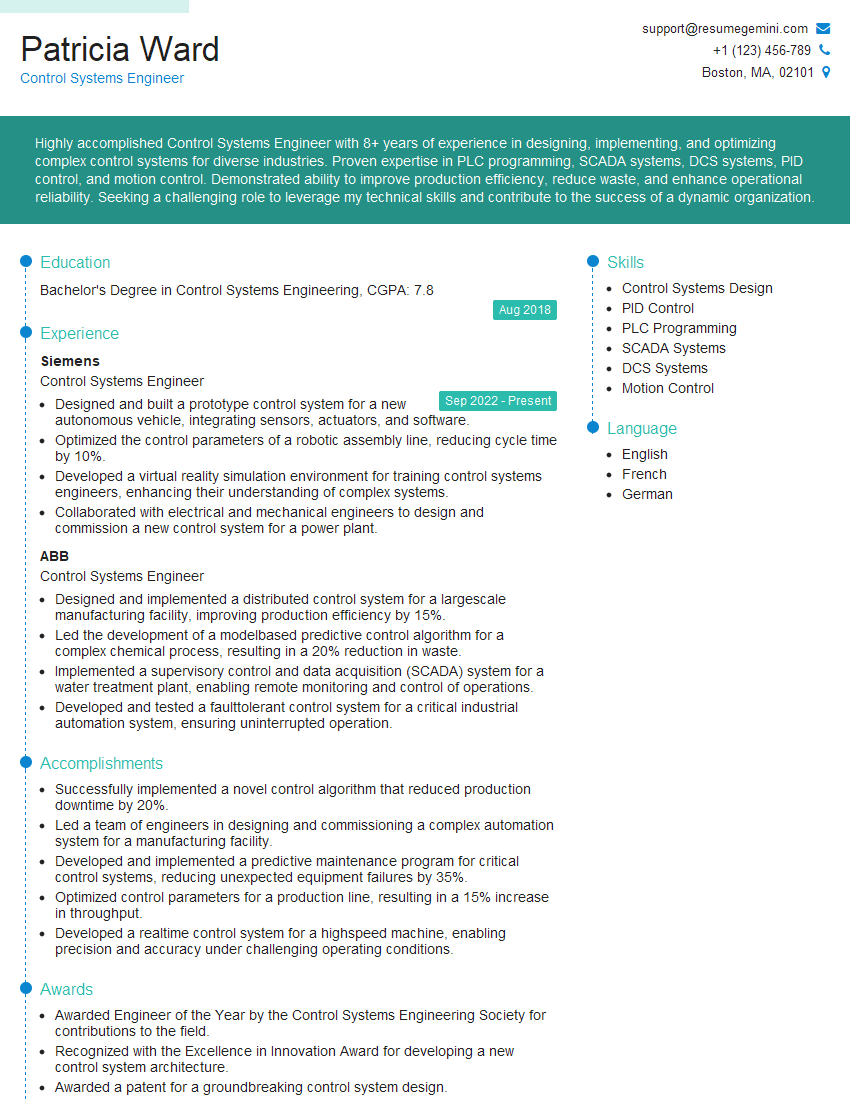
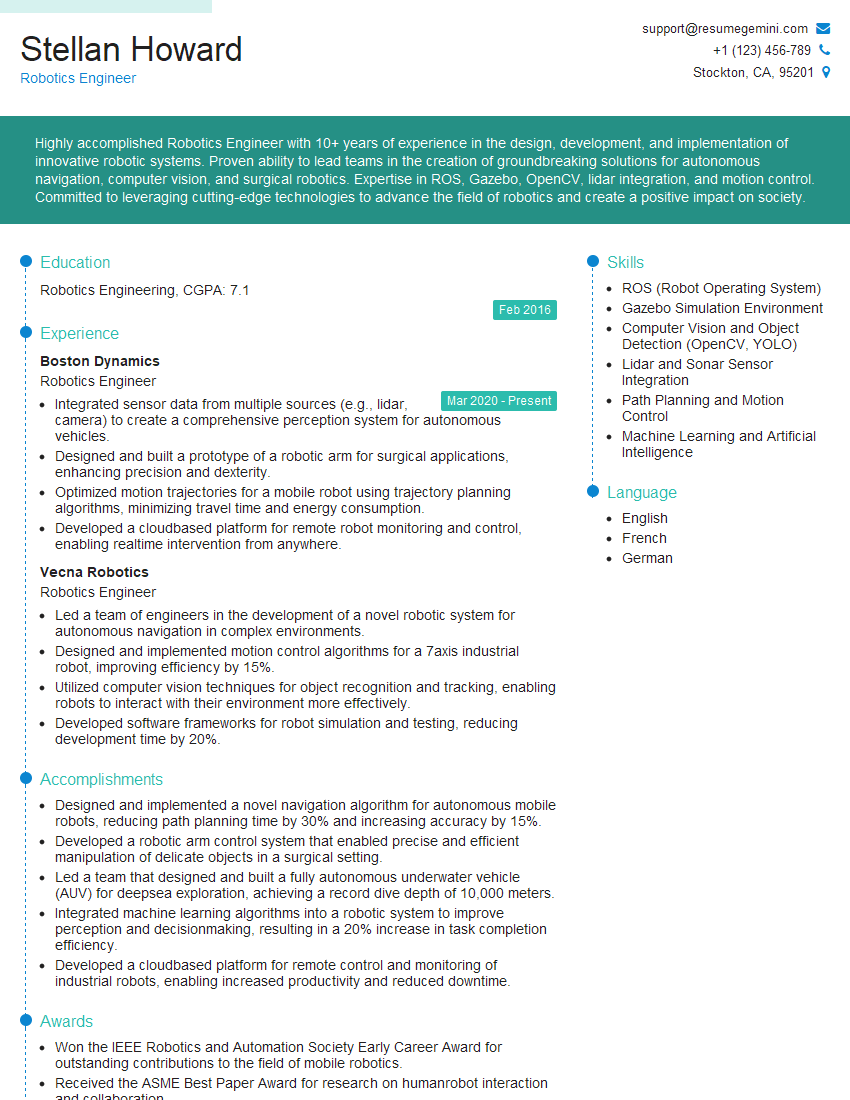
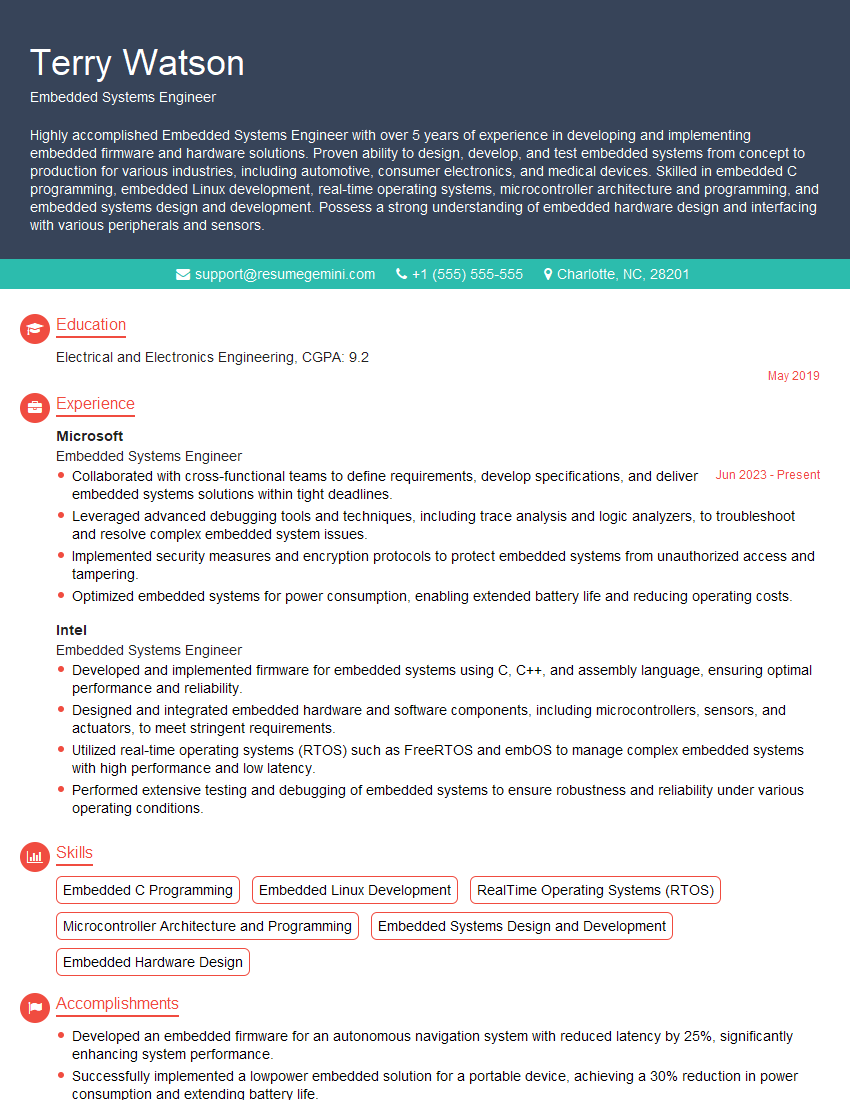
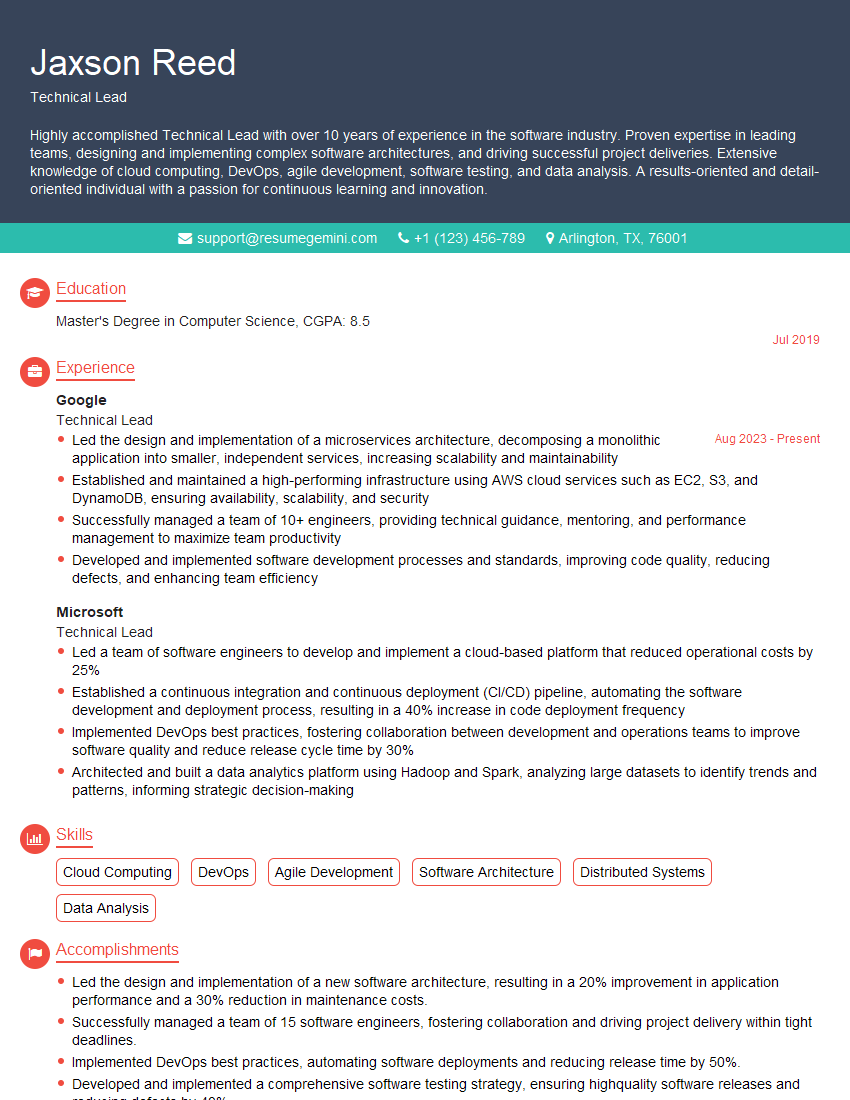
Unlock your full potential by mastering the most common Proficient in MATLAB, Python, and Simulink interview questions. This blog offers a deep dive into the critical topics, ensuring you’re not only prepared to answer but to excel. With these insights, you’ll approach your interview with clarity and confidence.
Questions Asked in Proficient in MATLAB, Python, and Simulink Interview
Q 1. Explain the difference between a script and a function in MATLAB.
In MATLAB, scripts and functions are both ways to write code, but they differ significantly in how they’re structured and used. Think of a script as a sequence of commands executed linearly, like a recipe. A function, on the other hand, is a self-contained block of code that performs a specific task and can accept inputs (arguments) and return outputs.
Scripts: Scripts are simple to create; you just write MATLAB commands in an .m file. They operate in the current workspace, directly modifying variables. This makes them useful for quick tasks or prototyping, but they can be harder to manage and reuse in larger projects. Imagine a script as a chef following a recipe directly on the countertop – ingredients (variables) are everywhere.
Functions: Functions are more structured. They have a defined input and output, operate within their own workspace (avoiding namespace conflicts), and promote code reusability. They are the building blocks of modular and well-organized programs. Imagine a function as a chef working in a designated kitchen area with specific ingredients provided – much more organized and efficient.
Example:
Script (myscript.m):
x = 10; y = 5; z = x + y; disp(z);Function (myfunction.m):
function result = myfunction(a, b) result = a + b; endThe function is clearly more reusable and less prone to errors caused by accidental variable overwriting.
Q 2. How do you handle large datasets in MATLAB?
Handling large datasets in MATLAB efficiently is crucial for performance. Strategies include using memory-mapped files, exploiting MATLAB’s built-in functions for parallel processing, and leveraging specialized toolboxes.
Memory-mapped files: Instead of loading the entire dataset into RAM, you map a portion of a file to memory. This allows you to work with the data as if it were in memory while minimizing memory usage. This is especially helpful for datasets exceeding available RAM.
Parallel Processing: MATLAB’s Parallel Computing Toolbox allows you to distribute computations across multiple cores, significantly reducing processing time for large datasets. You can use functions like parfor to parallelize loops.
Specialized Toolboxes: Toolboxes like the Big Data Toolbox offer specialized functions for efficient handling of exceptionally large datasets, often using techniques like distributed computing and data partitioning.
Example using memory mapping:
mapObj = memmapfile('mylargedata.txt', 'Writable', true); % map the file data = mapObj.Data(1:10000,:); % access a portion of the data % process data... delete(mapObj); % close the file mapRemember to always profile your code to identify performance bottlenecks and tailor your approach accordingly.
Q 3. Describe your experience with Simulink’s model-based design.
My experience with Simulink’s model-based design (MBD) spans various projects, from control system design to embedded system development. I’ve utilized MBD throughout the entire development lifecycle, starting with system requirements definition and progressing through simulation, testing, and code generation. I’m proficient in using Simulink to create complex hierarchical models, incorporating various blocks for different system components, implementing custom algorithms using embedded MATLAB functions, and integrating models with hardware-in-the-loop (HIL) simulations.
In one project, I used Simulink to model and simulate a complex robotic arm control system. This involved creating a detailed model of the robotic arm’s dynamics, designing the control algorithms in Simulink, and then using Simulink’s code generation capabilities to automatically generate C code for deployment on the embedded system controlling the robot. This MBD approach significantly reduced development time and improved the overall reliability of the system.
Q 4. What are the advantages of using Simulink for system simulation?
Simulink offers several advantages for system simulation:
- Visual Modeling: Simulink’s block diagram interface provides a highly intuitive and visual way to represent complex systems, making it easier to understand and modify models.
- Component-Based Design: The use of reusable blocks promotes modularity, making it easier to build and maintain large-scale models.
- Co-simulation: Simulink allows you to integrate models from different domains, enabling system-level simulations that account for interactions between various components.
- Automated Code Generation: Simulink can automatically generate optimized code (C, HDL, etc.) from your model, simplifying the deployment process.
- Extensive Toolboxes: Simulink offers specialized toolboxes for various applications, such as control systems, signal processing, and power systems.
- Verification and Validation: Simulink provides comprehensive tools for verifying and validating models, ensuring their accuracy and reliability.
These features contribute to quicker development cycles, reduced errors, and better overall system understanding.
Q 5. How do you debug a Simulink model?
Debugging a Simulink model involves a systematic approach leveraging Simulink’s debugging tools. The process often begins with identifying the symptoms of the problem in simulation results. Then, we isolate the problematic section of the model and employ various techniques:
- Data Inspection: Using probes and scopes to monitor signals at various points in the model allows for tracing signal values and identifying inconsistencies.
- Breakpoints and Step-by-Step Execution: Simulink’s debugger allows setting breakpoints to pause the simulation at specific points and step through the model execution, providing a detailed view of variable values and control flow.
- Simulation Diagnostics: Simulink’s diagnostic features help detect issues such as algebraic loops and solver errors.
- Signal Routing and Visualization: Simulink’s signal routing and visualization tools help in understanding how signals propagate through the model and identify potential issues.
- Model Advisor: This tool helps identify potential issues in the model, like errors, warnings, and suggestions for best practices.
Combining these techniques helps pinpoint the source of the bug, facilitating efficient model correction.
Q 6. Explain different types of Simulink blocks and their functionalities.
Simulink offers a vast library of blocks categorized by functionality. Some key categories and examples include:
- Sources: These blocks generate signals, such as constant values (
Constant), sine waves (Sine Wave), or random noise (Random Number). - Sinks: These blocks display or log simulation results, including scopes (
Scope), data displays (Display), and data loggers (To Workspace). - Mathematical Operations: Blocks for performing arithmetic operations (
Sum,Product), trigonometric functions (Sin,Cos), and other mathematical computations. - Logical Operations: Blocks for performing Boolean logic operations (
AND,OR,NOT). - Control Systems Blocks: Blocks for implementing control algorithms, such as PID controllers (
PID Controller), state-space models (State-Space), and transfer function blocks (Transfer Fcn). - Signal Processing Blocks: Blocks for filtering, transforming, and analyzing signals, including filters (
Filter), FFT blocks (FFT), and delay blocks (Unit Delay).
Beyond these fundamental blocks, Simulink offers specialized blocks for various application domains, adding to its versatility.
Q 7. How do you perform unit testing in Simulink?
Unit testing in Simulink involves verifying the behavior of individual blocks or subsystems in isolation. This ensures each component functions correctly before integrating them into a larger model. Effective techniques include:
- Test Harness: Create a test harness model that provides inputs to the block under test and compares the outputs to expected values. This usually involves using test cases based on expected behavior.
- Simulink Test: The Simulink Test framework provides tools to automate test case generation, execution, and reporting. This facilitates regression testing and ensures consistent functionality over time.
- Assertion Blocks: These blocks compare the output signals to expected values and report failures. This helps streamline the testing process and pinpoint errors.
- Code Coverage: After testing, analyzing code coverage provides insight into the effectiveness of testing, highlighting areas requiring more attention.
By implementing thorough unit tests, developers can identify and fix errors early in the development process, improving model quality and reducing integration issues.
Q 8. What are the different data types in Python used for scientific computing?
Python offers several crucial data types for scientific computing, each designed to handle different kinds of numerical and scientific data efficiently. Let’s explore the most important ones:
int(Integer): Represents whole numbers (e.g., 10, -5, 0). These are fundamental for counting, indexing, and many other operations.float(Floating-point): Represents numbers with decimal points (e.g., 3.14, -2.5, 0.0). Essential for representing real-world measurements and calculations where precision beyond whole numbers is needed.complex(Complex numbers): Represents numbers with a real and an imaginary part (e.g., 2 + 3j). Useful in fields like signal processing and quantum mechanics.bool(Boolean): Represents truth values, eitherTrueorFalse. Crucial for conditional logic and control flow.- NumPy’s
ndarray(N-dimensional array): This is arguably the most important data type for scientific computing in Python. NumPy arrays provide efficient storage and manipulation of numerical data in multi-dimensional formats (vectors, matrices, tensors, etc.). They are the foundation for many scientific computing libraries.
Think of it this way: int and float are like basic building blocks, while ndarray is a powerful container specifically designed for handling large collections of numbers in a highly optimized way. For example, if you’re dealing with a dataset of thousands of sensor readings, using a NumPy array would dramatically outperform using standard Python lists.
Q 9. Explain the concept of object-oriented programming in Python.
Object-oriented programming (OOP) is a programming paradigm that organizes code around “objects” rather than just functions and procedures. In Python, an object is an instance of a class. A class is a blueprint that defines the attributes (data) and methods (functions) that objects of that class will have. This modular approach improves code reusability, maintainability, and scalability.
Key OOP concepts in Python include:
- Classes: Blueprints for creating objects. Defined using the
classkeyword. - Objects: Instances of classes. Created by calling the class like a function.
- Attributes: Data associated with an object (variables within a class).
- Methods: Functions that operate on the object’s data (functions defined within a class).
- Inheritance: Creating new classes (child classes) based on existing classes (parent classes), inheriting their attributes and methods. This promotes code reuse and reduces redundancy.
- Polymorphism: The ability of objects of different classes to respond to the same method call in their own specific way. This allows for flexible and extensible code.
- Encapsulation: Bundling data and methods that operate on that data within a class, hiding internal details and protecting data integrity.
Example:
class Dog: def __init__(self, name, breed): self.name = name self.breed = breed def bark(self): print("Woof!") my_dog = Dog("Buddy", "Golden Retriever") print(my_dog.name) # Output: Buddy my_dog.bark() # Output: Woof!In a scientific computing context, OOP is invaluable for creating reusable components like data structures, algorithms, and simulation models. For example, you might create a class to represent a sensor, encapsulating its data acquisition and processing methods.
Q 10. How do you handle exceptions in Python?
Exception handling is crucial for writing robust Python code, especially in scientific computing where unexpected errors (like bad data or numerical instabilities) can easily occur. Python uses try...except blocks to gracefully handle exceptions.
The basic structure is:
try: # Code that might raise an exception result = 10 / 0 # This will raise a ZeroDivisionError except ZeroDivisionError: # Handle the specific exception print("Cannot divide by zero!") except Exception as e: # Handle other exceptions generally print(f"An error occurred: {e}") else: # Code to execute if no exception occurred print(f"Result: {result}") finally: # Code that always executes (cleanup actions) print("This always runs.")This example demonstrates how to catch specific exceptions (ZeroDivisionError) and generic exceptions (using the base Exception class). The else block executes only if no exception was raised, and the finally block is always executed for cleanup tasks, regardless of whether an exception occurred or not. This ensures that resources are properly released even if errors occur. In data analysis, this might involve closing files or releasing database connections.
Q 11. What are NumPy arrays and how are they used in scientific computing?
NumPy arrays are the cornerstone of numerical computation in Python. They are multi-dimensional arrays (similar to matrices or tensors) that provide efficient storage and manipulation of numerical data. Unlike standard Python lists, NumPy arrays are homogeneous – they contain elements of the same data type, leading to significant performance advantages.
Key advantages of NumPy arrays in scientific computing:
- Efficiency: NumPy arrays are implemented in C and Fortran, making them much faster than Python lists for numerical operations.
- Vectorized operations: NumPy allows performing operations on entire arrays at once, eliminating the need for explicit loops (vectorization). This significantly speeds up computations.
- Broadcasting: NumPy’s broadcasting rules allow performing operations between arrays of different shapes under certain conditions, simplifying code and improving efficiency.
- Linear algebra support: NumPy provides functions for linear algebra operations (matrix multiplication, eigenvalue decomposition, etc.), crucial for many scientific and engineering applications.
Example:
import numpy as np # Create a NumPy array arr = np.array([[1, 2, 3], [4, 5, 6]]) # Perform element-wise addition arr + 10 # Output: array([[11, 12, 13], [14, 15, 16]]) # Matrix multiplication arr @ arr.T # Output: array([[14, 32], [32, 77]])NumPy arrays are essential in image processing (representing images as arrays of pixel values), signal processing (representing signals as arrays of samples), and many other areas where large numerical datasets are involved.
Q 12. Describe your experience with Pandas for data manipulation.
Pandas is an incredibly powerful Python library for data manipulation and analysis. It provides data structures like Series (1-dimensional labeled arrays) and DataFrames (2-dimensional labeled data structures similar to tables) that are optimized for handling tabular data.
My experience with Pandas includes:
- Data loading and cleaning: Reading data from various formats (CSV, Excel, SQL databases, etc.) using
read_csv,read_excel, etc. and then cleaning the data by handling missing values, removing duplicates, and transforming data types. - Data manipulation: Filtering data based on conditions, sorting data, grouping data, applying functions to columns, merging and joining DataFrames, pivoting tables.
- Data aggregation and summarization: Calculating descriptive statistics (mean, median, standard deviation, etc.), creating cross-tabulations, using
groupbyfor aggregate calculations on groups of data. - Data wrangling: Reshaping and manipulating data to prepare it for analysis or visualization.
Example:
import pandas as pd # Create a DataFrame data = {'Name': ['Alice', 'Bob', 'Charlie'], 'Age': [25, 30, 28], 'City': ['New York', 'London', 'Paris']} df = pd.DataFrame(data) # Filter data for people older than 28 filtered_df = df[df['Age'] > 28] # Group data by city and calculate the average age grouped_df = df.groupby('City')['Age'].mean()In my previous roles, I used Pandas extensively for tasks like analyzing customer data, processing sensor readings, and preparing datasets for machine learning models. Its ability to handle large datasets efficiently and perform complex data manipulations with relative ease made it an invaluable tool.
Q 13. How do you use Matplotlib or Seaborn for data visualization?
Matplotlib and Seaborn are popular Python libraries for data visualization. Matplotlib provides a lower-level, more customizable approach to creating static, interactive, and animated visualizations in numerous formats. Seaborn builds on top of Matplotlib, providing a higher-level interface with a focus on statistical visualizations and aesthetically pleasing defaults.
My experience with these libraries encompasses:
- Creating various plot types: Scatter plots, line plots, bar charts, histograms, box plots, heatmaps, etc.
- Customizing plots: Adjusting labels, titles, colors, legends, axis limits, adding annotations, and creating subplots.
- Working with different data formats: Visualizing data from NumPy arrays, Pandas DataFrames, and other data structures.
- Generating publication-quality figures: Saving plots in various formats (PNG, JPG, PDF, SVG) with high resolution.
Example (Matplotlib):
import matplotlib.pyplot as plt import numpy as np x = np.linspace(0, 10, 100) y = np.sin(x) plt.plot(x, y) plt.xlabel("X-axis") plt.ylabel("Y-axis") plt.title("Sine Wave") plt.show()Example (Seaborn):
import seaborn as sns import matplotlib.pyplot as plt import pandas as pd # Assuming 'df' is a Pandas DataFrame with columns 'x' and 'y' sns.scatterplot(x='x', y='y', data=df) plt.show()These libraries are crucial for gaining insights from data. In my work, I’ve used them to visualize model performance, explore relationships between variables, and communicate findings effectively through clear and informative plots.
Q 14. What are your experiences with different machine learning libraries in Python (e.g., Scikit-learn)?
Scikit-learn is a widely used machine learning library in Python, providing a comprehensive set of tools for various machine learning tasks. My experience with Scikit-learn and other related libraries includes:
- Model selection and training: Using various algorithms like linear regression, logistic regression, support vector machines (SVMs), decision trees, random forests, and neural networks (through libraries like TensorFlow or Keras integrated with Scikit-learn).
- Model evaluation: Using metrics like accuracy, precision, recall, F1-score, AUC-ROC, and mean squared error to assess model performance. Employing techniques like cross-validation to obtain robust performance estimates.
- Model tuning: Using techniques like grid search and randomized search to optimize model hyperparameters.
- Feature engineering and selection: Creating new features from existing ones and selecting relevant features to improve model performance.
- Data preprocessing: Scaling, normalizing, and handling missing values in the data.
Example:
from sklearn.linear_model import LinearRegression from sklearn.model_selection import train_test_split # Assuming 'X' is the feature matrix and 'y' is the target variable X_train, X_test, y_train, y_test = train_test_split(X, y, test_size=0.2) model = LinearRegression() model.fit(X_train, y_train) # Predict on the test set and evaluate performance y_pred = model.predict(X_test) # ... (evaluate using appropriate metrics)Beyond Scikit-learn, I have experience with other libraries like TensorFlow/Keras for deep learning tasks and XGBoost for gradient boosting. The choice of library depends on the specific problem and the desired level of control over the model.
Q 15. Explain the concept of a Stateflow chart in Simulink.
Stateflow charts in Simulink are powerful tools for designing hierarchical state machines and control systems with complex logic. Think of them as a visual programming language built right into Simulink, allowing you to model systems that react to events and conditions. Instead of writing intricate conditional statements in code, you visually represent different states, transitions between states, and actions within those states.
A simple example would be modeling a traffic light. You would have states like ‘Red’, ‘Yellow’, ‘Green’, each with its own actions (e.g., turning on a specific light) and transitions (e.g., transitioning from Green to Yellow after a certain time). The transitions are triggered by events or conditions (e.g., a timer expiring).
Stateflow’s hierarchical nature allows for complex systems to be broken down into manageable sub-machines. For example, within the ‘Red’ state, you might have a sub-machine that handles pedestrian crossings. This modularity improves code readability and maintainability significantly, especially in large-scale projects. Stateflow’s ability to handle data and events effectively makes it perfect for modeling systems with complex timing and sequencing requirements.
Career Expert Tips:
- Ace those interviews! Prepare effectively by reviewing the Top 50 Most Common Interview Questions on ResumeGemini.
- Navigate your job search with confidence! Explore a wide range of Career Tips on ResumeGemini. Learn about common challenges and recommendations to overcome them.
- Craft the perfect resume! Master the Art of Resume Writing with ResumeGemini’s guide. Showcase your unique qualifications and achievements effectively.
- Don’t miss out on holiday savings! Build your dream resume with ResumeGemini’s ATS optimized templates.
Q 16. How do you integrate MATLAB with Python?
Integrating MATLAB and Python is straightforward, primarily using the MATLAB engine API for Python. This allows you to call MATLAB functions from within your Python scripts and vice-versa.
Imagine you have a computationally intensive image processing algorithm implemented in MATLAB, but your overall workflow is managed in Python. You can leverage the strengths of both: use Python for data handling and workflow orchestration and then call your optimized MATLAB function to perform the image processing.
Here’s a basic example. First, ensure the MATLAB engine is installed and accessible to Python. Then you can use a snippet like this:
import matlab.engine
engin = matlab.engine.start_matlab()
result = engin.myMATLABFunction(input_data) #myMATLABFunction is your MATLAB function
print(result)
engin.quit()
This code starts the MATLAB engine, calls a MATLAB function (‘myMATLABFunction’ in this case), receives the result, and then closes the engine. Error handling and more sophisticated data exchange would be added in a production environment. The flexibility and power of combined MATLAB and Python are excellent for large-scale projects that require both languages’ strengths.
Q 17. How do you use version control systems (e.g., Git) in your workflow?
Version control using Git is crucial to my workflow. I use it for virtually every project, both large and small. It allows me to track changes, collaborate effectively with others, and revert to previous versions if needed – vital for maintaining code integrity and preventing accidental overwrites.
My typical workflow involves creating a repository for each project, committing code regularly with descriptive commit messages, and pushing changes to a remote repository (like GitHub or GitLab). I use branching extensively. For example, I’ll create feature branches for new features or bug fixes, keeping my main branch stable and production-ready. Pull requests provide a mechanism for code review before merging changes into the main branch. This ensures code quality and helps catch potential issues early. I also utilize tools like GitKraken for a more visual interface making it simpler to handle complex branching strategies.
Q 18. Describe your experience with code optimization techniques in MATLAB or Python.
Code optimization is a critical skill in MATLAB and Python. In MATLAB, I often use the Profiler to pinpoint performance bottlenecks. Vectorization is crucial; replacing loops with vectorized operations dramatically improves speed. Pre-allocating arrays prevents dynamic memory allocation overhead. For example, instead of growing an array within a loop:
myarray = [];
for i = 1:1000
    myarray = [myarray, i];
end
I would pre-allocate:
myarray = zeros(1,1000);
for i = 1:1000
    myarray(i) = i;
end
In Python, using NumPy arrays instead of standard Python lists is key for numerical computations. List comprehensions can often replace slower loops. I also use Python’s built-in profiling tools (e.g., cProfile) and consider using more optimized libraries like SciPy when appropriate. Understanding data structures and algorithm complexity is essential for efficient code. In both languages, algorithmic changes can bring much larger performance gains than minor code tweaks.
Q 19. Explain the concept of signal processing using MATLAB.
MATLAB is a powerhouse for signal processing. Its rich toolbox provides functions for a broad range of tasks, including filtering, Fourier transforms, spectral analysis, and wavelet analysis. Imagine analyzing sensor data from an accelerometer. You could use MATLAB to filter out noise, extract features like frequency components, and then process these features for further analysis.
For example, you could use the fft function to compute the Fast Fourier Transform of a signal, revealing its frequency content. filter allows you to design and apply various types of filters (low-pass, high-pass, band-pass) to remove unwanted frequencies or isolate specific signal components. Wavelet transforms, implemented using the wavelet toolbox, are effective for analyzing signals with non-stationary properties.
MATLAB’s visualization capabilities are equally powerful, allowing you to easily plot and analyze signals in the time and frequency domains. This visual inspection is often crucial for understanding signal characteristics and validating the effectiveness of signal processing algorithms. The ease of using these functions and the built-in visualization makes MATLAB a highly efficient tool for signal processing tasks.
Q 20. How would you design a Simulink model for a PID controller?
Designing a Simulink model for a PID controller involves using the PID Controller block from the Simulink library. You’ll need blocks to represent the plant (the system you’re controlling), feedback, and the controller itself.
The process starts by defining the plant model. This could be a simple transfer function block, or a more complex model representing the dynamics of the system you are trying to control. Next, add the PID controller block. Adjust the proportional (Kp), integral (Ki), and derivative (Kd) gains to tune the controller. This is often done experimentally or through tuning methods. You’ll also need a feedback path, using a Sum block to calculate the error (difference between the setpoint and the actual output). Finally, visualize the controller’s performance using scopes to display the setpoint, output, and error signals. This allows for observing the system’s response to different setpoints and gain values to ensure optimal performance. The whole process emphasizes clear visualization and easy manipulation of parameters to effectively analyze control system performance.
Q 21. Describe your experience with different types of numerical integration methods.
My experience encompasses several numerical integration methods, each with its own strengths and weaknesses. Euler’s method is the simplest, but it’s often inaccurate, especially for larger step sizes. Higher-order methods like Runge-Kutta (various orders, such as RK4) provide better accuracy. Runge-Kutta methods are widely used due to their balance of accuracy and computational cost. They are particularly valuable for systems where accuracy is paramount, even if the computational load is higher than simpler methods.
For stiff systems (systems with widely varying time constants), implicit methods like Backward Euler or trapezoidal rule are often preferred. These methods are more stable but can be more computationally expensive. The choice of method often depends on the specific problem. For real-time applications, computational efficiency might take precedence, and a lower-order method might be acceptable. For high-accuracy simulations, a higher-order method like RK4 or even adaptive step-size methods (like Dormand-Prince) would be chosen. Simulink provides various integration solvers that offer the user different options depending on their needs. Understanding these trade-offs is essential for selecting the most appropriate numerical integration method for a given application.
Q 22. How do you handle memory management in MATLAB or Python for large simulations?
Memory management is crucial for large simulations, as they can easily consume vast amounts of RAM. In MATLAB, I leverage techniques like pre-allocating arrays using functions like zeros() or ones(). This prevents the array from repeatedly resizing during the simulation, significantly improving performance. For example, instead of growing an array within a loop, I initialize it to the maximum expected size beforehand: myData = zeros(100000,1);. In Python, I use NumPy arrays which are highly optimized for numerical computation and employ similar pre-allocation strategies. For extremely large datasets that exceed available RAM, I utilize techniques like memory mapping with libraries like mmap in Python or utilizing MATLAB’s ability to work with data stored on disk, minimizing the data loaded into memory at any given time. This allows for processing datasets that are significantly larger than the available RAM. Furthermore, I carefully consider data types to minimize memory footprint. Using single-precision floats (single in MATLAB, np.float32 in Python) instead of double-precision floats when appropriate can drastically reduce memory consumption without significantly impacting accuracy in many applications.
Q 23. Explain your experience with parallel computing in MATLAB or Python.
Parallel computing is essential for accelerating computationally intensive simulations. In MATLAB, I use the Parallel Computing Toolbox, employing functions like parfor (parallel for) loops to distribute iterations across multiple cores. For example, if I have a simulation that involves independently processing multiple time series, I can distribute each series to a different worker. This reduces the overall simulation time proportionally to the number of available cores. In Python, I utilize libraries like multiprocessing or joblib to achieve similar parallelisation. multiprocessing.Pool allows the creation of worker processes that run in parallel, performing tasks such as evaluating a function across multiple input values. For instance, I might distribute the calculation of individual elements in a large matrix across multiple cores. Furthermore, for specific types of problems that are suitable, I leverage vectorisation and NumPy’s broadcasted operations to improve performance instead of explicit looping. Choosing the right parallelisation strategy depends on the specific nature of the simulation and the architecture of the computing system; shared memory or distributed memory systems each have their own optimal methodologies.
Q 24. What are the benefits of using a model-based design approach?
Model-based design offers significant advantages throughout the entire development lifecycle. It centers around creating a virtual representation of the system being designed, enabling early testing and validation. Key benefits include:
- Early error detection: Identifying design flaws in the simulation stage significantly reduces costly rework during physical implementation.
- Improved collaboration: A visual model serves as a common language for engineers from different disciplines, facilitating better understanding and collaboration.
- Automated code generation: Simulink allows automated code generation for target platforms (e.g., embedded systems), streamlining the deployment process.
- Systematic testing: Simulink provides tools for creating test harnesses and automated testing procedures. This ensures comprehensive verification and validation of the design.
- Reduced development time and costs: By identifying and resolving issues early in the process, Model-based design reduces the overall development time and overall cost.
Q 25. How would you address a model instability in Simulink?
Model instability in Simulink often manifests as unbounded outputs or oscillations. Addressing this requires a systematic approach:
- Identify the source: Use Simulink’s debugging tools, such as the scope and data inspector, to pinpoint the problematic part of the model. Analyze input and output signals to identify unusual behavior.
- Analyze the system dynamics: Check for potential issues like improper gains, delays, or nonlinearities. Linearizing the model around an operating point can help identify instability through eigenvalue analysis.
- Adjust controller parameters: If the instability stems from a controller, adjust its parameters (e.g., proportional, integral, derivative gains) to improve stability. Consider using techniques like pole placement or LQR control.
- Add filtering or saturation: Introducing low-pass filters can mitigate high-frequency oscillations. Saturation blocks can limit outputs to prevent unbounded behavior.
- Check for numerical issues: Numerical issues can also lead to apparent instabilities. Ensure proper integration method and step size are used. Verify the model’s numerical properties.
Q 26. Describe your experience with real-time simulations in Simulink.
My experience with real-time simulations in Simulink involves developing models that interact with external hardware or sensors in real-time. This typically requires using Simulink Real-Time (xPC Target or similar). Key aspects include:
- Hardware configuration: Selecting and configuring the appropriate hardware (e.g., real-time target machine, I/O boards) is critical. This ensures sufficient processing power and appropriate interfaces for the application.
- Code generation and deployment: Generating and deploying the Simulink model to the real-time target requires careful attention to code efficiency and memory management. The generated code must meet real-time constraints.
- Data acquisition and logging: Setting up data acquisition from sensors and logging of system responses is vital for monitoring and analysis of the real-time simulation. These data can be used for model validation and refinement.
- Synchronization and timing: Accurate synchronization between the simulation and external hardware is critical. Careful consideration must be given to the sampling rates and timing characteristics of both the simulation and the physical hardware.
Q 27. How do you validate and verify your Simulink models?
Validation and verification (V&V) are crucial for ensuring the accuracy and reliability of Simulink models. I follow a structured approach incorporating various techniques:
- Model verification: This involves checking that the model correctly implements the intended design. This includes code reviews, static analysis, and unit testing of individual blocks and subsystems.
- Model validation: This involves checking that the model accurately represents the real-world system. This involves comparing simulation results with experimental data, analytical solutions, or other established models. This is usually done with various degrees of rigor, depending on the criticality of the model’s application.
- Requirement traceability: Linking model elements to system requirements ensures all requirements are addressed in the model.
- Testing: Using Simulink’s test harness capabilities, I create comprehensive test cases to cover a wide range of operating conditions and potential failures. This includes both unit and integration testing.
- Formal verification: For safety-critical applications, formal verification techniques, such as model checking, can be used to mathematically prove the model’s correctness.
Q 28. Explain your process for troubleshooting and debugging complex Simulink models.
Troubleshooting complex Simulink models requires a systematic and methodical approach. My process typically includes:
- Isolate the problem area: Use Simulink’s debugging tools, like the data inspector and probes, to narrow down the source of the error. Divide and conquer the model by disabling blocks to isolate the faulty section.
- Check signal values and data types: Inspect signal values at various points in the model to identify unexpected behavior or data type mismatches.
- Examine block parameters and configurations: Verify that all block parameters are correctly set. Pay close attention to numerical tolerances and integration methods.
- Use simulation diagnostics: Simulink provides tools to detect potential problems, such as algebraic loops or numerical stiffness.
- Employ logging and visualization tools: Implement extensive logging to capture relevant data, enabling retrospective analysis. Employ visualization techniques to understand the model’s behavior.
- Simplify the model: If the problem is difficult to trace, create a simplified version of the problematic section to make it easier to understand and debug.
- Leverage code generation: If the model is complex, generate code and use standard debugging techniques (like print statements, debuggers) to pinpoint issues.
Key Topics to Learn for Proficient in MATLAB, Python, and Simulink Interviews
- MATLAB:
- Matrix operations and linear algebra: Understand fundamental matrix manipulations and their applications in solving engineering problems.
- Data analysis and visualization: Master techniques for importing, cleaning, analyzing, and visually representing data using MATLAB’s plotting tools.
- Control systems design: Familiarize yourself with designing and simulating control systems using Simulink integration with MATLAB.
- Image and signal processing: Explore algorithms and techniques for manipulating and analyzing images and signals within the MATLAB environment.
- Python:
- NumPy and SciPy libraries: Gain proficiency in using these libraries for numerical computation and scientific computing tasks.
- Data structures and algorithms: Demonstrate understanding of efficient data structures and algorithms for solving complex problems.
- Object-oriented programming: Showcase your ability to design and implement robust and maintainable code using OOP principles.
- Data manipulation with Pandas: Learn how to efficiently process and analyze large datasets using the Pandas library.
- Simulink:
- Model building and simulation: Practice creating and simulating dynamic systems using Simulink’s block diagrams.
- Control system design and analysis: Understand how to design, simulate, and analyze various control strategies within Simulink.
- Stateflow: Explore the use of Stateflow for modeling and simulating hierarchical state machines.
- Simulink’s integration with MATLAB: Leverage the power of both platforms for comprehensive model development and analysis.
- General Problem-Solving:
- Algorithm design and complexity analysis: Be prepared to discuss the efficiency and scalability of your solutions.
- Debugging and troubleshooting: Practice identifying and resolving errors in your code efficiently.
- Software engineering best practices: Demonstrate knowledge of version control, testing, and documentation.
Next Steps
Mastering MATLAB, Python, and Simulink opens doors to exciting career opportunities in various engineering and scientific fields. To maximize your job prospects, crafting an ATS-friendly resume is crucial. ResumeGemini is a trusted resource to help you build a professional resume that highlights your skills effectively. Examples of resumes tailored to showcasing proficiency in MATLAB, Python, and Simulink are available to guide you. Invest the time to create a compelling resume – it’s your first impression!
Explore more articles
Users Rating of Our Blogs
Share Your Experience
We value your feedback! Please rate our content and share your thoughts (optional).
What Readers Say About Our Blog
Hello,
We found issues with your domain’s email setup that may be sending your messages to spam or blocking them completely. InboxShield Mini shows you how to fix it in minutes — no tech skills required.
Scan your domain now for details: https://inboxshield-mini.com/
— Adam @ InboxShield Mini
Reply STOP to unsubscribe
Hi, are you owner of interviewgemini.com? What if I told you I could help you find extra time in your schedule, reconnect with leads you didn’t even realize you missed, and bring in more “I want to work with you” conversations, without increasing your ad spend or hiring a full-time employee?
All with a flexible, budget-friendly service that could easily pay for itself. Sounds good?
Would it be nice to jump on a quick 10-minute call so I can show you exactly how we make this work?
Best,
Hapei
Marketing Director
Hey, I know you’re the owner of interviewgemini.com. I’ll be quick.
Fundraising for your business is tough and time-consuming. We make it easier by guaranteeing two private investor meetings each month, for six months. No demos, no pitch events – just direct introductions to active investors matched to your startup.
If youR17;re raising, this could help you build real momentum. Want me to send more info?
Hi, I represent an SEO company that specialises in getting you AI citations and higher rankings on Google. I’d like to offer you a 100% free SEO audit for your website. Would you be interested?
Hi, I represent an SEO company that specialises in getting you AI citations and higher rankings on Google. I’d like to offer you a 100% free SEO audit for your website. Would you be interested?
good
