Interviews are opportunities to demonstrate your expertise, and this guide is here to help you shine. Explore the essential Proficient with Microsoft Office Suite interview questions that employers frequently ask, paired with strategies for crafting responses that set you apart from the competition.
Questions Asked in Proficient with Microsoft Office Suite Interview
Q 1. Explain your experience using Microsoft Word’s mail merge feature.
Mail merge in Microsoft Word is a powerful tool that allows you to create personalized documents, such as letters, emails, or labels, from a single template. Instead of creating each document individually, you create a main document (the template) containing the unchanging parts and then connect it to a data source (like an Excel spreadsheet) holding the variable information. Word then automatically populates the template with data from each record in the data source, generating multiple personalized documents.
For example, I once used mail merge to generate personalized thank-you notes for over 200 clients. The main document contained a standard thank-you message, while an Excel spreadsheet held each client’s name, address, and specific details I wanted to mention. The mail merge function efficiently created 200 unique thank-you notes, saving me significant time and effort. I found the process intuitive, especially using the step-by-step wizard, which guided me through selecting the data source, matching fields, and previewing the results before generating the final documents. I also utilized the ability to insert conditional statements within the merge fields to customize the message even further based on data from the spreadsheet.
Q 2. How proficient are you with Excel formulas (e.g., VLOOKUP, SUMIF, AVERAGE)?
I’m highly proficient with Excel formulas, particularly those used for data manipulation, analysis, and reporting. VLOOKUP, SUMIF, and AVERAGE are fundamental functions I use regularly, but my expertise extends to more advanced formulas and array functions. Think of formulas as Excel’s superpowers – they let you automate calculations and extract meaningful insights from your data.
- VLOOKUP: This function is essential for looking up values in a table. For example, I used VLOOKUP to automatically populate a client’s address in an invoice based on their ID number stored in a separate spreadsheet. The syntax is
=VLOOKUP(lookup_value, table_array, col_index_num, [range_lookup]). - SUMIF: This function sums values based on a specified criterion. Suppose I needed to calculate the total sales for a specific product category, I would use SUMIF. The syntax is
=SUMIF(range, criteria, [sum_range]). - AVERAGE: A simple yet powerful function for calculating the average of a range of numbers. I constantly use this for calculating average order values, or average response times in analyzing data.
Beyond these, I’m comfortable with INDEX-MATCH (a more robust alternative to VLOOKUP), COUNTIFS, SUMIFS, and array formulas for complex calculations. My proficiency with these formulas has significantly improved my data analysis efficiency, allowing me to generate accurate and insightful reports quickly and efficiently.
Q 3. Describe your experience creating and formatting professional presentations in PowerPoint.
Creating and formatting professional presentations in PowerPoint is a crucial skill for effective communication. My approach focuses on delivering clear, concise messages using visually appealing designs. I pay close attention to visual hierarchy, using fonts, colors, and imagery strategically. Think of a presentation as a story; it needs a beginning, middle, and end, and each slide should build upon the previous one.
I’ve designed presentations for various audiences, from executive briefings to training sessions. For example, I recently created a presentation for a new product launch. It involved creating engaging visuals, animations, and transitions to maintain the audience’s attention. I ensured the presentation was consistent in style and branding, using the company’s design guidelines meticulously. I incorporated charts and graphs to effectively present data, ensuring clarity and accessibility to the audience. Moreover, I always consider the context – tailoring the tone, language, and visuals to best resonate with the intended audience.
I’m also proficient in using PowerPoint’s advanced features, such as custom animations, transitions, and master slides to create a professional and consistent look and feel across the presentation.
Q 4. How would you troubleshoot a slow-performing Excel spreadsheet?
A slow-performing Excel spreadsheet can be incredibly frustrating. Troubleshooting involves a systematic approach. My strategy typically starts with identifying the bottleneck. Is it the sheer size of the data, complex formulas, or excessive formatting?
- Check for excessive formulas: Complex or inefficient formulas, especially those recalculating unnecessarily, can dramatically slow down performance. Try simplifying formulas, replacing volatile functions (like OFFSET or INDIRECT) where possible with their non-volatile counterparts.
- Reduce unnecessary formatting: Excessive cell formatting (like conditional formatting applied to vast ranges) can also cause slowdowns. Optimize conditional formatting, use simpler formats, or remove formatting where unnecessary.
- Data size and organization: Huge datasets make Excel sluggish. Consider data filtering or using Power Query to import and process only necessary data before loading into the worksheet. Removing unused columns or rows can make a significant difference.
- Manual Calculation Mode: Switching to manual calculation mode (Formulas > Calculation Options > Manual) can prevent automatic recalculation every time data changes. Calculate the spreadsheet manually (F9 key) only when necessary.
- Background Processes: Ensure no unnecessary background applications are running and using computer resources.
- External Data Connections: Slow connections to external data sources can delay calculations. Ensure those connections are efficient and data is refreshed only when necessary.
By systematically tackling these potential causes, I’ve successfully improved the performance of many slow-performing Excel spreadsheets, often resulting in significant speed improvements.
Q 5. What are your preferred methods for organizing and managing large datasets in Excel?
Managing large datasets in Excel effectively requires a structured approach. My preferred methods involve combining Excel’s built-in features with best practices for data organization and manipulation.
- Data Validation: Enforce data consistency by applying data validation rules to ensure data integrity and uniformity.
- Data Tables: Use Excel tables to improve data organization. Tables automatically generate structured references, which make it easy to manipulate and reference data across multiple ranges.
- Named Ranges: Assign meaningful names to data ranges (Formulas > Name Manager). This improves readability and helps prevent errors in formulas.
- Filtering and Sorting: Employ filtering and sorting to easily find specific data and analyze subsets of the data.
- Power Query (Get & Transform Data): For extremely large datasets, use Power Query to import, clean, and transform the data before loading it into the worksheet. Power Query allows powerful data manipulation capabilities without affecting the source file, making it exceptionally efficient for large data sets.
- Multiple Worksheets: Organize data into logical sheets instead of cramming it into one massive sheet.
This approach allows for cleaner data, simpler formulas, and improved performance in Excel. It’s about creating a structured environment that is easier to understand and maintain, even with vast amounts of information.
Q 6. How familiar are you with Excel’s pivot tables and their applications?
PivotTables are one of Excel’s most powerful data analysis tools. They allow you to summarize, analyze, explore, and present your data in a highly interactive way. Think of them as dynamic summaries that you can easily adjust based on your analytical needs.
I have extensive experience using PivotTables to analyze sales data, customer demographics, project timelines, and more. For instance, I used a PivotTable to analyze sales trends over time, drilling down to specific product categories and regions. This allowed me to quickly identify top-performing products and areas needing attention. I’m comfortable with all aspects of PivotTables, including creating them from various data sources, manipulating fields, adding calculated fields, and creating charts directly from the PivotTable. The ability to filter, group, and summarize data interactively within a PivotTable provides invaluable insight into complex datasets, making it a cornerstone of my data analysis workflow.
The key advantage of PivotTables lies in their flexibility. You can quickly change the way the data is summarized or presented without altering the underlying data – a significant time saver and a powerful tool for exploratory data analysis.
Q 7. Describe your experience using Microsoft Access databases.
I have experience designing, developing, and querying Microsoft Access databases. Access is a relational database management system (RDBMS) which allows for organized data storage and efficient data retrieval. I understand database design principles, including normalization, and the importance of creating well-structured tables with appropriate data types and relationships. This ensures data integrity and efficient querying.
In a previous role, I developed an Access database to manage customer information, sales transactions, and inventory. I designed the database schema, created tables, defined relationships, and developed forms and reports for user interaction and data reporting. I also created queries to retrieve specific data subsets and implemented data validation rules to maintain the quality and consistency of data. My expertise extends to using SQL queries for complex data retrieval and manipulation. I found Access to be a powerful tool, particularly for managing smaller to medium-sized datasets that do not require the scalability of a larger enterprise-level database system. The ease of creating forms and reports directly within Access makes it a very user-friendly solution for many applications.
Q 8. How would you create a chart or graph in Excel to visualize data effectively?
Creating effective charts and graphs in Excel is crucial for data visualization and communication. The process involves selecting the right chart type for your data and then formatting it for clarity.
First, you need to select your data range. Then, navigate to the ‘Insert’ tab and choose the appropriate chart type from the available options (column, bar, line, pie, scatter, etc.). The choice depends on what you want to emphasize: column charts are great for comparing categories, line charts show trends over time, and pie charts display proportions.
Let’s say you have sales data for different months. A column chart would perfectly illustrate the sales performance for each month. After inserting the chart, you can customize it further. This includes adding a title, axis labels, legends, and changing the chart colors and styles to make it visually appealing and easy to understand. You can also add data labels to each data point for precise values. For instance, adding data labels to a column chart would make it clear exactly how many sales were made in each month.
Beyond basic formatting, Excel offers advanced charting capabilities like creating combination charts (combining different chart types in one), using secondary axes for different scales, and adding trend lines to highlight patterns. Mastering these features allows for comprehensive and insightful data representation. For example, you might combine a column chart showing sales with a line chart showing profit margins, both using the same x-axis (time). This would allow a viewer to see the relationship between sales and profits visually.
Q 9. Explain your understanding of conditional formatting in Excel.
Conditional formatting in Excel is a powerful tool that allows you to dynamically format cells based on their values or other criteria. It’s like giving your spreadsheet superpowers – changing colors, adding icons, or highlighting specific cells to draw attention to key data points.
Imagine you’re reviewing a sales report. You could use conditional formatting to highlight cells with sales figures exceeding a target value (say, $10,000) in green, while sales below target are highlighted in red. This instantly makes it easy to identify top and underperforming areas.
To apply conditional formatting, select the cells you want to format, go to the ‘Home’ tab, and click ‘Conditional Formatting’. You’ll find various options, including:
- Highlight Cells Rules: Highlight cells that meet specific criteria, like above or below average, between two values, duplicates, etc.
- Top/Bottom Rules: Highlight the top or bottom N percent or number of values.
- Data Bars: Visually represent values with colored bars within cells.
- Color Scales: Apply a range of colors based on the values in the cells.
- Icon Sets: Display icons representing different value ranges.
Conditional formatting saves you time by automatically formatting cells without manual intervention. You can even create custom rules using formulas for complex formatting needs. For example, you could highlight cells based on a formula comparing two columns, perhaps comparing this year’s sales to last year’s to show which products have seen the most substantial growth.
Q 10. How do you ensure data accuracy and integrity when working with spreadsheets?
Data accuracy and integrity are paramount when working with spreadsheets. Several strategies ensure this:
- Data Validation: Restrict data entry to specific types (numbers, dates, text) and ranges. This prevents incorrect data from being entered in the first place. For instance, you could set up data validation to only accept numbers between 0 and 100 for a percentage field.
- Formulas and Calculations: Use formulas to automatically calculate values, minimizing manual entry errors and inconsistencies. For instance, rather than manually adding up a column of numbers, use the
SUM()function. - Data Source Verification: Ensure that the original data source is reliable and accurate. Check the source for errors, missing values, and inconsistent formatting before importing it into Excel.
- Regular Audits: Periodically review your spreadsheets for errors or inconsistencies. Use tools like Excel’s ‘Find and Replace’ feature to identify and correct potential issues. Cross-check data with other sources to confirm accuracy.
- Version Control: Maintain multiple versions of your spreadsheet, naming them clearly (e.g., ‘Report_v1’, ‘Report_v2’). This makes it easy to revert to previous versions if errors are detected. Use tools like Microsoft 365’s cloud storage and version history to manage this effectively.
- Data Cleansing: Identify and correct inconsistencies and errors in the existing data. This may involve using functions to find and replace errors or removing duplicates.
By employing these measures, I build robust and trustworthy spreadsheets that can be relied upon for critical decision-making.
Q 11. Describe your experience working with macros in Excel or Word.
I have extensive experience with macros in both Excel and Word, using them to automate repetitive tasks and increase efficiency. Macros are essentially mini-programs that run within the Office applications, executing a series of actions with a single command.
In Excel, I’ve used macros to automate report generation, data cleaning processes, and the formatting of complex spreadsheets. For example, I developed a macro that automatically formats financial reports, including applying conditional formatting, adding charts, and adding headers and footers. This macro saved considerable time and ensured consistency in report formatting.
In Word, I’ve utilized macros to streamline document creation and editing. I created a macro to automate the process of creating standard letters and memos, pre-filling information like addresses and salutations based on a template. It saved hours of manual labor every month. I am proficient in VBA (Visual Basic for Applications), the programming language used to create these macros.
Beyond simple automation, I’ve used macros for more advanced functions, such as interacting with external data sources, handling user input, and creating interactive documents. The key is to clearly define the process, write and test the code thoroughly, and document the macro for future use and maintainability.
Q 12. How do you manage multiple versions of a document in Microsoft Word?
Managing multiple versions of a Word document is crucial to track changes and prevent accidental overwrites. My approach combines best practices for file naming and version control:
- Descriptive File Names: I use a consistent naming convention including the version number (e.g., ‘ProjectProposal_v1.docx’, ‘ProjectProposal_v2.docx’).
- Cloud Storage: Utilizing cloud storage like OneDrive or SharePoint is vital. It allows for easy collaboration and provides version history, showing past edits and allowing you to revert to previous versions if needed.
- Track Changes: In Word, I actively use the ‘Track Changes’ feature during collaborative editing. This shows all edits made by different users, making reviewing and merging changes much simpler.
- Comments: To provide detailed context for changes, I use comments to explain the reasons for particular alterations.
- Version Control Software (Optional): For complex projects with multiple contributors, using dedicated version control software like Git (though not directly integrated with Word) could enhance collaboration and change management significantly. This would usually involve checking the document into a repository and tracking changes outside of Word.
By systematically managing versions, I ensure everyone is working with the most up-to-date information, maintain a clear record of changes, and can easily revert to previous versions if required.
Q 13. Explain your experience using Microsoft Outlook for email management and calendar scheduling.
I’m highly proficient in using Microsoft Outlook for email management and calendar scheduling. My approach focuses on organization and efficiency:
- Effective Folder Structure: I create a well-organized folder structure for emails, categorizing them by project, client, or topic. This helps me quickly locate specific emails when needed.
- Rules and Filters: I use Outlook rules to automatically sort incoming emails into appropriate folders, reducing manual sorting and improving inbox management. For example, a rule might automatically sort emails from a specific client into their respective folder.
- Calendar Management: I use the calendar for scheduling meetings, appointments, and deadlines. I set reminders to ensure I don’t miss important events. I also utilize color-coding to differentiate various types of appointments or meetings.
- Categories: I leverage categories to further classify emails and calendar events. This enables quick filtering and searching based on specific categories.
- Tasks: I use the task feature to track action items, setting due dates and reminders to keep projects on schedule.
This methodical approach ensures my inbox and calendar remain organized, enhancing my productivity and preventing me from being overwhelmed with information.
Q 14. How familiar are you with using templates in Microsoft Office applications?
I’m very familiar with using templates in Microsoft Office applications. Templates are pre-designed documents or spreadsheets that provide a structure and style for new documents, saving significant time and ensuring consistency.
In Word, I frequently use templates for creating standard letters, reports, resumes, and other documents. This consistency in formatting enhances professionalism and saves time. For example, I might have a template for creating client proposals which ensures all proposals have a consistent look and feel, including formatting for logos, headers, and footers.
In Excel, I use templates to create consistent spreadsheets for tracking budgets, projects, or other data. This ensures all spreadsheets use the same format and formulas. This makes it easier to compare data across multiple spreadsheets and reduces potential errors resulting from inconsistent formatting.
I also know how to create and customize my own templates, tailoring them to specific needs. This includes adding custom styles, macros, and even conditional formatting to automate tasks and make the templates even more efficient. By modifying existing templates or creating new ones, I can further streamline my workflow and ensure consistency across my documents.
Q 15. How do you use formatting tools in Word to create professional-looking documents?
Creating professional-looking documents in Word hinges on effectively using its formatting tools. Think of these tools as your design palette, allowing you to control the visual appeal and readability of your text. It’s about more than just bolding and italicizing; it’s about consistency and a polished final product.
Styles: Instead of manually formatting each heading and paragraph, using built-in or custom styles ensures consistency throughout the document. Imagine building a house – styles are like pre-fabricated components; they save time and ensure uniformity. For example, applying the ‘Heading 1’ style to all your main headings will automatically format them with a specific font, size, and spacing.
Paragraph Formatting: Control line spacing, indentation, alignment (left, center, right, justified), and bullet/numbered lists to enhance readability. Think of this as the furniture arrangement in your document; proper spacing and alignment make it inviting and easy to navigate.
Font Selection: Choose fonts that are easy to read and appropriate for the document’s purpose. Avoid using too many different fonts, as this can look cluttered. A serif font (like Times New Roman) is often preferred for body text, while a sans-serif font (like Arial) might be better for headings.
Tables and Images: Use tables to organize data neatly and images to visually break up text and add interest. Ensure that tables and images are appropriately sized and positioned within the document. Remember to add captions to images for clarity.
Headers and Footers: Use headers and footers to include page numbers, document titles, or company logos, creating a professional touch. This adds a level of sophistication, providing crucial information consistently across pages.
For instance, I recently created a marketing proposal for a client. By using consistent styles for headings, carefully choosing fonts, and strategically placing images, I was able to produce a document that was not only informative but also visually appealing and easy to understand, leading to a successful presentation and securing the project.
Career Expert Tips:
- Ace those interviews! Prepare effectively by reviewing the Top 50 Most Common Interview Questions on ResumeGemini.
- Navigate your job search with confidence! Explore a wide range of Career Tips on ResumeGemini. Learn about common challenges and recommendations to overcome them.
- Craft the perfect resume! Master the Art of Resume Writing with ResumeGemini’s guide. Showcase your unique qualifications and achievements effectively.
- Don’t miss out on holiday savings! Build your dream resume with ResumeGemini’s ATS optimized templates.
Q 16. Describe your experience with data validation in Excel.
Data validation in Excel is a crucial tool for ensuring data accuracy and integrity. It’s like setting up a quality control checkpoint for your spreadsheet. It prevents users from entering incorrect or inappropriate data, saving time and effort in data cleaning and error correction later.
My experience involves using various validation rules such as:
Data Type Validation: Restricting cells to accept only numbers, text, dates, or specific formats. This is essential for columns representing things like order numbers (numbers only) or customer names (text only).
List Validation: Allowing users to select data from a predefined list (e.g., drop-down menus). This guarantees consistency and reduces typing errors. Imagine a column for ‘Order Status’; a drop-down list with options like ‘Pending,’ ‘Processing,’ ‘Shipped,’ and ‘Completed’ ensures uniform data entry.
Custom Validation: Setting specific criteria using formulas to define acceptable values. For example, I once created a validation rule that ensured a ‘Discount Percentage’ column only accepted values between 0% and 25%. This prevents accidental entry of impossible discounts.
Input Message and Error Alert: Providing clear instructions and error messages to guide users and prevent incorrect data entry. This user-friendly approach significantly reduces mistakes.
I frequently use data validation when working with large datasets, financial models, and any situation where data accuracy is paramount. It’s an invaluable tool for ensuring the reliability of my Excel workbooks.
Q 17. How would you create a complex formula in Excel to solve a specific business problem?
Creating complex Excel formulas often involves combining multiple functions to solve intricate business problems. The key is breaking down the problem into smaller, manageable parts. Let’s say you need to calculate the total commission earned by sales representatives based on their sales performance and tiered commission rates.
Here’s how you might approach this with a complex formula:
Assume:
- Column A: Sales Representative Name
- Column B: Sales Amount
- Column C: Commission Rate (based on tiers)
The commission structure is as follows:
- Sales < $10,000: 5%
- $10,000 – $50,000: 10%
- Sales > $50,000: 15%
The formula in Column D (Total Commission) could be:
=IF(B2<10000,B2*0.05,IF(B2<=50000,B2*0.1,B2*0.15))This nested IF statement checks the sales amount (B2) against the tiered thresholds and applies the corresponding commission rate. It's a simple example, but you can extend this logic to include more complex scenarios using functions like SUMIF, VLOOKUP, INDEX, MATCH, and others depending on the specific needs.
In a recent project, I developed a complex formula to automate the calculation of employee bonuses based on various performance metrics (sales, customer satisfaction, and project completion). This saved significant time and reduced the risk of manual calculation errors.
Q 18. How proficient are you in using different chart types in Excel?
I'm highly proficient in using various chart types in Excel to visualize data effectively. The choice of chart type depends on the type of data and the message I want to convey. Think of charts as storytelling tools; each type tells a story in a different way.
Column Charts and Bar Charts: Excellent for comparing different categories or showing trends over time. Great for showing sales figures across different regions or product performance over months.
Line Charts: Ideal for displaying trends and changes over time, particularly useful for showing data that evolves continuously, like stock prices or website traffic.
Pie Charts: Effective for showing the proportion of parts to a whole, ideal when demonstrating market share or budget allocation.
Scatter Charts: Show the relationship between two variables, helpful for identifying correlations. This can show how advertising spend affects sales.
Area Charts: Similar to line charts, but they also fill the area under the line, emphasizing the magnitude of change over time.
Combo Charts: Combine different chart types to show multiple data sets simultaneously, offering a richer perspective. I use this frequently to show sales alongside profit margins.
For instance, I recently used a combo chart to display both sales revenue and customer acquisition cost over time, allowing stakeholders to easily understand the relationship between these key metrics and make informed business decisions. Selecting the correct chart type is crucial for conveying insights effectively and influencing decisions.
Q 19. How would you protect sensitive data in a Microsoft Office document?
Protecting sensitive data in Microsoft Office documents is critical. My approach involves multiple layers of security to ensure confidentiality and prevent unauthorized access.
Password Protection: This is a fundamental step. I use strong, unique passwords to restrict access to documents and workbooks, ensuring only authorized personnel can open or modify the files.
Restrict Editing: For collaborative work, I use the 'Restrict Editing' feature to control which parts of a document can be modified, protecting essential information while allowing others to contribute to specific sections.
Digital Rights Management (DRM): For extremely sensitive data, I consider using DRM to control access and usage rights, limiting printing, copying, and forwarding of documents. This is an added layer of security for highly confidential information.
Data Encryption: For extra security, especially when sharing files electronically, I might encrypt the files using tools like BitLocker or third-party encryption software. This ensures that even if the file is intercepted, the data remains inaccessible without the decryption key.
Secure Storage: I always store sensitive documents in secure locations, such as encrypted cloud storage or on password-protected network drives. This prevents physical theft or unauthorized access.
In a recent project involving client financial data, I employed a combination of password protection, restricted editing, and secure cloud storage to safeguard the confidentiality of the information. A multi-layered approach is key to comprehensive data protection.
Q 20. Describe your experience with collaborative editing features in Microsoft Office applications.
I have extensive experience with collaborative editing features in Microsoft Office applications. These tools have revolutionized teamwork, allowing simultaneous work on documents, spreadsheets, and presentations. It’s like a virtual whiteboard session, but with version control.
Co-authoring: I regularly use the real-time co-authoring capabilities of Word, Excel, and PowerPoint. Multiple users can work on the same document simultaneously, seeing each other's changes in real time. This streamlines the review and editing process, eliminating the need for email exchanges and multiple versions.
Version History: This feature is invaluable for tracking changes and reverting to previous versions if necessary. It's a safety net, allowing us to undo unintended alterations or go back to earlier drafts. This is especially important for crucial documents where accuracy is paramount.
Comment Features: I utilize comment features extensively to provide feedback, ask questions, and discuss changes within the document. This keeps all communication centralized, improving clarity and efficiency. It's like having an integrated discussion forum within the document itself.
Change Tracking: For formal review processes, I often use change tracking to highlight all modifications made to a document. This enables a detailed review and approval process, providing a clear audit trail of all revisions.
For example, in a recent team project, we used co-authoring and comment features to collaboratively draft a marketing report. The real-time collaboration dramatically shortened the project timeline and improved the final product's quality.
Q 21. How would you handle a corrupted Microsoft Office file?
Handling a corrupted Microsoft Office file requires a systematic approach. The first step is to identify the extent of the corruption and choose the appropriate recovery method.
Try Opening in Safe Mode: Starting the Office application in Safe Mode can sometimes resolve minor corruption issues. This disables add-ins that might be causing conflicts.
AutoRecover Feature: Check the 'AutoRecover' feature within the application’s settings. This feature automatically saves temporary versions of your work at regular intervals, potentially rescuing a recent version of your file.
Previous Versions: If the file is stored on a device with version history enabled (like OneDrive or Windows), try restoring a previous version of the file from the version history.
Office Repair Tool: If the above methods fail, I'd run the Microsoft Office repair tool to address potential application-level issues that might be contributing to file corruption.
Third-Party Repair Tools: As a last resort, I might use third-party file repair tools designed to recover data from corrupted Office files, but I'd exercise caution when choosing these.
Data Recovery Software: In extreme cases, where the file is severely damaged, data recovery software might be necessary to try and extract some or all of the content.
I once dealt with a severely corrupted Excel file containing crucial financial data. After trying the standard recovery methods, I used a reputable data recovery tool, successfully extracting most of the data. Always backup your important files regularly to mitigate the impact of such situations.
Q 22. Explain your experience using the 'Find and Replace' function in Word.
The Find and Replace function in Microsoft Word is a powerful tool for editing documents efficiently. It allows you to locate specific text or formatting and replace it with something else, saving considerable time and effort compared to manual searching and editing.
For example, imagine you're editing a lengthy report and need to change every instance of "Client X" to "Acme Corporation." Instead of manually searching and replacing each occurrence, you can use Find and Replace. This is done by navigating to the 'Home' tab, then clicking 'Replace' (or pressing Ctrl+H). In the 'Find what' field, you type "Client X", and in the 'Replace with' field, you type "Acme Corporation." Then, you can choose to replace all instances at once or replace them one by one, carefully reviewing each change.
The function is also incredibly versatile. You can use wildcards to find variations of text (e.g., finding all words starting with "pre" using "pre*" ), replace specific formatting like bold text or font size, and even find and replace special characters.
I've used this extensively in projects ranging from proofreading legal documents, ensuring consistency in marketing materials, and even updating large datasets within Word tables. The speed and accuracy it offers are invaluable.
Q 23. Describe your experience with creating and managing tables in Word and Excel.
Creating and managing tables is a crucial skill in both Word and Excel. In Word, tables are excellent for organizing data within a document, whether it’s a simple comparison chart or a complex report layout. I’ve frequently used Word tables to create visually appealing reports, presentations, and even forms, leveraging features like merging cells, inserting rows and columns, and applying different styles to make the tables clear and professional. I use Excel for more complex data management and analysis. Here tables are fundamental. They allow me to organize and structure my data, perform calculations using formulas, and create charts and graphs for data visualization. I am proficient in using features like sorting, filtering, data validation, and conditional formatting within Excel tables to efficiently manage and analyze data sets of varying sizes.
For instance, I once used Excel to manage a project budget, creating a table with columns for project phases, estimated costs, actual costs, and variances. This allowed for easy tracking and analysis of the financial aspects of the project. In another example, I used Word tables to create a visually compelling comparison of different software solutions, making it easy for the stakeholders to understand the strengths and weaknesses of each option. I understand the importance of choosing the right tool for the task – Word tables for visual presentation within a document and Excel tables for data manipulation and analysis.
Q 24. How would you automate a repetitive task using macros or VBA in Excel?
Automating repetitive tasks in Excel using Visual Basic for Applications (VBA) or macros significantly boosts efficiency and reduces the likelihood of errors. Essentially, a macro records your actions and then plays them back when needed. VBA is a more powerful programming language within Excel that allows you to create more complex and customizable automations.
Let’s say you have a large dataset requiring regular formatting updates (like converting all dates to a specific format or adding column headers). Instead of doing this manually each time, you can create a macro that automatically applies these formatting changes. This saves time and ensures consistency.
Sub FormatDates()
  Dim cell As Range
  For Each cell In Range("A1:A1000")
     If IsDate(cell.Value) Then
        cell.NumberFormat = "mm/dd/yyyy"
     End If
  Next cell
End Sub
This simple VBA code iterates through a range of cells and formats any dates it finds. I’ve utilized VBA for more complex tasks, such as automatically generating reports, importing data from external sources, and performing complex calculations across large spreadsheets. The key is to break down a repetitive task into smaller, manageable steps that can be coded efficiently.
Q 25. What are your preferred methods for sharing and collaborating on Microsoft Office documents?
Sharing and collaborating on Microsoft Office documents effectively is crucial in today's collaborative work environment. My preferred methods leverage the features built into Microsoft's ecosystem. For sharing, I commonly use OneDrive, SharePoint, or email attachments, depending on the project's requirements and security needs. OneDrive offers easy cloud storage and sharing, allowing for real-time co-authoring capabilities. SharePoint is often used within a corporate context for centralized document management and control, with robust version history and permission settings.
For collaboration, co-authoring features within Word, Excel, and PowerPoint are invaluable. These allow multiple users to work on the same document simultaneously, with changes being reflected in real-time. This eliminates version control issues and fosters a seamless collaborative experience. I also use the commenting feature extensively for feedback and suggestions, ensuring that all contributions are tracked and addressed effectively. Beyond the core applications, I utilize Microsoft Teams to facilitate project discussions and file sharing, further enriching the collaborative workflow.
Q 26. Describe your experience using Microsoft OneNote for note-taking and organization.
Microsoft OneNote is a powerful tool for note-taking and organization that I use extensively. It allows for flexible note-taking, incorporating text, images, audio, and even video within a single note. Its hierarchical structure allows for the creation of notebooks, sections, and pages, making it simple to organize information related to different projects or topics. I appreciate OneNote's ability to seamlessly integrate with other Office applications. I can easily clip web pages, embed Excel spreadsheets, or insert Word documents directly into my notes, creating a centralized repository of all relevant information.
For example, during a project, I might create a notebook dedicated to that project. Within that notebook, I'd have sections for meeting minutes, project tasks, research materials, and contact information. This makes it very easy to stay organized and access information rapidly. The search function in OneNote is especially useful for quickly finding specific information within my extensive note collection. OneNote’s flexibility and integration make it an indispensable tool for managing both professional and personal information.
Q 27. How familiar are you with Microsoft Teams and its collaborative features?
I'm highly familiar with Microsoft Teams and its collaborative features. It serves as a central hub for communication and collaboration within my team. I utilize its chat functionality for quick questions and updates, its meeting capabilities for virtual team meetings and presentations, and its file-sharing functionality for project documents. I find the ability to create channels dedicated to specific projects or topics within Teams incredibly helpful for organizing conversations and related files. The integration with other Microsoft Office applications is seamless, enabling me to share and co-author documents directly within Teams.
For instance, we frequently use Teams channels for project brainstorming, sharing feedback on drafts, and coordinating tasks. The ability to tag team members in chats and comments ensures that important updates are brought to everyone's attention promptly. Teams has significantly streamlined our team’s communication and collaboration, increasing productivity and improving our ability to work effectively both in the office and remotely.
Q 28. How would you create a professional-looking business letter in Microsoft Word?
Creating a professional-looking business letter in Word requires attention to detail and the utilization of Word's formatting tools. I typically start by using a pre-designed business letter template to ensure a consistent and professional look. However, even without a template, Word’s features make it easy to create a polished letter. I begin by setting up the page margins appropriately, usually 1 inch on all sides. Then, I carefully structure the letter, including the sender’s address, date, recipient’s address, salutation, body, closing, and signature.
I use Word’s formatting features to apply professional fonts like Times New Roman or Calibri, typically in a size 12 for readability. I ensure consistent line spacing, often 1.5, and utilize paragraph formatting for appropriate indentation and alignment. The letterhead, if applicable, adds a professional touch. Finally, I always proofread carefully before sending, checking for grammar and spelling errors. Word's spell check and grammar check features are essential parts of this process. A well-formatted business letter makes a strong positive impression and demonstrates professionalism and attention to detail.
Key Topics to Learn for Proficient with Microsoft Office Suite Interview
- Word Processing (Microsoft Word): Mastering document formatting, styles, tables, mail merge, and advanced features like track changes and collaboration tools. Consider practical applications like creating professional reports, proposals, and letters.
- Spreadsheet Software (Microsoft Excel): Develop expertise in data entry, formulas, functions (VLOOKUP, SUMIF, etc.), charting, pivot tables, and data analysis techniques. Practice creating insightful dashboards and presentations from complex datasets.
- Presentation Software (Microsoft PowerPoint): Learn to design engaging and informative presentations, utilizing effective visuals, transitions, animations, and speaker notes. Practice structuring presentations for different audiences and purposes.
- Data Management (Microsoft Access): Understand database design principles, creating and managing tables, queries, forms, and reports. Practice retrieving and analyzing data efficiently using different query methods.
- Collaboration & Sharing: Familiarize yourself with cloud-based features, real-time co-authoring, and sharing documents securely across different platforms. This highlights your ability to work effectively in team environments.
- Problem-Solving & Troubleshooting: Practice identifying and resolving common issues within each application. Be prepared to discuss your approach to troubleshooting and problem-solving in a professional context.
Next Steps
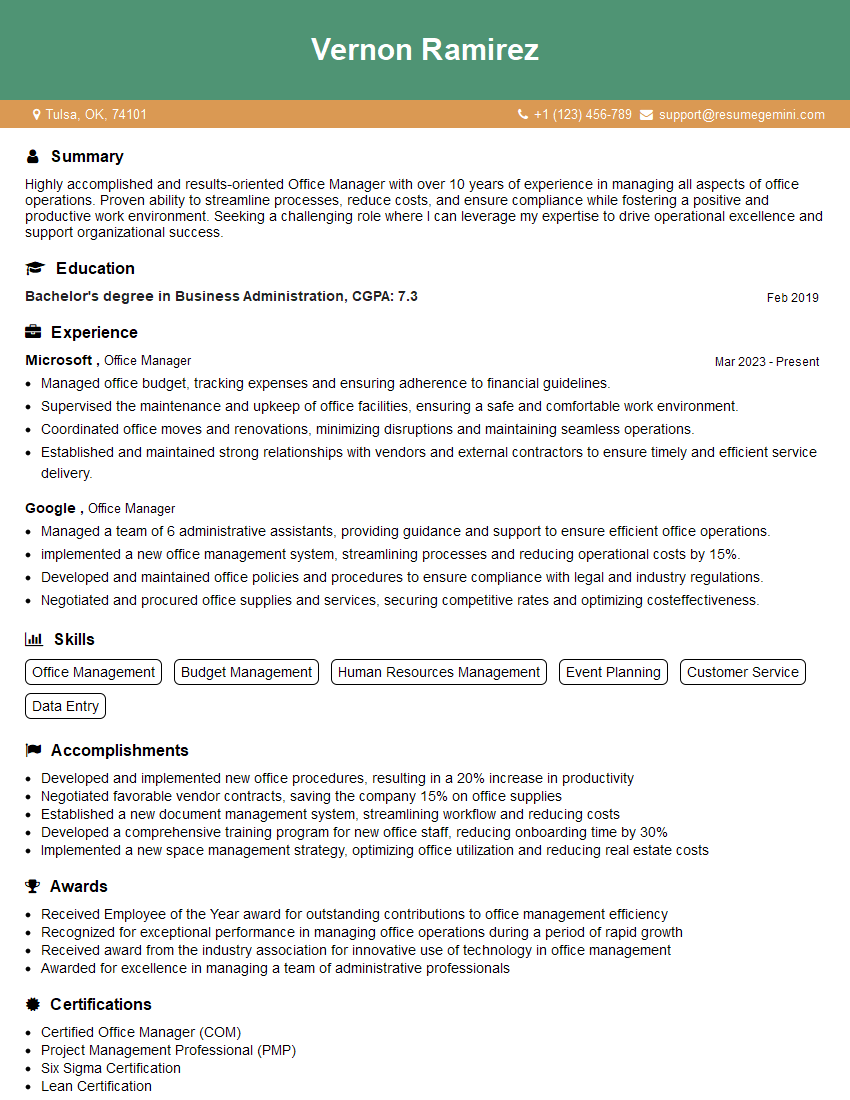
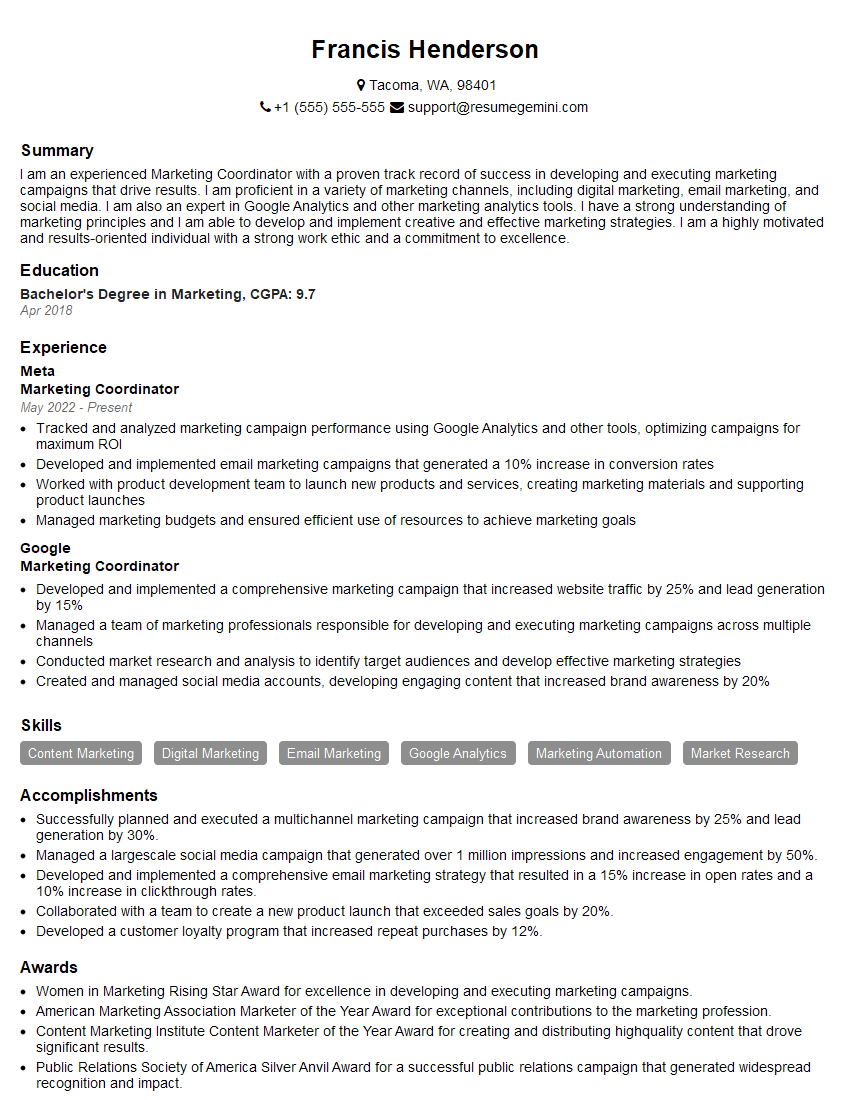
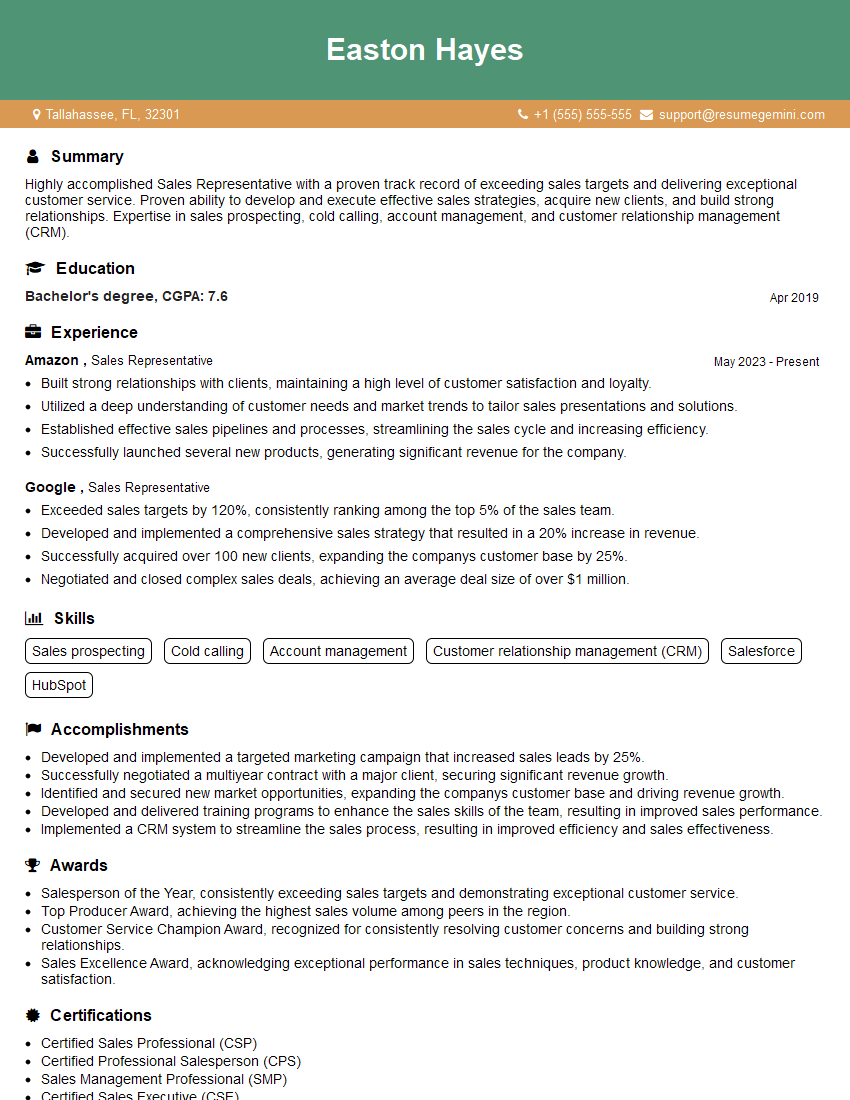
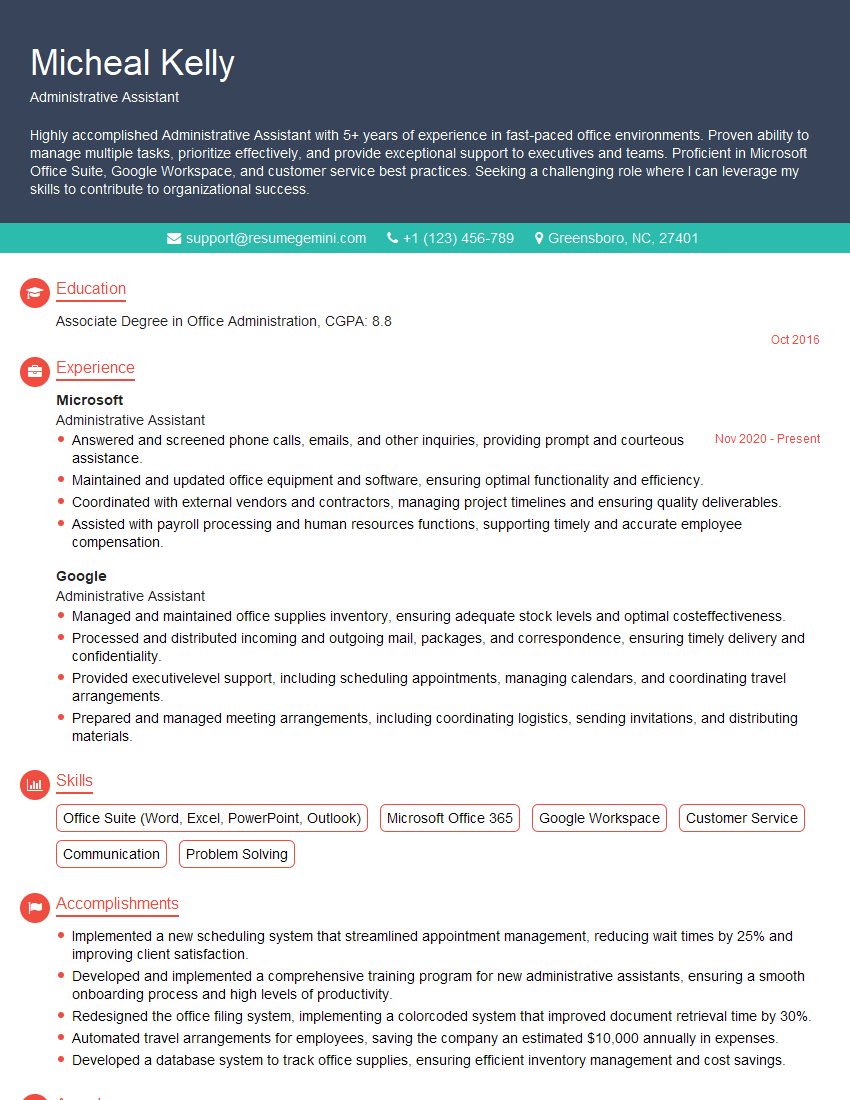
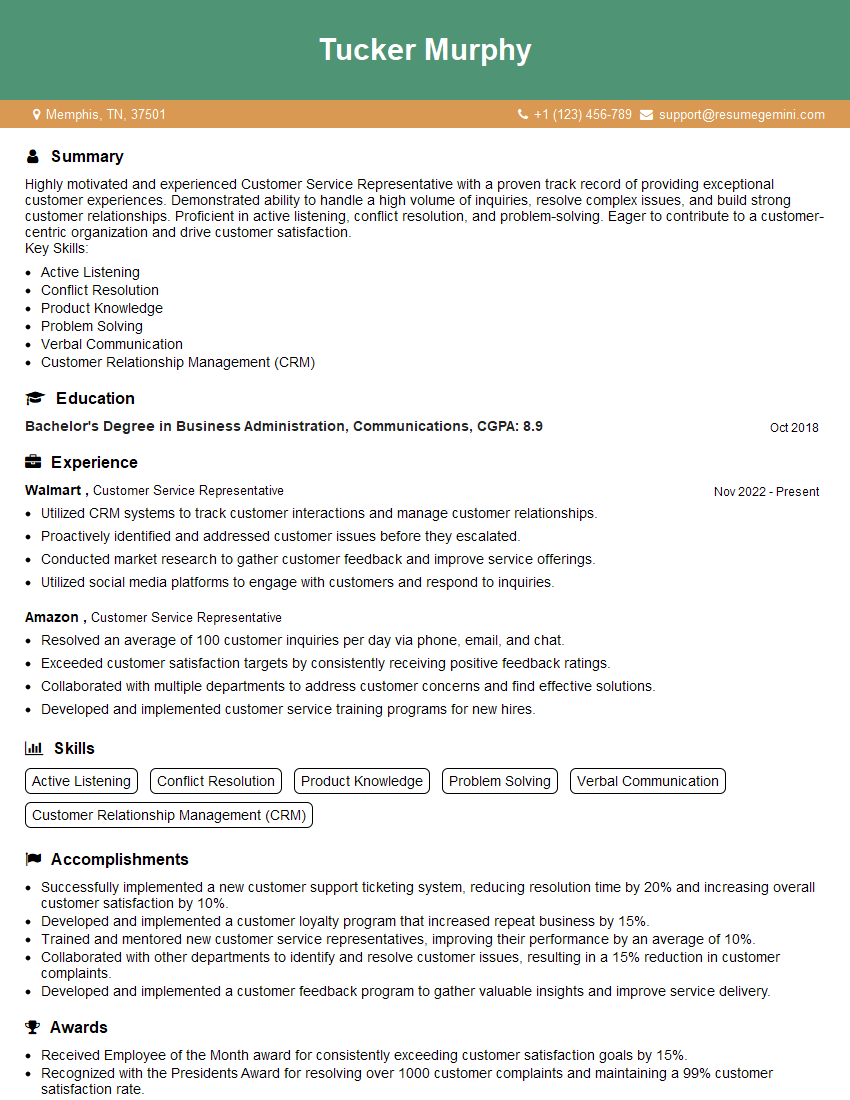
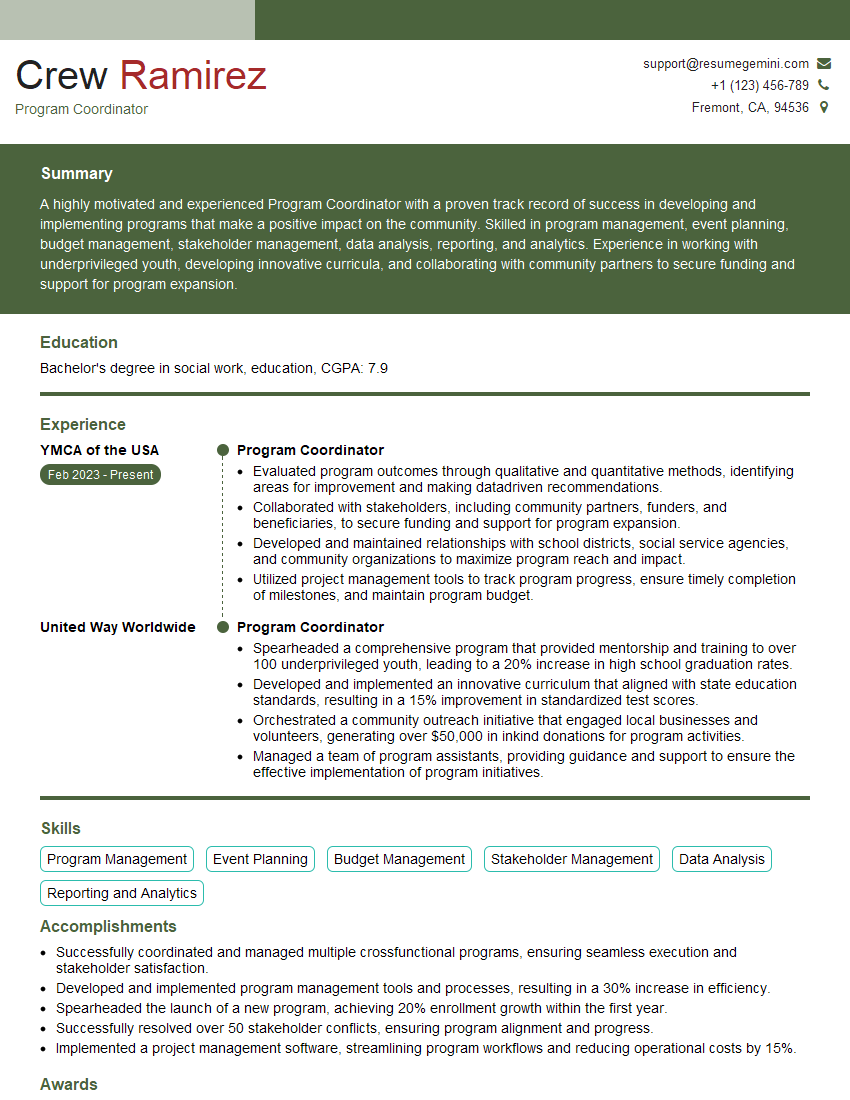
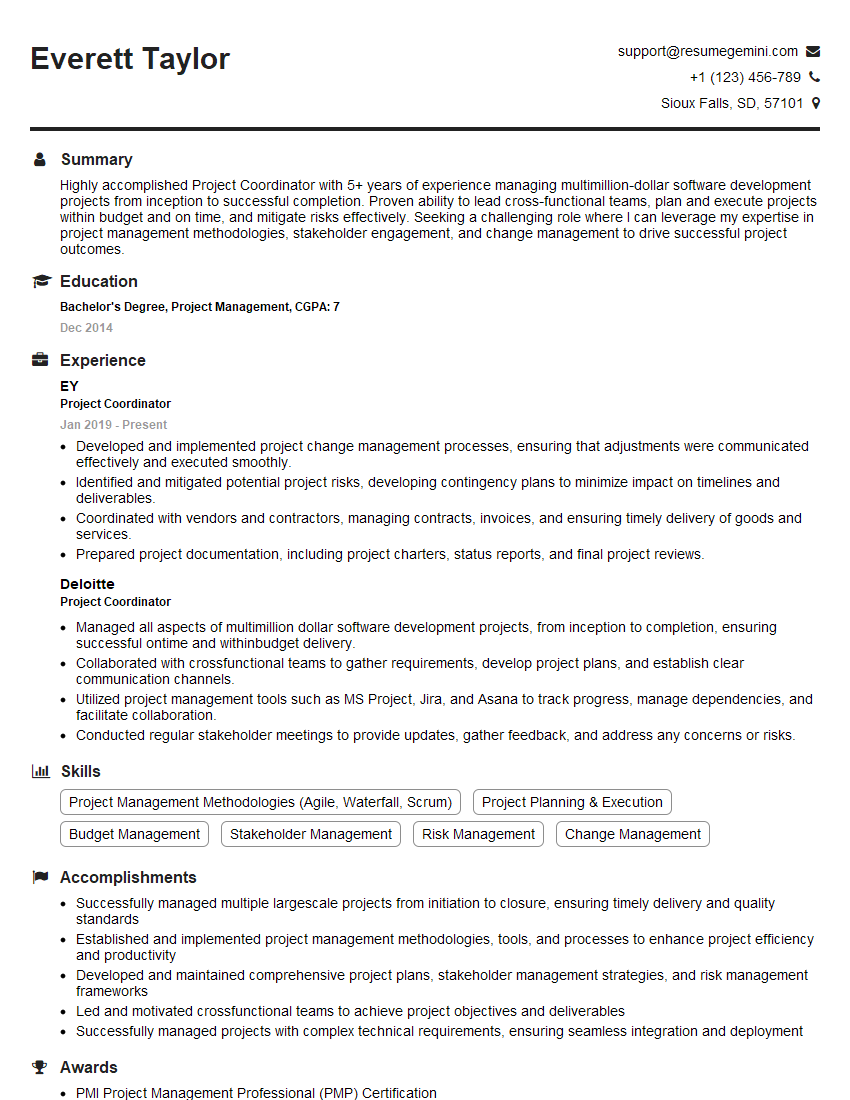
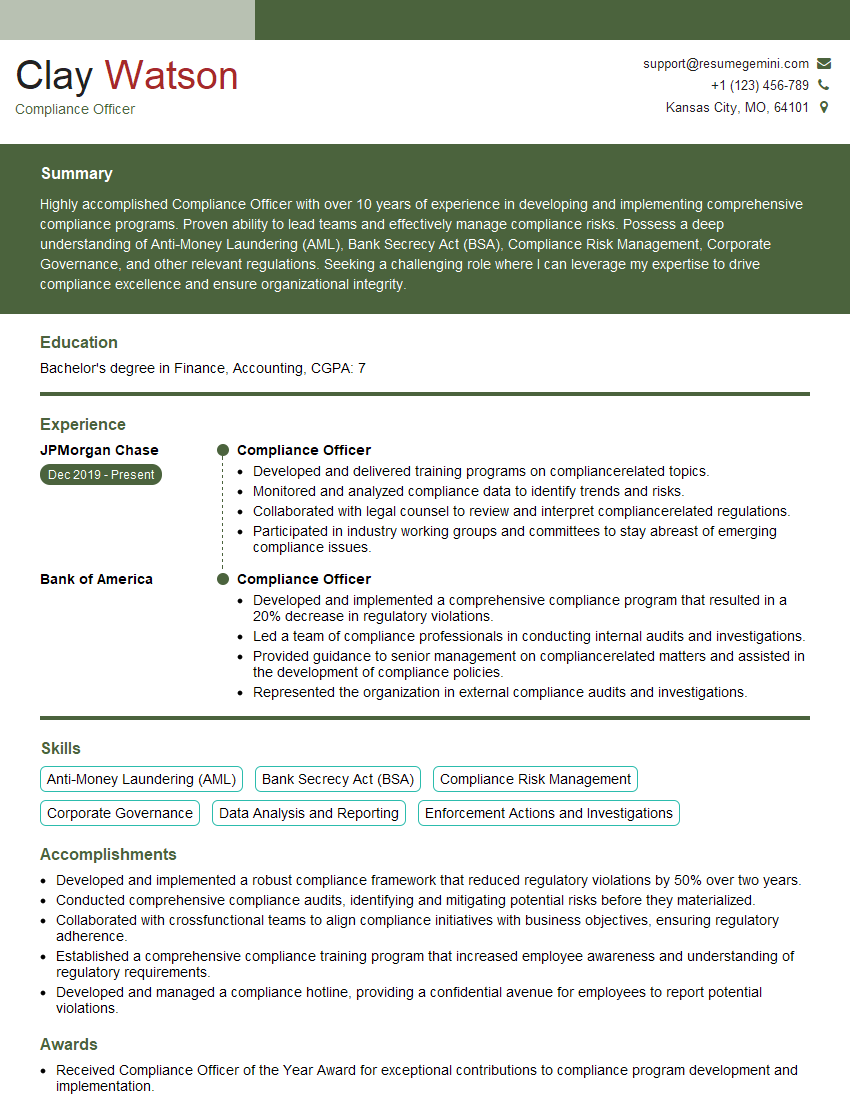
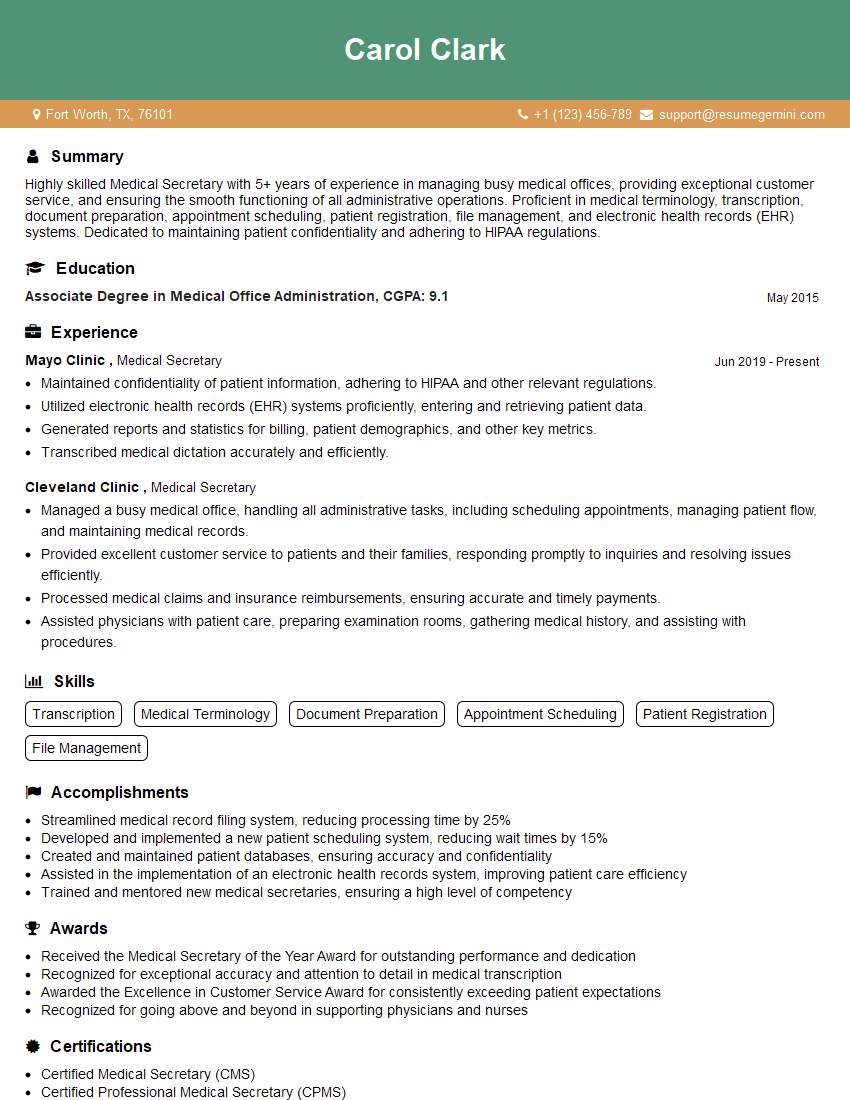
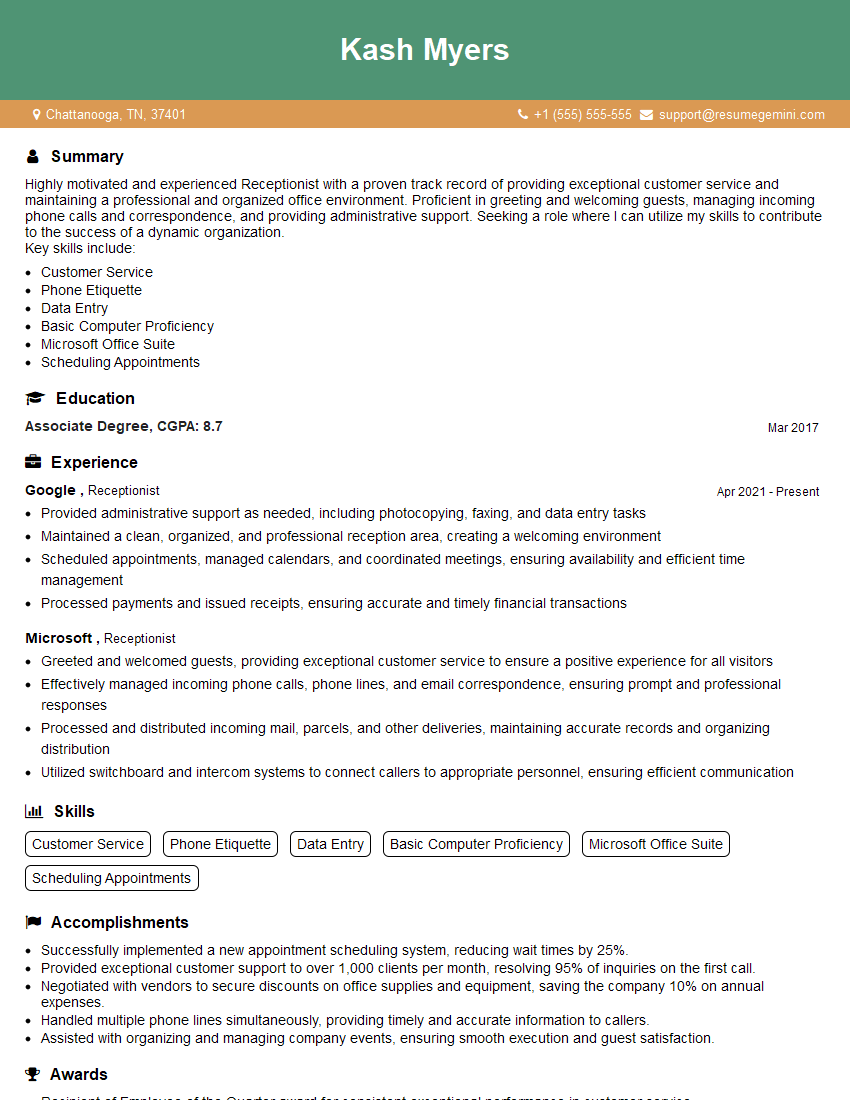
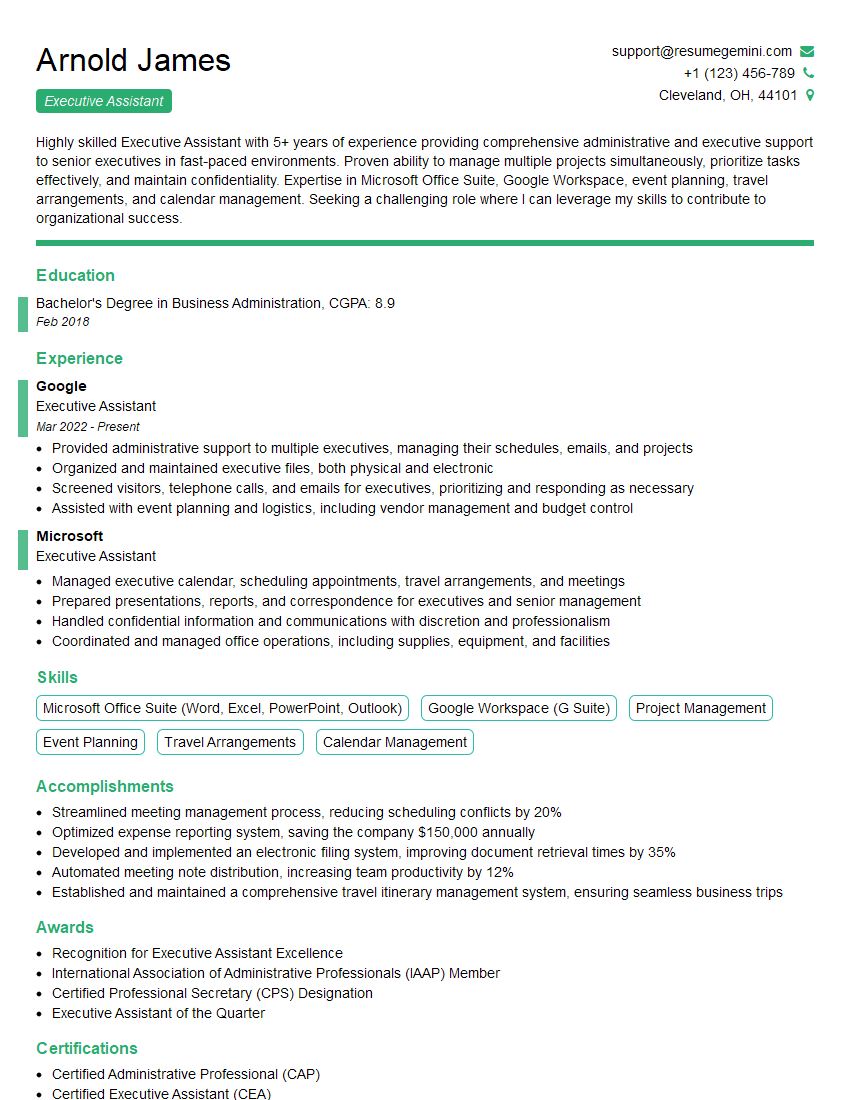
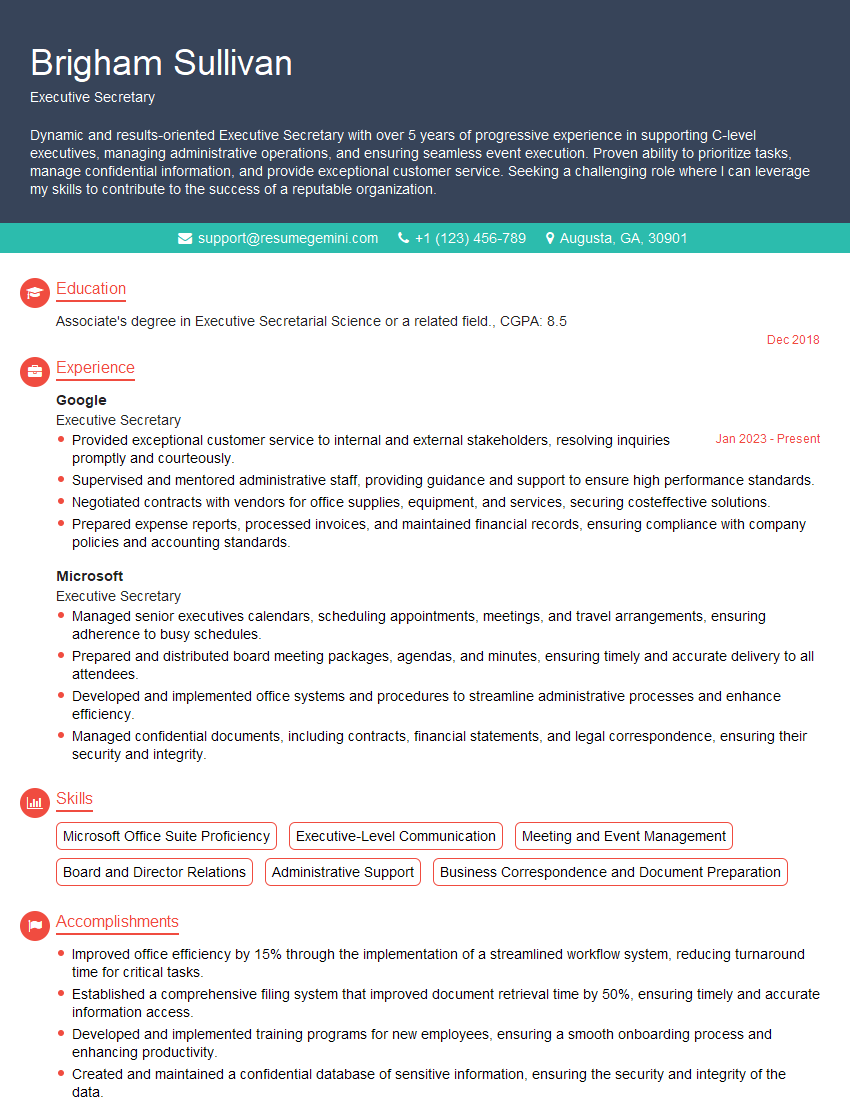
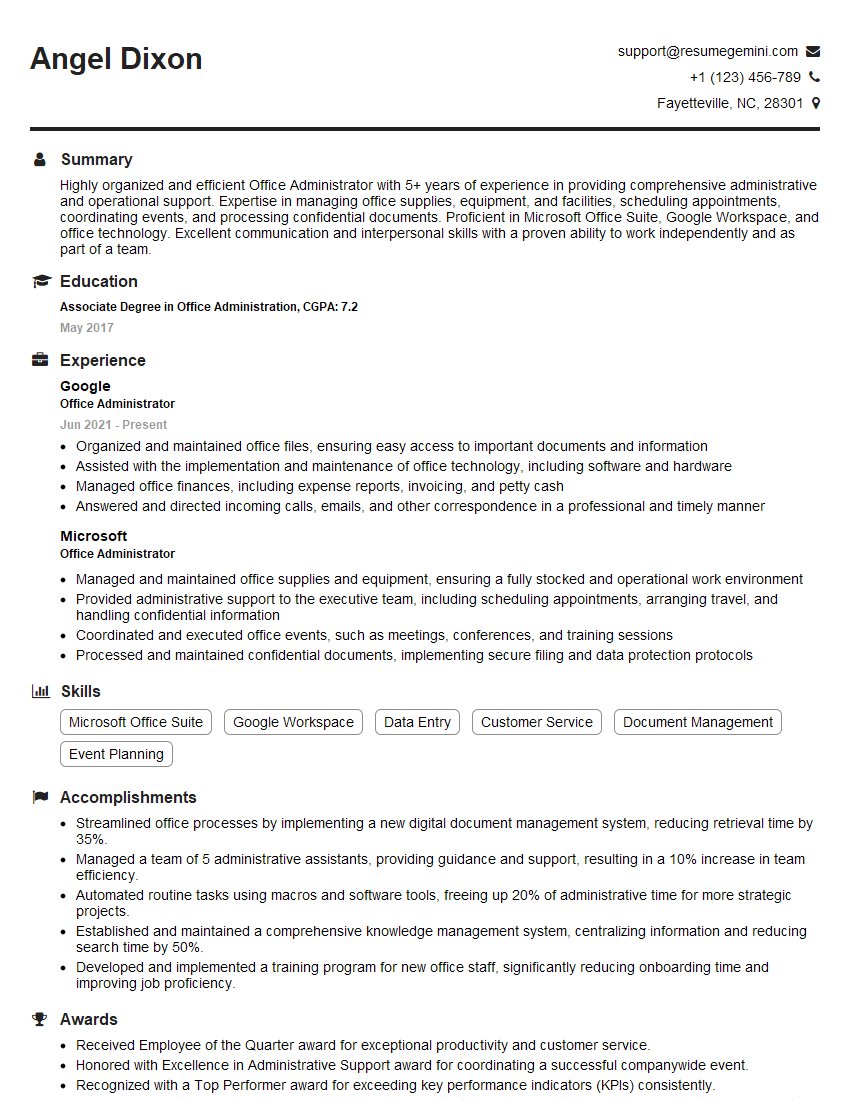
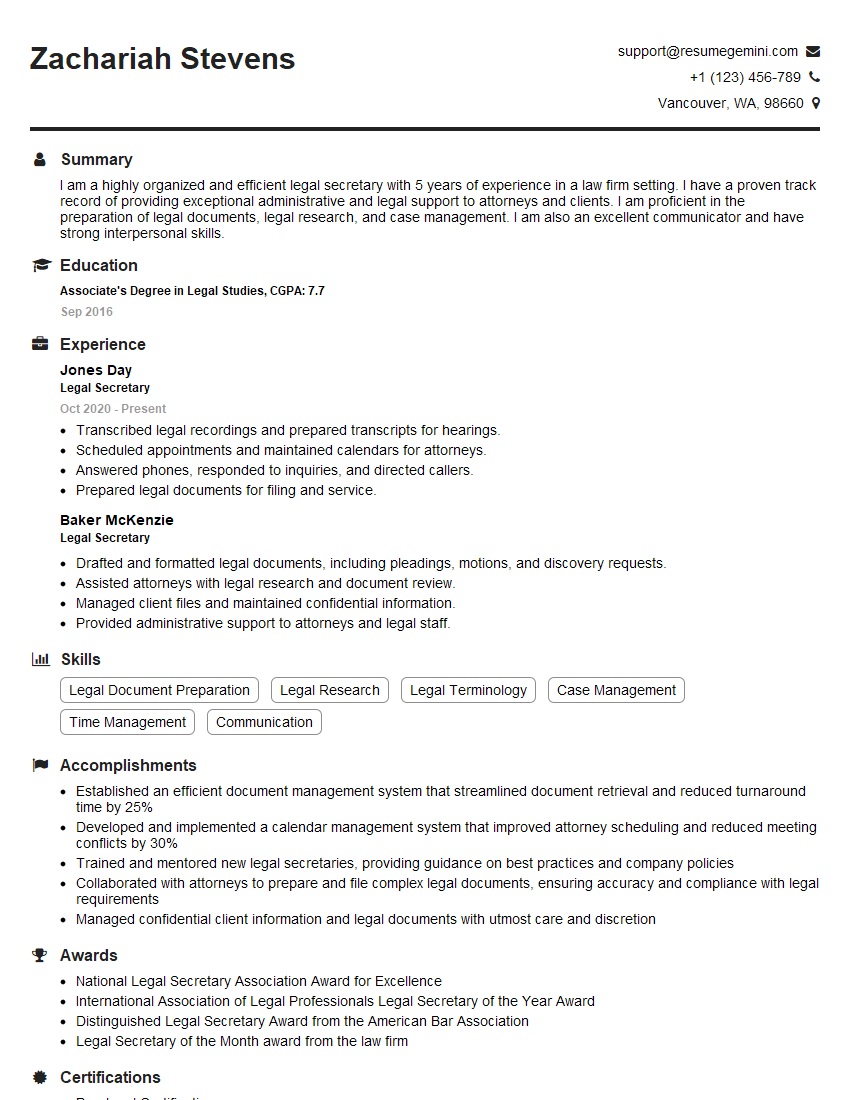
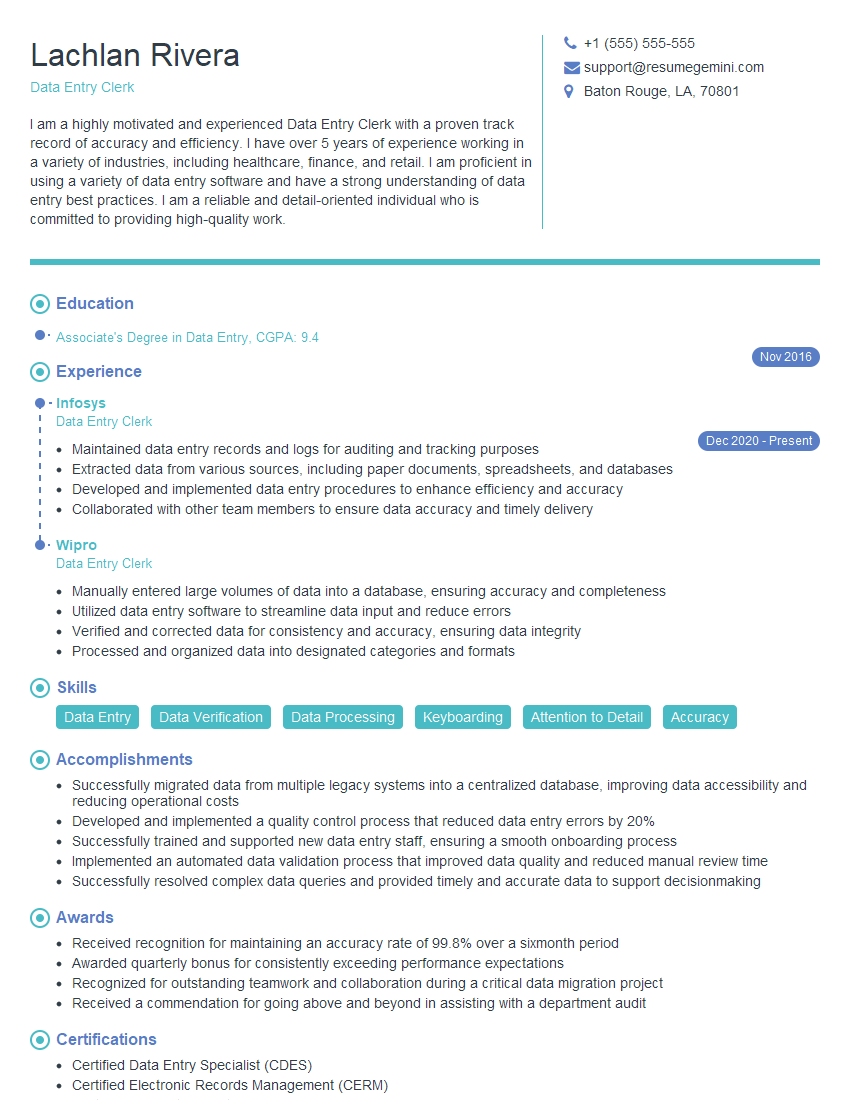
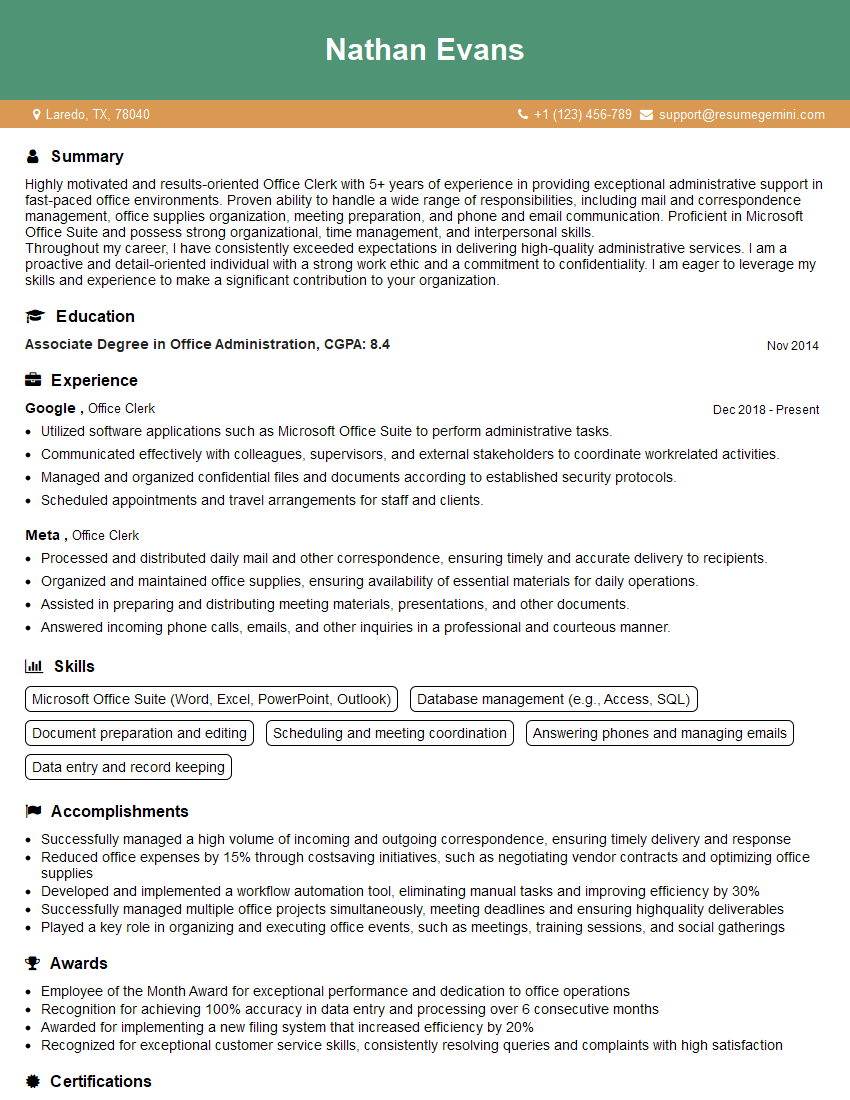
Mastering the Microsoft Office Suite is crucial for career advancement across numerous fields. Proficiency demonstrates essential skills in organization, data analysis, communication, and teamwork – all highly valued by employers. To maximize your job prospects, create a resume that Applicant Tracking Systems (ATS) can easily read and understand. ResumeGemini is a trusted resource to help you build a professional and effective resume. We offer examples of resumes tailored to highlight Proficient with Microsoft Office Suite skills, helping you showcase your abilities effectively to potential employers.
Explore more articles
Users Rating of Our Blogs
Share Your Experience
We value your feedback! Please rate our content and share your thoughts (optional).
What Readers Say About Our Blog
Hello,
We found issues with your domain’s email setup that may be sending your messages to spam or blocking them completely. InboxShield Mini shows you how to fix it in minutes — no tech skills required.
Scan your domain now for details: https://inboxshield-mini.com/
— Adam @ InboxShield Mini
Reply STOP to unsubscribe
Hi, are you owner of interviewgemini.com? What if I told you I could help you find extra time in your schedule, reconnect with leads you didn’t even realize you missed, and bring in more “I want to work with you” conversations, without increasing your ad spend or hiring a full-time employee?
All with a flexible, budget-friendly service that could easily pay for itself. Sounds good?
Would it be nice to jump on a quick 10-minute call so I can show you exactly how we make this work?
Best,
Hapei
Marketing Director
Hey, I know you’re the owner of interviewgemini.com. I’ll be quick.
Fundraising for your business is tough and time-consuming. We make it easier by guaranteeing two private investor meetings each month, for six months. No demos, no pitch events – just direct introductions to active investors matched to your startup.
If youR17;re raising, this could help you build real momentum. Want me to send more info?
Hi, I represent an SEO company that specialises in getting you AI citations and higher rankings on Google. I’d like to offer you a 100% free SEO audit for your website. Would you be interested?
Hi, I represent an SEO company that specialises in getting you AI citations and higher rankings on Google. I’d like to offer you a 100% free SEO audit for your website. Would you be interested?
good
