The thought of an interview can be nerve-wracking, but the right preparation can make all the difference. Explore this comprehensive guide to Providing Commentary and Analysis interview questions and gain the confidence you need to showcase your abilities and secure the role.
Questions Asked in Providing Commentary and Analysis Interview
Q 1. Explain your approach to analyzing complex data sets.
Analyzing complex datasets requires a systematic approach. I begin by understanding the context – what questions are we trying to answer? What are the key variables? Then, I move through a process of data cleaning, exploration, and modeling. Data cleaning involves handling missing values, outliers, and inconsistencies. Exploratory data analysis (EDA) uses descriptive statistics and visualizations to understand the data’s structure and identify patterns. Finally, I choose appropriate statistical models or machine learning algorithms depending on the research question and the nature of the data (e.g., regression for prediction, clustering for segmentation). Throughout this process, I meticulously document each step, ensuring reproducibility and transparency.
For instance, in a recent project analyzing customer churn, I first cleaned the data by imputing missing values for customer demographics using k-nearest neighbors. Then, I used EDA techniques like histograms and correlation matrices to understand the relationship between variables like customer tenure, service usage, and churn probability. Based on these insights, I built a logistic regression model to predict future churn.
Q 2. How do you identify biases in data and mitigate their influence on your analysis?
Bias in data is a significant concern, and I address it through careful data collection, rigorous analysis, and transparent reporting. Identifying biases involves critically examining the data’s source, collection methods, and potential sampling biases. For example, relying solely on online surveys can introduce selection bias as it excludes individuals without internet access. Similarly, using historical data might reflect past societal biases.
To mitigate bias, I employ several strategies: using diverse data sources, employing statistical techniques to adjust for known biases (like propensity score matching), and carefully considering the limitations of the data and the potential implications of biases in my analysis and conclusions. I also strive to be transparent about potential biases in my reports, highlighting limitations and uncertainties.
Q 3. Describe a time you had to deliver critical analysis under pressure.
During a recent project for a major retailer, we needed to analyze sales data and identify critical trends to inform their holiday marketing campaign. The deadline was extremely tight – just three days. The data set was enormous and complex, involving multiple product categories, geographical regions, and sales channels.
Under this pressure, I prioritized the most crucial aspects of the analysis. I utilized automated data processing tools to clean and prepare the data quickly. I focused on key performance indicators (KPIs) like year-over-year growth and regional sales patterns, visualizing them using interactive dashboards. By focusing on clear, concise visualizations and delivering a high-level summary first, then providing detailed breakdowns as needed, I was able to communicate the most impactful insights within the tight deadline.
Q 4. How do you synthesize information from multiple sources to form a cohesive commentary?
Synthesizing information from multiple sources requires a structured approach. I begin by carefully reviewing each source, identifying key findings and potential inconsistencies. I then create a framework or a summary table to organize the information thematically. This might involve categorizing findings, comparing and contrasting different perspectives, and identifying common threads or areas of disagreement. For instance, if analyzing economic forecasts, I would compare predictions from different institutions, highlighting areas of consensus and divergence.
Crucially, I assess the credibility and reliability of each source, considering factors like methodology, data quality, and potential biases. This allows me to weight the information appropriately when formulating my final commentary, explaining the rationale behind my assessment of different sources’ reliability and impact on my conclusions.
Q 5. What techniques do you use to ensure the clarity and accuracy of your analysis?
Ensuring clarity and accuracy is paramount. My techniques involve meticulous data validation, using peer review, and rigorous testing of my analyses. I employ multiple methods to verify the accuracy of my calculations and interpretations, including using different statistical software packages and independently checking my results.
Moreover, I write clearly and concisely, avoiding jargon whenever possible. I use simple language, avoiding technical terms unless absolutely necessary and carefully defining them when used. I also prioritize using effective visualizations to present my findings in a more accessible and engaging way. Before final delivery, I always conduct a thorough review for errors, ensuring both the accuracy and clarity of the content.
Q 6. How do you present complex analytical findings to a non-technical audience?
Communicating complex analysis to a non-technical audience demands a different approach. I avoid technical jargon and focus on storytelling, using analogies and real-world examples to illustrate my findings. Instead of presenting raw data, I emphasize the key takeaways, focusing on what the data means in a practical context. Visualizations like charts and graphs are incredibly effective tools, particularly for conveying trends and patterns without overwhelming the audience with technical details.
For example, instead of discussing regression coefficients, I might explain the findings in terms of percentage increases or decreases, using clear, concise language that resonates with the audience’s understanding. I often use case studies or specific examples to make the analysis relatable and memorable.
Q 7. Describe your experience with data visualization and its role in communicating analysis.
Data visualization is an indispensable tool in my arsenal. It’s crucial for conveying complex information in a clear, concise, and engaging manner. I utilize a range of visualization techniques, from simple bar charts and line graphs to more complex interactive dashboards, depending on the data and the audience. For instance, a geographical heatmap can effectively illustrate regional variations in sales performance, whereas a scatter plot can show the correlation between two variables.
Effective data visualization helps to identify patterns and anomalies that might be missed in raw data. It allows me to quickly communicate key findings and support my analytical conclusions with compelling visual evidence, making my analysis more persuasive and easy to understand.
Q 8. How do you stay current with industry trends and best practices in data analysis?
Staying current in the dynamic field of data analysis requires a multifaceted approach. It’s not a one-size-fits-all solution; it’s an ongoing commitment.
- Following Key Publications and Journals: I regularly read publications like the Journal of the American Statistical Association and other reputable journals focusing on data science and analytics. These publications often publish cutting-edge research and methodologies.
- Attending Conferences and Webinars: Participating in industry conferences like those hosted by ODSC or attending webinars offered by platforms like Coursera and edX keeps me abreast of the latest trends and best practices. Networking with other professionals at these events is invaluable.
- Leveraging Online Communities and Forums: Active participation in online communities like Stack Overflow and Reddit’s data science subreddits provides exposure to real-world challenges and solutions, often highlighting emerging trends.
- Continuous Learning Through Online Courses: Platforms such as DataCamp, Udacity, and edX offer courses on new tools and techniques. I regularly take advantage of these resources to upskill and maintain proficiency.
- Following Industry Influencers and Blogs: Keeping an eye on influential data scientists and analysts on platforms like Twitter and LinkedIn helps me stay informed about new developments.
This combination of formal learning and informal networking ensures I remain at the forefront of data analysis advancements.
Q 9. How do you handle conflicting data points or contradictory information during analysis?
Encountering conflicting data is inevitable in data analysis. My approach involves a systematic investigation to understand the discrepancies and determine the most reliable information.
- Identify the Source of the Conflict: First, I meticulously examine the sources of the conflicting data, looking for differences in methodology, data collection periods, or definitions used. For example, one dataset might use a different survey methodology than another.
- Data Quality Assessment: I evaluate the quality of each dataset. This includes checking for completeness, accuracy, and consistency. I might look at things like missing values, outliers, and potential biases.
- Investigate Potential Explanations: I explore potential reasons for the discrepancy. This may involve consulting subject matter experts or researching related literature to understand the context and potential biases affecting each data source.
- Data Triangulation: If possible, I seek additional data sources to corroborate or refute the findings from the conflicting datasets. The more independent sources confirming a finding, the more confidence we have in its reliability.
- Sensitivity Analysis: In cases where resolving the conflict definitively isn’t feasible, I conduct sensitivity analyses to determine how the conflicting data impacts the overall analysis and conclusions. This helps assess the robustness of the findings.
- Documentation and Transparency: All steps of the conflict resolution process are carefully documented, including the sources of data, the nature of the conflict, and the steps taken to address it. This ensures transparency and allows for scrutiny by others.
Ultimately, the goal is to make informed decisions based on the most credible and reliable evidence. Sometimes this means acknowledging limitations or uncertainties in the analysis.
Q 10. Explain your experience with specific analytical tools or software (e.g., SQL, R, Python).
My experience spans several analytical tools, each with its own strengths and applications. I’m proficient in SQL, R, and Python, and I select the tool best suited for the task at hand.
- SQL: I use SQL extensively for data extraction, manipulation, and management within relational databases. For example, I might use a query like
SELECT * FROM Customers WHERE Country = 'USA';to retrieve customer data from a specific country. My experience extends to optimizing queries for performance and working with large datasets. - R: R is my preferred tool for statistical modeling and data visualization. I use packages like
ggplot2for creating insightful visualizations anddplyrfor efficient data manipulation. I have experience building predictive models using techniques like linear regression, logistic regression, and decision trees. - Python: Python is a versatile tool I use for data cleaning, preprocessing, and machine learning tasks. Libraries like
pandasandscikit-learnare frequently used. I’ve built various machine learning models such as random forests and support vector machines using Python.
The choice of tool depends on the project requirements. For large-scale data warehousing tasks, SQL excels. For complex statistical analysis and visualizations, R is often ideal. Python provides a flexible environment for a wide range of data science tasks.
Q 11. Describe a time your commentary influenced a decision or outcome.
In a recent project for a retail client, my commentary significantly influenced the direction of their marketing strategy. The client was struggling to understand declining sales of a particular product line. My analysis, combining sales data with customer segmentation and social media sentiment analysis, revealed that the product wasn’t resonating with the target demographic anymore; younger customers preferred a redesigned version.
My commentary, presented clearly and concisely with supporting visualizations, highlighted this shift in consumer preference. This led the client to redirect their marketing budget toward promoting the redesigned product and offering targeted discounts to attract younger customers. The result was a significant increase in sales of the updated product line and a more effective marketing strategy.
This experience demonstrates the impact of well-supported analytical commentary – it’s not just about presenting data; it’s about translating complex data into actionable insights that influence decision-making.
Q 12. How do you prioritize different aspects of an analysis when facing time constraints?
Prioritizing aspects of an analysis under time constraints requires a strategic approach focusing on delivering the most impactful insights within the allocated timeframe.
- Define Key Objectives: Clearly define the primary objectives of the analysis. This helps focus efforts on the most critical aspects.
- Prioritize Data Sources: Identify the most reliable and relevant data sources to maximize the impact of the analysis while minimizing time spent on less valuable data.
- Focus on Critical Analyses: Concentrate on the most critical analyses that directly address the key objectives. Less important aspects can be deferred or simplified.
- Use Efficient Methods: Employ efficient data processing and analysis techniques. Automate repetitive tasks wherever possible.
- Iterative Approach: Adopt an iterative approach, starting with a basic analysis and progressively adding complexity as time allows.
- Communicate Clearly: Concisely communicate the key findings and limitations imposed by the time constraint to ensure transparency.
Prioritization under pressure requires decisiveness. It’s about making informed trade-offs to deliver the most valuable insights within the given timeframe.
Q 13. Explain your process for determining the reliability and validity of your data sources.
Determining the reliability and validity of data sources is crucial for the integrity of any analysis. My process involves several key steps:
- Source Assessment: Evaluate the reputation and credibility of the data source. Is it a recognized authority in the field? What is its track record? A government agency, for example, typically offers more reliable data than an anonymous blog.
- Data Collection Methodology: Understand the methods used to collect the data. Are they transparent and well-documented? Are there any potential biases in the data collection process (e.g., sampling bias, response bias)?
- Data Validation: Check the data for accuracy, completeness, and consistency. This might involve comparing it against other known data sources or using data quality checks.
- Documentation Review: Carefully review any available documentation about the data, including data dictionaries, codebooks, and metadata. This can reveal important context and potential limitations.
- Expert Consultation: When necessary, consult with subject matter experts to validate the data and assess its relevance to the research question.
Addressing these points ensures I’m using trustworthy data to draw meaningful conclusions. When uncertainties exist, I’ll explicitly state those limitations in my analysis.
Q 14. How do you identify potential risks or limitations associated with your analysis?
Identifying potential risks and limitations is an integral part of responsible data analysis. My approach involves:
- Data Quality Issues: I assess the potential for data quality issues such as missing values, outliers, inconsistencies, and errors. The impact of these issues on the analysis is carefully considered.
- Bias and Representativeness: I evaluate potential biases in the data that could affect the validity of the findings. For instance, a sample might not accurately represent the population of interest.
- Methodological Limitations: I acknowledge limitations associated with the chosen analytical methods. For example, a simple linear regression might not accurately capture non-linear relationships.
- External Factors: I consider external factors that could influence the data or the interpretations. For example, changes in market conditions might affect sales data.
- Confounding Variables: I investigate the possibility of confounding variables that could distort the relationship between variables being studied.
- Causal Inference Limitations: I’m cautious about drawing causal inferences, especially when the data is observational rather than experimental. Correlation does not equal causation.
By acknowledging these limitations, I ensure the analysis is interpreted responsibly and that conclusions are appropriately qualified. Transparency regarding the limitations is critical for building trust and credibility.
Q 15. Describe a situation where your analysis was challenged, and how you responded.
One instance where my analysis faced significant challenge involved a market research report on a new consumer product. My initial projections, based primarily on quantitative data like past sales trends and demographic information, predicted strong market penetration. However, a competitor launched a similar product with superior branding and marketing, a factor my quantitative model hadn’t fully accounted for.
My response involved incorporating qualitative data. I conducted focus groups and analyzed social media sentiment to understand consumer perception of both products. This qualitative data revealed the significant impact of branding and marketing, highlighting a weakness in my initial quantitative analysis. I revised my report, acknowledging the limitations of my initial model and incorporating the qualitative insights to offer a more nuanced and accurate prediction. This involved presenting both the quantitative and qualitative findings side-by-side to show a more complete picture, demonstrating a clear understanding of the limitations of relying solely on numbers.
Career Expert Tips:
- Ace those interviews! Prepare effectively by reviewing the Top 50 Most Common Interview Questions on ResumeGemini.
- Navigate your job search with confidence! Explore a wide range of Career Tips on ResumeGemini. Learn about common challenges and recommendations to overcome them.
- Craft the perfect resume! Master the Art of Resume Writing with ResumeGemini’s guide. Showcase your unique qualifications and achievements effectively.
- Don’t miss out on holiday savings! Build your dream resume with ResumeGemini’s ATS optimized templates.
Q 16. How do you ensure your commentary is objective and unbiased?
Objectivity and unbiased commentary are paramount. I ensure this through several key practices. Firstly, I meticulously document my methodology, making it transparent and auditable. This includes clearly stating my data sources, the analytical techniques employed, and any assumptions made. Secondly, I actively seek out diverse perspectives. Before finalizing any analysis, I review my findings with colleagues and subject matter experts who can offer alternative interpretations. This helps identify potential biases and refine my conclusions. Finally, I strive to present data in a neutral manner, avoiding loaded language or emotionally charged descriptions. I focus on presenting the facts and drawing conclusions directly supported by the evidence, rather than attempting to sway the reader towards a particular viewpoint.
Q 17. What are the key ethical considerations in providing commentary and analysis?
Ethical considerations in commentary and analysis are crucial.
- Transparency: All data sources and methodologies must be clearly disclosed to avoid misrepresentation.
- Accuracy: The analysis must be rigorous and based on sound evidence. Inaccurate or misleading information can have serious consequences.
- Objectivity: Personal biases should be minimized and declared. The commentary must reflect the data and not the analyst’s opinions.
- Confidentiality: If working with sensitive data, strict confidentiality protocols must be followed.
- Conflict of Interest: Any potential conflicts of interest must be disclosed. This could include financial interests or personal relationships that could influence the analysis.
Q 18. How do you incorporate qualitative data into your quantitative analysis?
Integrating qualitative data into quantitative analysis enriches the understanding. Think of it like adding color and texture to a black and white photograph. Quantitative data provides the numbers – sales figures, market share, etc. Qualitative data – from interviews, surveys, focus groups, or social media sentiment analysis – provides context and explanation. For example, if quantitative data shows declining sales, qualitative data might reveal reasons: poor customer service, negative online reviews, or a shift in consumer preferences. The integration isn’t simply about presenting both datasets separately; it’s about using qualitative insights to interpret and contextualize the quantitative findings, offering a more comprehensive and useful analysis.
A practical example: A company might see declining website traffic (quantitative). Qualitative data from user interviews might reveal the website is difficult to navigate, explaining the declining traffic. This combined understanding allows for targeted improvements.
Q 19. Describe your experience with predictive modeling or forecasting.
I have extensive experience with predictive modeling, primarily using regression analysis, time series forecasting, and machine learning techniques. For instance, in a past project, I used time series analysis to forecast future energy consumption for a utility company, considering factors like weather patterns, economic indicators, and past consumption data. My models have helped various clients make informed decisions, from inventory management to resource allocation.
These models are not simply crystal balls; they rely on carefully chosen data, validated methodologies, and an understanding of the model’s limitations. I regularly incorporate techniques like cross-validation and backtesting to ensure the models’ accuracy and robustness. Crucially, I always communicate the uncertainty inherent in forecasting – no model is perfect. It’s about understanding the probabilities and potential ranges of outcomes rather than offering absolute certainty.
Q 20. How do you effectively communicate uncertainty or limitations in your analysis?
Communicating uncertainty is as important as communicating the results themselves. I explicitly address limitations in my analysis by:
- Quantifying uncertainty: Using confidence intervals or prediction intervals to show the range of possible outcomes.
- Discussing limitations of data: Acknowledging any biases, missing data, or limitations in the data collection process.
- Highlighting assumptions: Clearly stating any assumptions made in the analysis and their potential impact on the results.
- Presenting alternative scenarios: Exploring potential outcomes under different assumptions or scenarios.
- Using clear and understandable language: Avoiding technical jargon and explaining complex concepts in a straightforward way.
Q 21. What are your strengths and weaknesses in providing commentary and analysis?
My strengths lie in my ability to synthesize complex information, communicate technical concepts clearly, and maintain objectivity. I’m adept at employing a variety of analytical techniques and am comfortable working with both quantitative and qualitative data. My experience in predictive modeling and forecasting is a significant asset.
A weakness I’m actively working to improve is the ability to quickly adapt to completely unfamiliar data sets or industries. While I can quickly learn new techniques, the initial period of familiarization can sometimes be a slight bottleneck. To mitigate this, I consistently seek out opportunities to broaden my knowledge base and actively engage with diverse projects.
Q 22. How do you manage feedback and incorporate it into your analysis?
Managing feedback is crucial for refining my analysis and ensuring its accuracy and relevance. I approach feedback as an opportunity for growth, not criticism. My process involves several key steps:
- Active Listening: I carefully consider all feedback, paying attention not just to the words but also the underlying concerns.
- Categorization: I categorize feedback into themes (e.g., clarity issues, factual inaccuracies, methodological concerns). This helps me identify patterns and prioritize areas for improvement.
- Validation: I verify feedback against my source material and methodology. Sometimes, feedback points to genuine errors that need correction; other times, it highlights areas where my explanation could be clearer or more nuanced.
- Incorporation: Based on the validated feedback, I revise my analysis, adding clarifications, correcting errors, or strengthening arguments. This might involve re-writing sections, adding new data, or adjusting my conclusions.
- Documentation: I document all feedback received and the changes made in response, ensuring transparency and traceability.
For example, in a recent report on market trends, feedback highlighted a lack of clarity in explaining a complex statistical model. I responded by simplifying the explanation, using clearer language and adding a visual aid to illustrate the model’s workings.
Q 23. Describe your experience with different types of analytical reports.
My experience encompasses a wide range of analytical reports, including:
- Financial Reports: Analyzing financial statements, forecasting profitability, and assessing investment risk. I’ve worked on reports for both public and private companies, using various financial modeling techniques.
- Market Research Reports: Conducting market analysis, identifying target audiences, and assessing competitive landscapes. I’ve used both quantitative and qualitative data to develop these reports.
- Data-driven Insights Reports: Analyzing large datasets to identify trends, patterns, and anomalies. I’ve used various statistical methods and data visualization techniques to present these findings concisely.
- Strategic Planning Reports: Assessing business strategies, identifying opportunities and risks, and recommending courses of action. I’ve worked on reports that guide organizational decisions and support strategic planning initiatives.
Each report type requires a unique approach, from the data collection and analysis methods to the presentation style. For instance, a financial report demands precision and accuracy, whereas a market research report might emphasize narrative and storytelling.
Q 24. How do you adapt your communication style to different audiences?
Adapting my communication style is crucial for effective analysis. I tailor my approach to the audience’s background, needs, and preferences. This includes:
- Language: Using jargon only when necessary and defining it clearly. For a technical audience, I might use more specialized terms; for a general audience, I would simplify my language.
- Format: Choosing the appropriate format, such as a concise executive summary for busy executives or a detailed report for in-depth analysis.
- Visualizations: Employing charts, graphs, and other visuals to present complex data in an accessible way. The type of visualization used depends on the data and the audience’s familiarity with data analysis.
- Level of Detail: Adjusting the depth and breadth of my analysis depending on the audience’s knowledge and interest. For example, a highly technical audience might appreciate a deep dive into methodological details, while a general audience would benefit from a more concise overview.
Imagine explaining the impact of inflation to a group of economists versus a group of high school students. The language, level of detail, and chosen examples would differ significantly in each case.
Q 25. What are your preferred methods for conducting research and gathering information?
My research methods are multifaceted and depend heavily on the project requirements. I commonly employ:
- Primary Research: This includes conducting surveys, interviews, focus groups, and experiments to gather firsthand data.
- Secondary Research: This involves reviewing existing literature, reports, and data sources, such as academic journals, industry publications, and government statistics.
- Data Mining and Analysis: This involves extracting insights from large datasets using statistical software and data visualization tools. Tools like
RandPythonare frequently used. - Qualitative Analysis: This involves analyzing textual data, such as interview transcripts and open-ended survey responses, to identify themes and patterns.
- Quantitative Analysis: This involves analyzing numerical data using statistical methods to test hypotheses and draw conclusions.
For example, while analyzing the impact of social media on consumer behavior, I might use surveys to gather primary data on consumers’ usage patterns and secondary research to review existing literature on the subject.
Q 26. How do you ensure your analysis is relevant and impactful?
Ensuring relevance and impact requires a keen understanding of the audience’s needs and the broader context. My approach involves:
- Clearly Defined Objectives: Starting with clearly defined research questions and objectives, ensuring that my analysis directly addresses these goals.
- Data Relevance: Using data that is relevant, reliable, and up-to-date. This includes carefully considering the source and quality of the data.
- Actionable Insights: Generating insights that are actionable and can inform decision-making. My analysis should not only describe the situation but also offer practical recommendations.
- Strong Narrative: Presenting the findings in a compelling and engaging narrative, ensuring that the analysis is easily understandable and memorable.
- Clear Communication: Communicating the findings clearly and concisely, using visuals and language that resonate with the intended audience.
For instance, a report on customer churn should not only identify the rate of churn but also provide actionable steps to reduce it, such as improving customer service or addressing specific pain points.
Q 27. Describe your experience with collaborative analysis projects.
Collaborative analysis projects are a significant part of my work. Effective collaboration relies on:
- Clear Roles and Responsibilities: Defining clear roles and responsibilities for each team member, ensuring that everyone understands their contribution.
- Open Communication: Maintaining open and transparent communication throughout the project, encouraging regular feedback and discussion.
- Shared Methodology: Utilizing a shared methodology and approach to data analysis, ensuring consistency and accuracy.
- Regular Meetings: Holding regular meetings to discuss progress, address challenges, and ensure alignment among team members.
- Version Control: Using version control systems to track changes and ensure that everyone is working with the most up-to-date version of the analysis.
In one project involving market forecasting, our team used a combination of quantitative and qualitative research methods, leveraging individual expertise in data analysis and industry knowledge to build a robust predictive model.
Q 28. How do you measure the success of your commentary and analysis?
Measuring the success of my commentary and analysis depends on the specific goals of the project. Key metrics include:
- Impact on Decision-Making: Did my analysis influence key decisions within the organization or inform strategic planning? This might be assessed through feedback from decision-makers or observing the implementation of recommendations.
- Accuracy and Reliability: Was my analysis accurate and reliable, based on sound methodology and data? This is assessed through internal review, peer review, and verification against external data sources.
- Clarity and Accessibility: Was my analysis clear, concise, and accessible to the intended audience? Feedback from the audience can provide insights into the clarity and understandability of my work.
- Timeliness: Was my analysis delivered on time and within budget? This is essential for ensuring the analysis remains relevant and impactful.
- Positive Outcomes: Did my analysis lead to positive outcomes, such as improved efficiency, increased revenue, or reduced costs? This is often assessed through subsequent performance indicators.
For instance, a successful market research report might lead to the launch of a new product that performs well in the market, directly demonstrating the impact of my analysis.
Key Topics to Learn for Providing Commentary and Analysis Interview
- Critical Thinking & Analysis: Understanding how to dissect complex information, identify key themes, and form reasoned judgments. This includes evaluating the validity and reliability of sources.
- Effective Communication: Clearly and concisely conveying your analysis both verbally and in writing, tailoring your language to your audience. Practice structuring your arguments logically and persuasively.
- Data Interpretation: Demonstrating the ability to extract meaningful insights from various data formats (numerical, textual, visual). Practice interpreting trends, patterns, and outliers.
- Contextual Understanding: Showcasing your ability to place your analysis within a broader context, considering relevant background information and potential implications.
- Objectivity & Bias Awareness: Recognizing and mitigating personal biases in your analysis; presenting information fairly and accurately, even when dealing with sensitive or controversial topics.
- Problem-Solving Application: Applying your analytical skills to solve real-world problems; developing practical recommendations based on your findings and demonstrating the impact of those recommendations.
- Different Analytical Frameworks: Exploring various frameworks like SWOT analysis, PESTLE analysis, or other relevant methods to approach different analytical challenges.
Next Steps
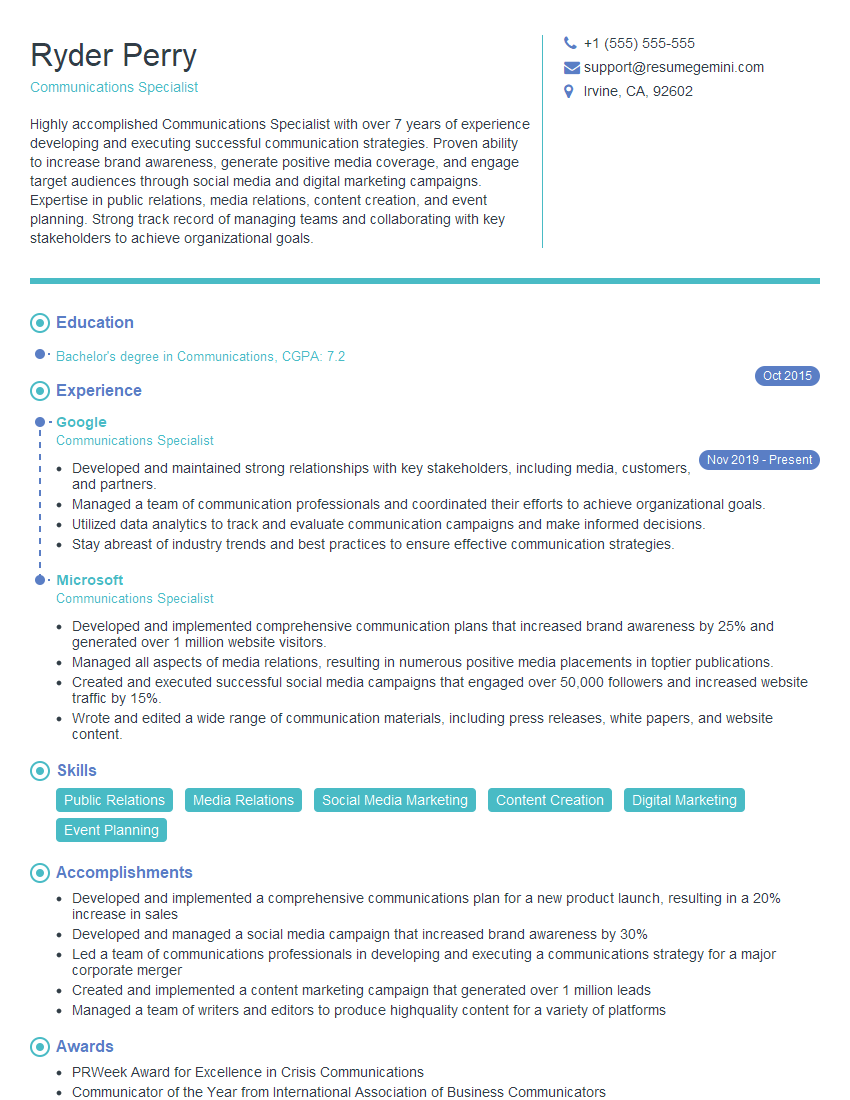
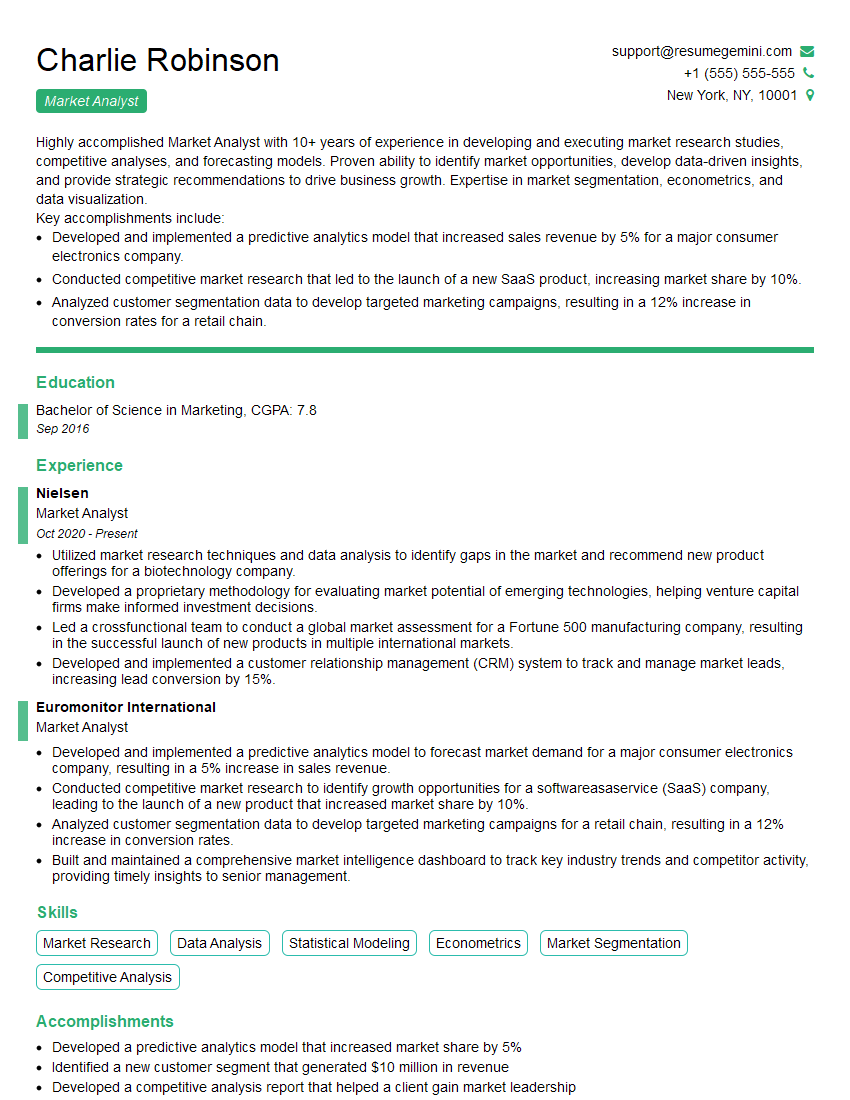
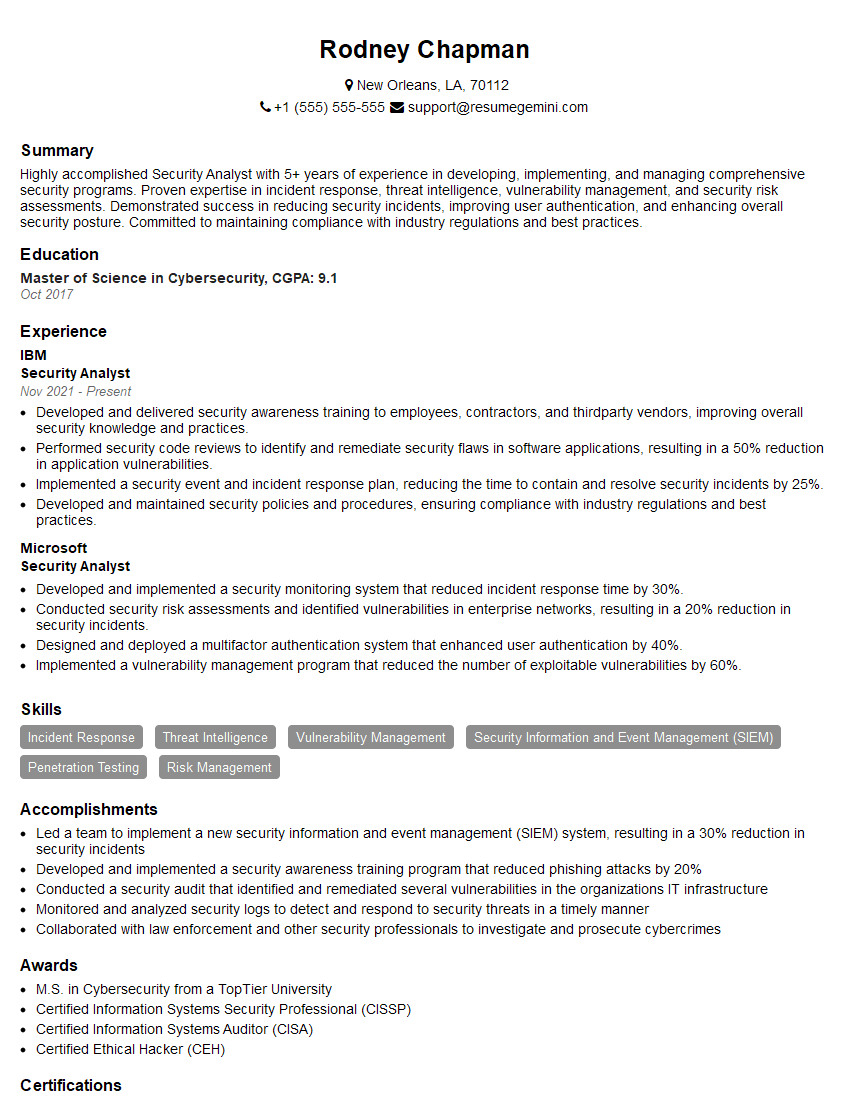
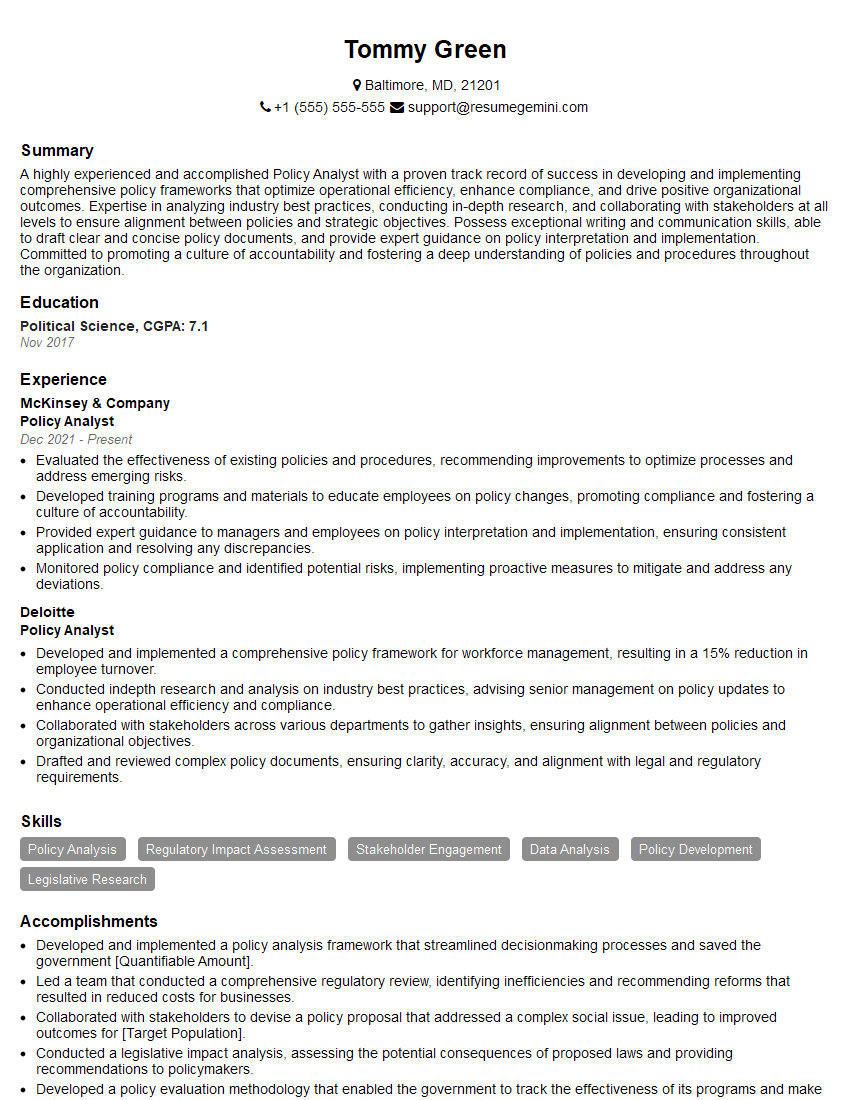
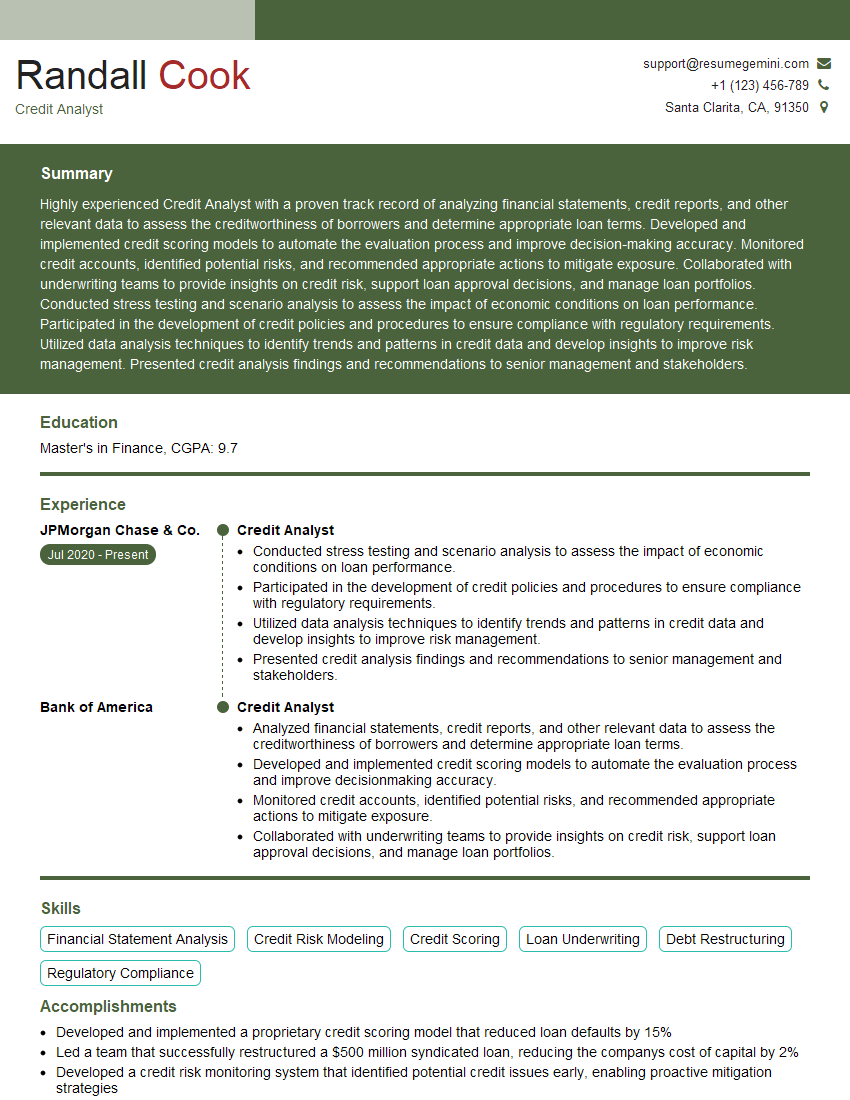
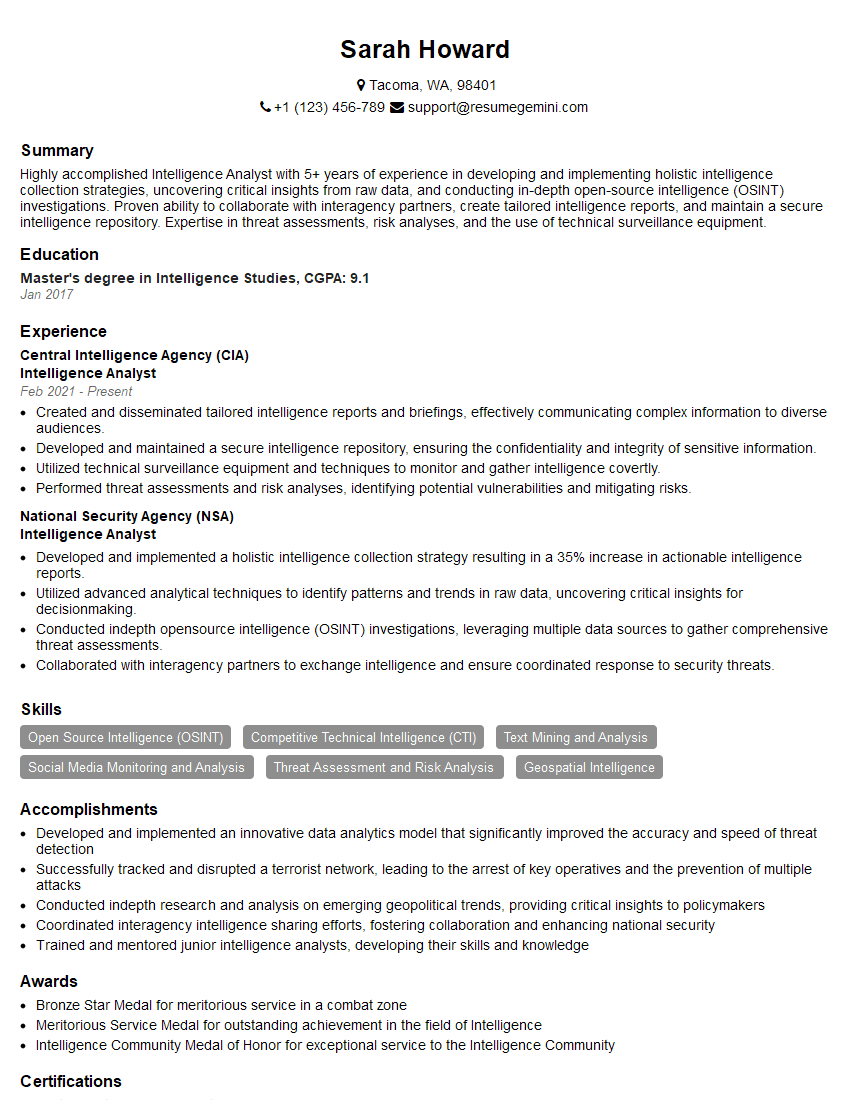
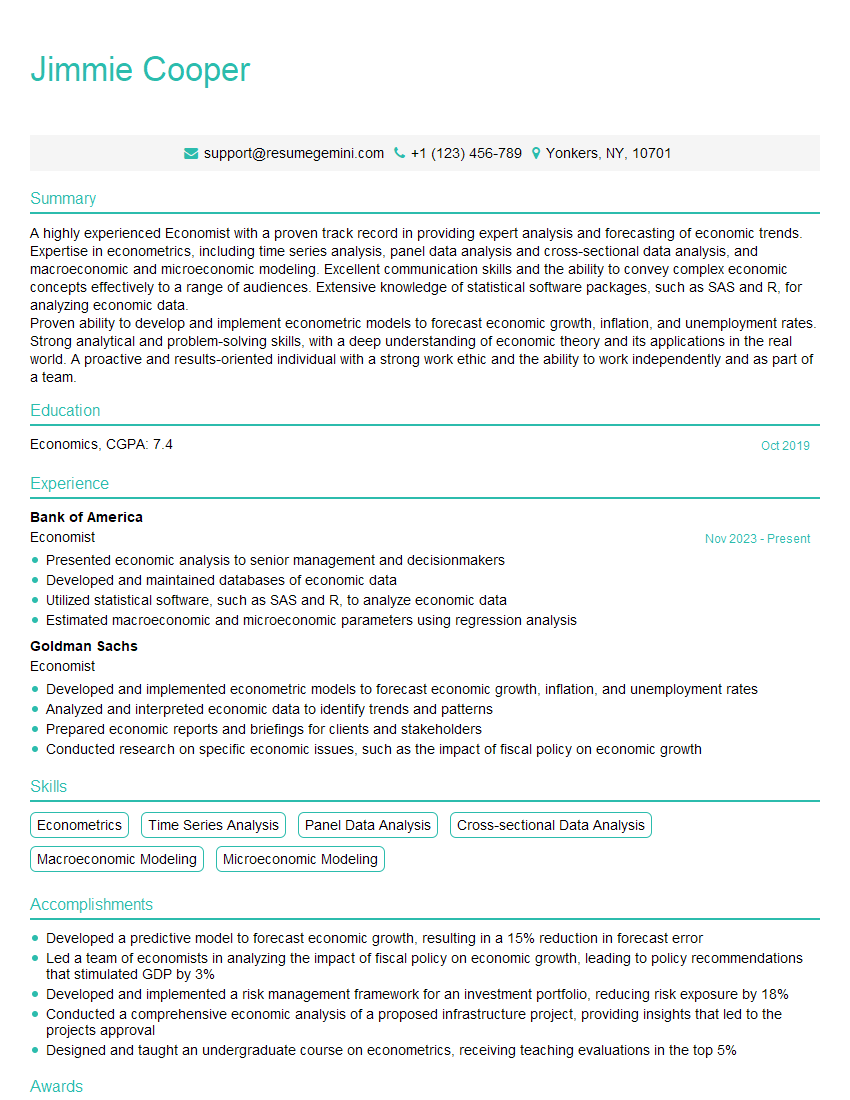
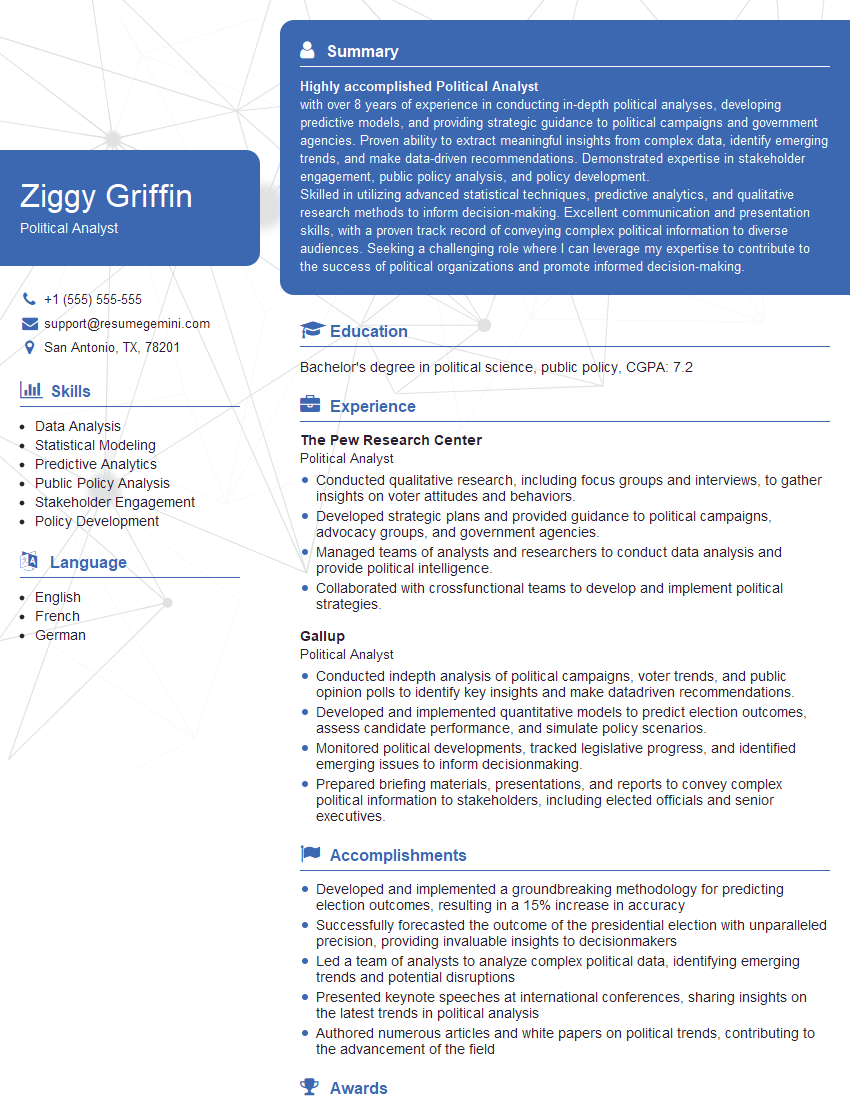
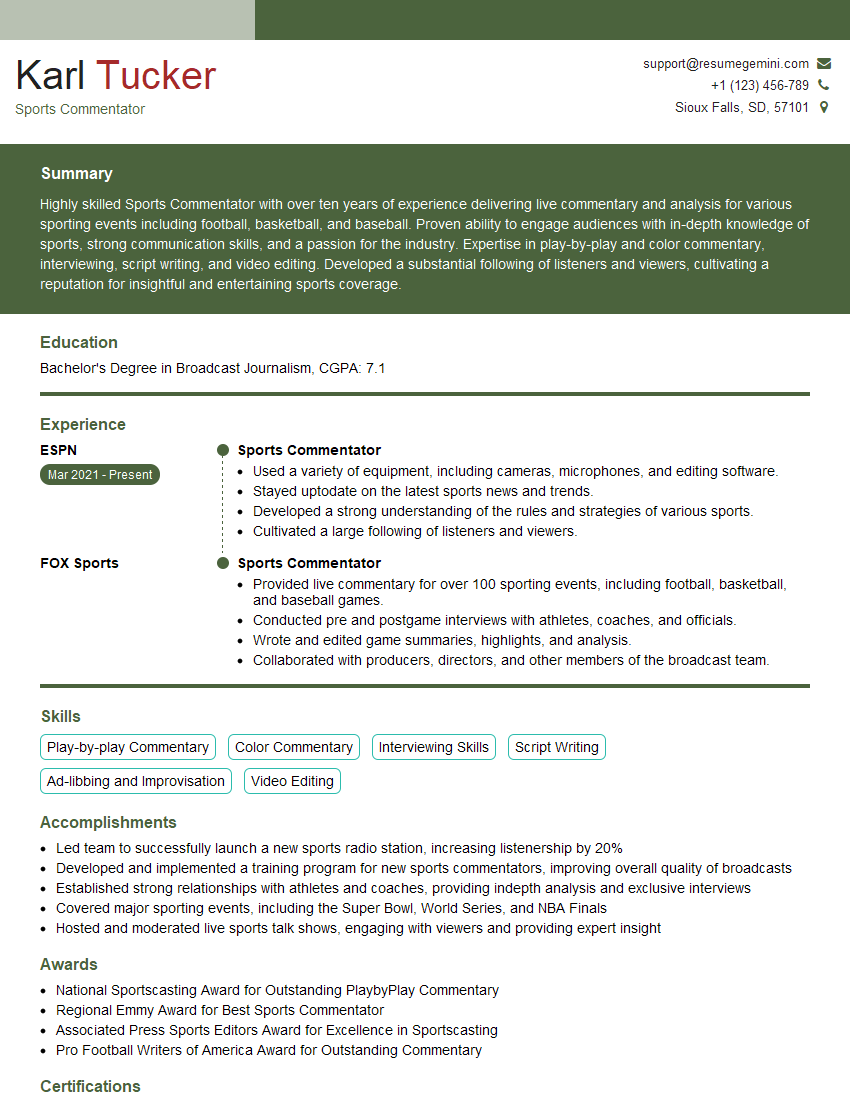
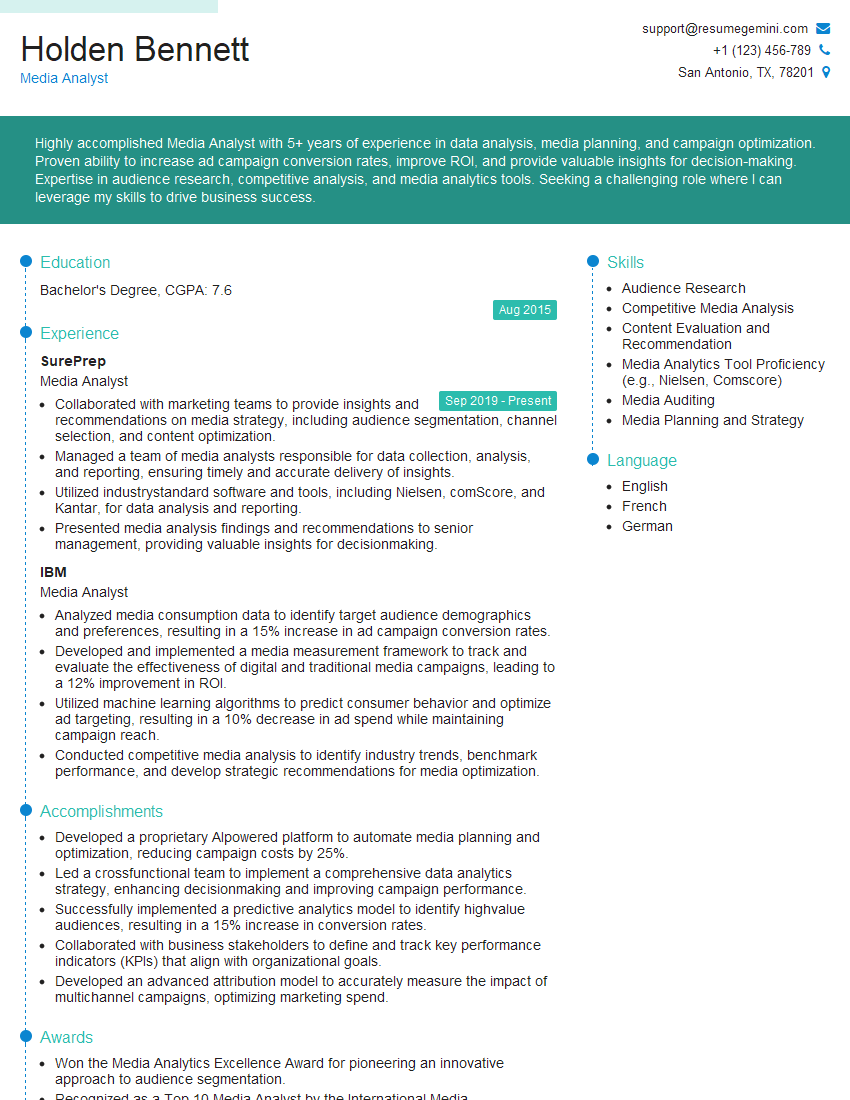
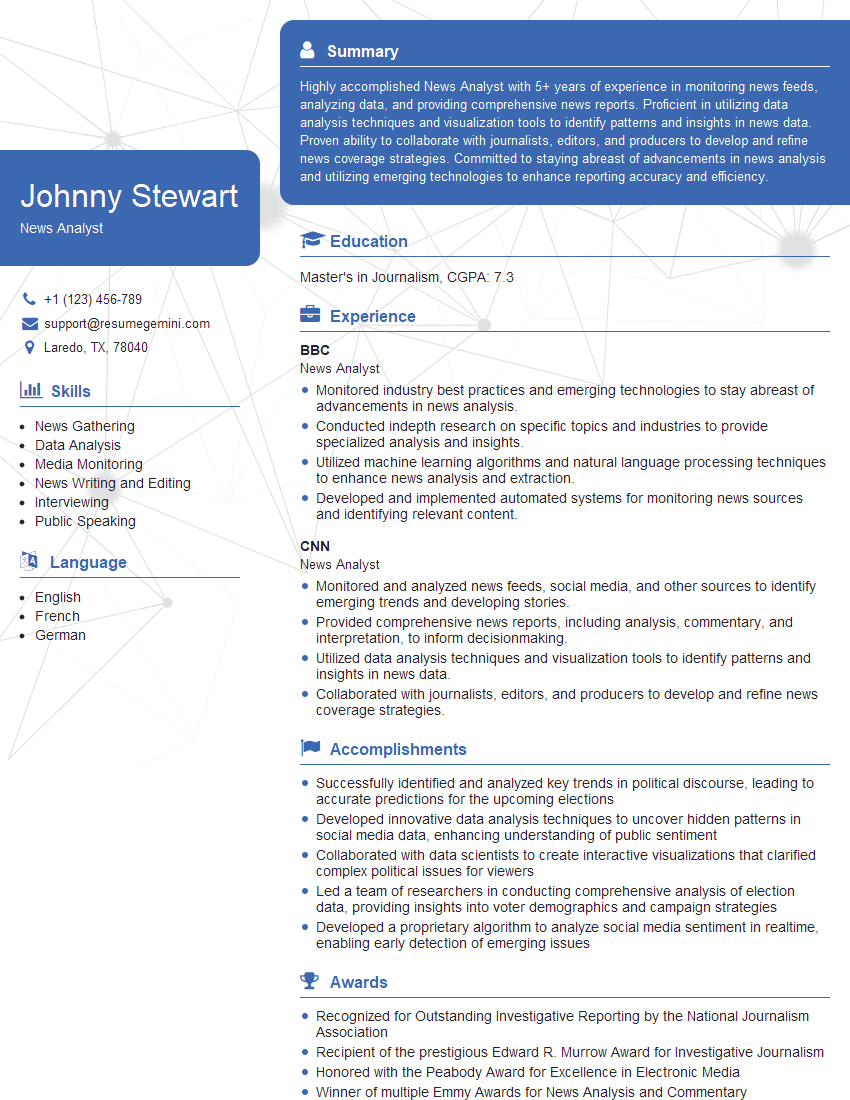
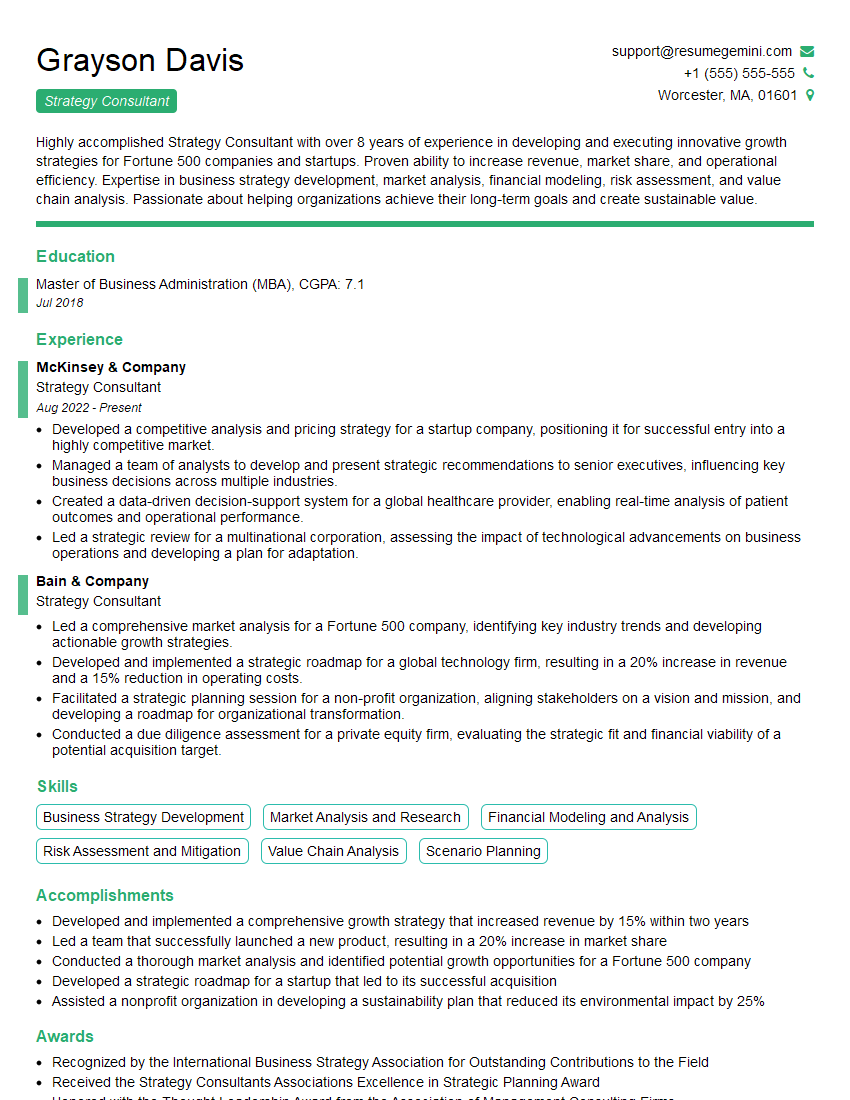
Mastering the art of providing commentary and analysis is crucial for career advancement across many fields. It demonstrates valuable skills employers highly value: critical thinking, problem-solving, and effective communication. To significantly boost your job prospects, crafting a strong, ATS-friendly resume is essential. ResumeGemini is a trusted resource that can help you build a professional and impactful resume. We offer examples of resumes tailored to showcasing expertise in Providing Commentary and Analysis to guide you in creating yours. Take advantage of these resources to highlight your skills and land your dream job.
Explore more articles
Users Rating of Our Blogs
Share Your Experience
We value your feedback! Please rate our content and share your thoughts (optional).
What Readers Say About Our Blog
Hello,
We found issues with your domain’s email setup that may be sending your messages to spam or blocking them completely. InboxShield Mini shows you how to fix it in minutes — no tech skills required.
Scan your domain now for details: https://inboxshield-mini.com/
— Adam @ InboxShield Mini
Reply STOP to unsubscribe
Hi, are you owner of interviewgemini.com? What if I told you I could help you find extra time in your schedule, reconnect with leads you didn’t even realize you missed, and bring in more “I want to work with you” conversations, without increasing your ad spend or hiring a full-time employee?
All with a flexible, budget-friendly service that could easily pay for itself. Sounds good?
Would it be nice to jump on a quick 10-minute call so I can show you exactly how we make this work?
Best,
Hapei
Marketing Director
Hey, I know you’re the owner of interviewgemini.com. I’ll be quick.
Fundraising for your business is tough and time-consuming. We make it easier by guaranteeing two private investor meetings each month, for six months. No demos, no pitch events – just direct introductions to active investors matched to your startup.
If youR17;re raising, this could help you build real momentum. Want me to send more info?
Hi, I represent an SEO company that specialises in getting you AI citations and higher rankings on Google. I’d like to offer you a 100% free SEO audit for your website. Would you be interested?
Hi, I represent an SEO company that specialises in getting you AI citations and higher rankings on Google. I’d like to offer you a 100% free SEO audit for your website. Would you be interested?
good


