Preparation is the key to success in any interview. In this post, we’ll explore crucial Research Techniques and Design interview questions and equip you with strategies to craft impactful answers. Whether you’re a beginner or a pro, these tips will elevate your preparation.
Questions Asked in Research Techniques and Design Interview
Q 1. Explain the difference between qualitative and quantitative research methods.
Qualitative and quantitative research methods represent two distinct approaches to investigating research questions. Think of it like this: qualitative research is about understanding the why behind phenomena, while quantitative research focuses on measuring and quantifying those phenomena.
- Qualitative Research: This approach explores complex social phenomena through in-depth analysis of textual or visual data. It often uses methods like interviews, focus groups, and observations to gather rich, descriptive data. The goal is to gain a deep understanding of experiences, perspectives, and meanings. For example, a qualitative study might explore the lived experiences of patients with a chronic illness, aiming to understand their coping mechanisms and emotional responses.
- Quantitative Research: This approach relies on numerical data and statistical analysis to establish relationships between variables. It often uses surveys, experiments, and structured observations to collect data. The goal is to test hypotheses, establish correlations, and make generalizations about a population. For example, a quantitative study might examine the relationship between hours of sleep and academic performance in college students, using statistical tests to determine the strength and significance of the correlation.
In short, qualitative research prioritizes depth of understanding, while quantitative research prioritizes breadth and generalizability.
Q 2. Describe the process of developing a research hypothesis.
Developing a strong research hypothesis is a crucial step in any research project. A hypothesis is a testable statement that predicts a relationship between two or more variables. The process generally involves these steps:
- Review the literature: Thoroughly examine existing research on your topic to identify gaps in knowledge and potential areas for investigation.
- Identify your variables: Clearly define the independent variable (the variable you manipulate or observe) and the dependent variable (the variable you measure). For example, in a study on the effect of exercise on stress levels, exercise would be the independent variable and stress levels would be the dependent variable.
- Formulate a tentative explanation: Based on your literature review and understanding of the variables, propose a tentative explanation for the relationship between them. This explanation should be based on logical reasoning and existing theories.
- State your hypothesis: Express your tentative explanation as a clear, concise, and testable statement. This statement should predict the direction of the relationship between variables. For instance: “Participants who engage in regular exercise will report significantly lower levels of stress compared to participants who do not.”
- Refine your hypothesis: Based on feedback and further investigation, refine your hypothesis to ensure it is precise, testable, and aligned with your research goals.
A well-defined hypothesis guides the entire research process, ensuring that data collection and analysis are focused and efficient. It provides a framework for interpreting your findings and drawing conclusions.
Q 3. What are the strengths and weaknesses of different sampling techniques?
Sampling techniques are crucial for selecting representative subsets of a population for study. Different techniques offer various strengths and weaknesses.
- Simple Random Sampling: Every member of the population has an equal chance of being selected. Strengths: Unbiased, easy to understand. Weaknesses: Requires a complete list of the population, can be impractical for large populations.
- Stratified Random Sampling: The population is divided into strata (subgroups), and random samples are drawn from each stratum. Strengths: Ensures representation from all subgroups. Weaknesses: Requires knowledge of population strata, can be complex.
- Cluster Sampling: The population is divided into clusters (e.g., geographic areas), and a random sample of clusters is selected. Strengths: Cost-effective for large, geographically dispersed populations. Weaknesses: Higher sampling error compared to simple random sampling.
- Convenience Sampling: Selecting readily available participants. Strengths: Easy and inexpensive. Weaknesses: Highly susceptible to bias, lacks generalizability.
- Snowball Sampling: Participants refer other potential participants. Strengths: Useful for hard-to-reach populations. Weaknesses: Prone to bias, limited generalizability.
The choice of sampling technique depends on the research question, resources, and the nature of the population. It’s crucial to carefully consider the potential biases and limitations of each technique before making a decision.
Q 4. How do you ensure the validity and reliability of your research findings?
Ensuring the validity and reliability of research findings is paramount. Validity refers to the accuracy of the findings – are we measuring what we intend to measure? Reliability refers to the consistency of the findings – would we get similar results if we repeated the study?
- Validity: Strategies to enhance validity include using well-validated instruments, employing rigorous research designs (like experimental designs), carefully defining variables, and using triangulation (comparing findings from different data sources). For instance, in a survey, using established scales for measuring constructs like self-esteem enhances construct validity.
- Reliability: To improve reliability, researchers can use standardized procedures, train raters thoroughly (in observational studies), employ multiple measures of the same construct, and use statistical techniques to assess internal consistency and test-retest reliability. For example, high Cronbach’s alpha in a questionnaire indicates good internal consistency reliability.
Both validity and reliability are crucial for producing credible and trustworthy research that can inform decision-making and contribute to the advancement of knowledge.
Q 5. Explain the concept of experimental design and its importance.
Experimental design is a powerful research method used to establish cause-and-effect relationships between variables. It involves manipulating an independent variable and observing its effect on a dependent variable, while controlling for extraneous variables. Think of it like a controlled experiment where you systematically change one thing (independent variable) to see its impact on something else (dependent variable).
- Key Elements: An experimental design typically includes a control group (not receiving the treatment) and an experimental group (receiving the treatment). Random assignment of participants to groups is crucial to minimize bias.
- Types: There are various experimental designs, including pre-experimental, true experimental (e.g., posttest-only, pretest-posttest), and quasi-experimental designs (used when random assignment is not feasible).
- Importance: Experimental designs allow researchers to draw strong causal inferences, exceeding the correlational relationships that can be demonstrated through observational studies. They are essential in fields such as medicine, psychology, and education for evaluating the effectiveness of interventions.
For example, a researcher might design an experiment to test the effectiveness of a new drug by randomly assigning participants to a drug group and a placebo group. By comparing the outcomes, the researcher can determine if the drug causes a statistically significant improvement.
Q 6. What are some common threats to internal and external validity?
Threats to internal and external validity can compromise the accuracy and generalizability of research findings. Internal validity refers to the extent to which the study’s results accurately reflect the relationships between variables within the study itself, while external validity refers to the generalizability of the findings to other populations, settings, and times.
- Threats to Internal Validity:
- History: External events occurring during the study.
- Maturation: Changes within participants over time.
- Testing: Repeated testing affecting performance.
- Instrumentation: Changes in measurement instruments.
- Regression to the mean: Extreme scores tending towards the average.
- Selection bias: Non-equivalent groups at the start.
- Threats to External Validity:
- Selection bias: The sample is not representative of the population.
- Setting: The results may not generalize to other settings.
- History: The results may not generalize to other time periods.
- Reactive effects of testing: Pretesting may influence participants’ responses to the treatment.
Addressing these threats requires careful planning and execution of the research, including using appropriate control groups, random assignment, and considering the limitations of the study when interpreting results.
Q 7. Describe your experience with data analysis techniques.
My experience with data analysis techniques is extensive, encompassing both qualitative and quantitative methods. In quantitative research, I am proficient in using statistical software packages like SPSS and R to perform a range of analyses including:
- Descriptive statistics: Calculating means, standard deviations, frequencies, etc., to summarize data.
- Inferential statistics: Employing t-tests, ANOVA, correlation analysis, regression analysis, and chi-square tests to test hypotheses and draw inferences about populations.
- Factor analysis: Reducing the number of variables while retaining essential information.
In qualitative research, I have experience with thematic analysis, grounded theory, and content analysis to identify patterns and themes within textual and visual data. I use qualitative data analysis software such as NVivo to manage and analyze large datasets. I am also experienced in mixed-methods analysis, integrating both quantitative and qualitative data to obtain a comprehensive understanding of a research problem. For instance, I have used regression analysis to identify key predictors of an outcome and then conducted qualitative interviews to explore the mechanisms underlying those relationships. This allows for a deeper understanding than either method provides alone.
Q 8. How do you handle missing data in your research?
Missing data is a common challenge in research. The best approach depends on the type of missing data (missing completely at random (MCAR), missing at random (MAR), or missing not at random (MNAR)) and the extent of the missingness. Ignoring missing data can lead to biased results, so careful consideration is crucial.
Imputation: This involves filling in missing values with plausible estimates. Methods include mean/median imputation (simple but can distort variance), regression imputation (uses other variables to predict missing values), and multiple imputation (creates several plausible datasets and combines results).
Deletion: Listwise deletion (removing entire cases with any missing data) is simple but can lead to substantial data loss, especially with many variables. Pairwise deletion (using available data for each analysis) can lead to inconsistent results. These methods are generally less preferred unless the amount of missing data is minimal and MCAR can be reasonably assumed.
Maximum Likelihood Estimation (MLE) and Full Information Maximum Likelihood (FIML): These are statistical techniques that use all available information to estimate parameters without explicitly imputing missing values. FIML is particularly useful for handling MAR data and is often implemented in structural equation modeling.
Data analysis methods designed for incomplete data: Some statistical methods such as multiple imputation are explicitly designed to handle missing data effectively, reducing bias associated with simple imputation strategies.
For example, in a study on student performance, if some students missed a particular question on a test, imputation methods like regression imputation could use other test scores to predict the missing response. The choice of method hinges on the nature of the missing data and the goals of the analysis. Always document the approach used and acknowledge the potential limitations.
Q 9. What statistical software are you proficient in?
I’m proficient in several statistical software packages, including R, SPSS, and Stata. R, with its extensive libraries (like ggplot2 for visualization and lme4 for mixed-effects models), provides unparalleled flexibility and power for complex analyses. SPSS offers a user-friendly interface suitable for a wider range of users, making it ideal for tasks requiring less coding. Stata is also robust, especially for longitudinal and time-series data. My choice of software depends on the specific research question and the dataset’s characteristics.
# Example R code for a simple linear regression model <- lm(y ~ x, data = mydata) summary(model)Q 10. How do you select appropriate statistical tests for your data?
Selecting the appropriate statistical test involves considering several factors: the type of data (nominal, ordinal, interval, ratio), the research question (e.g., comparing groups, examining relationships), and the assumptions of the test (e.g., normality, independence). There's no one-size-fits-all answer; it requires careful judgment.
For comparing means: Independent samples t-test (two independent groups), paired samples t-test (two related groups), ANOVA (three or more groups).
For examining relationships: Pearson correlation (continuous variables), Spearman correlation (ordinal or non-normally distributed variables), chi-square test (categorical variables).
For comparing proportions: Chi-square test, z-test.
Before choosing a test, it's essential to assess the data for violations of assumptions. For example, a t-test assumes normality, which can be checked visually with histograms or quantile-quantile plots, or formally using tests like the Shapiro-Wilk test. If assumptions are violated, non-parametric alternatives might be more appropriate (e.g., Mann-Whitney U test instead of independent samples t-test). Choosing the right test is vital for ensuring the validity and reliability of the results.
Q 11. Explain the concept of p-value and its interpretation.
The p-value represents the probability of obtaining the observed results (or more extreme results) if there were no real effect (null hypothesis is true). It's not the probability that the null hypothesis is true. A small p-value (typically below a significance level, often 0.05) suggests that the observed results are unlikely to have occurred by chance alone, providing evidence against the null hypothesis. However, a large p-value does not necessarily prove the null hypothesis; it simply means there isn't enough evidence to reject it.
Interpretation:
p < 0.05: Often interpreted as statistically significant, suggesting strong evidence against the null hypothesis.
p > 0.05: Not statistically significant; there is insufficient evidence to reject the null hypothesis.
It's crucial to consider the p-value in conjunction with effect size (the magnitude of the observed effect) and the context of the study. A small p-value with a tiny effect size might be practically meaningless. The focus should be on the size of the effect, not solely on the p-value's significance.
Q 12. What is the difference between correlation and causation?
Correlation describes the relationship between two variables – how they change together. Causation implies that one variable directly influences or causes a change in another. Correlation doesn't imply causation. Just because two variables are correlated doesn't mean one causes the other; there could be a third, unmeasured variable influencing both (confounding variable), or the relationship could be coincidental.
Example: Ice cream sales and crime rates are often positively correlated; they both tend to be higher during the summer. However, this doesn't mean eating ice cream causes crime. The underlying cause is the summer heat.
Q 13. Describe your experience with qualitative data analysis methods (e.g., thematic analysis).
I have extensive experience with qualitative data analysis, particularly thematic analysis. Thematic analysis involves identifying, analyzing, and reporting patterns (themes) within data. It's an iterative process that typically involves:
Familiarization with data: Reading and rereading transcripts or other data sources to gain a general understanding.
Generating initial codes: Identifying key words, phrases, or ideas that represent important aspects of the data.
Searching for themes: Grouping similar codes together to form broader themes.
Reviewing themes: Refining and refining themes, ensuring they accurately represent the data.
Defining and naming themes: Assigning clear and concise names to the themes.
Writing up the analysis: Presenting the findings in a clear and organized manner, providing supporting data excerpts.
Software such as NVivo can assist in managing and analyzing large qualitative datasets, facilitating the coding and theme identification processes. I have used thematic analysis in various projects, including research on patient experiences, organizational culture, and social media discourse.
Q 14. How do you ensure ethical considerations in your research?
Ethical considerations are paramount in research. My approach involves:
Informed consent: Participants must be fully informed about the study's purpose, procedures, risks, and benefits before participating and must provide their voluntary consent.
Confidentiality and anonymity: Protecting participants' identities and data through techniques like data anonymization and secure data storage.
Data integrity and accuracy: Ensuring data is collected and analyzed accurately and honestly.
Avoiding bias: Being mindful of potential biases and taking steps to mitigate them.
Beneficence and non-maleficence: Maximizing benefits and minimizing harm to participants.
Justice and fairness: Ensuring equitable access to the benefits of research and avoiding discrimination.
Institutional Review Board (IRB) approval: Seeking approval from an IRB before conducting any research involving human subjects.
Ethical considerations are integrated throughout the research process, from study design to data analysis and reporting. It's crucial to adhere to ethical guidelines and regulations to ensure the responsible conduct of research and protect the rights and well-being of participants.
Q 15. Explain the concept of research bias and how to mitigate it.
Research bias refers to systematic errors that can skew the results of a study, leading to inaccurate conclusions. It's like looking at a photograph through a smudged lens – you're not seeing the true picture. These errors can be introduced at any stage of the research process, from the design phase to data analysis and interpretation.
There are many types of bias, including:
- Selection bias: occurs when the sample chosen doesn't accurately represent the population you're studying.
- Confirmation bias: researchers may unconsciously favor information that confirms their pre-existing beliefs.
- Observer bias: occurs when the researcher's expectations influence their observations or interpretations of data.
- Publication bias: studies with positive results are more likely to be published than those with negative or null results.
Mitigating research bias requires careful planning and rigorous methodology. Key strategies include:
- Randomization: Randomly assigning participants to different groups helps to minimize selection bias.
- Blinding: Keeping participants and researchers unaware of treatment assignments (in experimental studies) reduces observer bias.
- Standardized procedures: using clear, well-defined protocols ensures consistency and reduces variability.
- Triangulation: using multiple data sources and methods to confirm findings.
- Peer review: having independent experts review the study design and results can help identify potential biases.
- Pre-registration: Registering study protocols beforehand can help prevent post-hoc hypothesis modification.
For example, in a study investigating the effectiveness of a new drug, blinding participants and researchers to treatment assignment would be crucial to prevent observer bias from influencing the assessment of treatment effects.
Career Expert Tips:
- Ace those interviews! Prepare effectively by reviewing the Top 50 Most Common Interview Questions on ResumeGemini.
- Navigate your job search with confidence! Explore a wide range of Career Tips on ResumeGemini. Learn about common challenges and recommendations to overcome them.
- Craft the perfect resume! Master the Art of Resume Writing with ResumeGemini's guide. Showcase your unique qualifications and achievements effectively.
- Don't miss out on holiday savings! Build your dream resume with ResumeGemini's ATS optimized templates.
Q 16. Describe your experience with literature reviews.
Conducting thorough literature reviews is fundamental to my research process. I approach it systematically, starting with defining my research question to identify key terms and concepts. Then, I use a combination of databases like PubMed, Web of Science, and Google Scholar to locate relevant articles, books, and other sources. My search strategy includes using both keywords and subject headings, along with Boolean operators to refine my search.
Beyond simply identifying relevant literature, I critically evaluate the quality of each source, considering its methodology, sample size, and potential biases. I then synthesize the information, highlighting key findings, controversies, and gaps in existing knowledge. This synthesized information forms the foundation for developing my own research hypotheses and methodology.
For instance, during my work on [mention a past project or area of research], I conducted an extensive literature review on [topic] involving over 100 peer-reviewed articles. This review revealed a significant gap in research on [specific gap], prompting my subsequent research study.
Q 17. How do you formulate research questions?
Formulating compelling research questions is the cornerstone of any successful research project. It's a process that begins with identifying a broad area of interest and progressively refining it into specific, testable questions.
I typically follow these steps:
- Identify a broad area of interest: Start with a topic that genuinely interests you and has practical or theoretical significance.
- Conduct preliminary research: Explore existing literature to understand the current state of knowledge and identify gaps or controversies.
- Refine your focus: Narrow down your broad interest into a specific, manageable research question.
- Consider the feasibility: Ensure the question can be answered within available resources (time, budget, access to data).
- Formulate clear and concise questions: The questions should be specific, measurable, achievable, relevant, and time-bound (SMART).
A poorly formulated question can lead to a confusing and ultimately unproductive research project. For example, instead of asking 'What is the effect of social media on teenagers?', a better, more specific question might be: 'What is the relationship between daily Instagram usage and self-esteem among adolescent girls aged 13-15?'
Q 18. What is your preferred method for presenting research findings?
My preferred method for presenting research findings depends on the audience and the nature of the research. However, I prioritize clarity, accuracy, and accessibility. I typically use a combination of methods to effectively communicate the results.
For academic audiences, I prefer peer-reviewed journal articles, employing a structured format including an abstract, introduction, methods, results, discussion, and conclusion sections. Within the results section, I use tables and figures to visually represent complex data sets. The discussion section provides a critical interpretation of findings in relation to existing literature.
For broader audiences, presentations with clear visuals, concise language, and engaging narratives are effective. I also utilize infographics or short videos for disseminating research to the public or stakeholders. The key is to tailor the presentation format to the audience's needs and understanding.
Q 19. Explain the importance of pilot testing in research.
Pilot testing is a crucial step in research, often overlooked but essential for ensuring the success of a larger study. Think of it as a dress rehearsal before the main performance. It allows researchers to identify and address potential problems with the study design, methods, and data collection procedures *before* investing significant time and resources into the main study.
Pilot testing can reveal issues such as:
- Problems with the instrument: Ambiguous questions in surveys, unreliable equipment, etc.
- Recruitment challenges: Difficulties in finding participants or obtaining consent.
- Data collection issues: Inefficient procedures, missing data, etc.
- Unforeseen logistical challenges: Technical glitches, resource limitations, etc.
By identifying and addressing these issues early on, pilot testing can improve the quality, efficiency, and validity of the main study, ultimately saving time, money, and effort.
In my experience, a small-scale pilot study prior to a large-scale epidemiological survey helped us identify issues with participant comprehension of the survey questions, allowing us to revise the instrument and improve the response rate in the main study.
Q 20. How do you determine the appropriate sample size for your research?
Determining the appropriate sample size is critical for ensuring the statistical power of a study. A sample that is too small may not be able to detect statistically significant effects, while a sample that is too large may be unnecessarily expensive and time-consuming.
Several factors influence sample size determination, including:
- The type of research design: Experimental designs often require smaller samples than observational studies.
- The effect size: Larger effect sizes require smaller samples to detect significant differences.
- The desired level of statistical power: Typically, 80% power is considered adequate.
- The significance level (alpha): The probability of rejecting the null hypothesis when it is true (typically set at 0.05).
There are statistical software packages and online calculators that can assist in calculating sample size based on these factors. The input parameters required would typically include: the desired power (e.g., 80%), significance level (e.g., 0.05), effect size (e.g., Cohen's d), and the number of groups being compared. For instance, G*Power is a frequently used free software for power analysis.
Ignoring these factors can lead to inconclusive results or wasted resources. Careful consideration of sample size is crucial for drawing reliable conclusions from research.
Q 21. Describe your experience with different types of research designs (e.g., experimental, quasi-experimental, correlational).
I have extensive experience with various research designs, each with its strengths and limitations. The choice of design depends heavily on the research question and the resources available.
- Experimental designs: These designs involve manipulating an independent variable to observe its effect on a dependent variable, allowing for causal inferences. Random assignment to different groups (treatment and control) is a key feature. Examples include randomized controlled trials (RCTs), which are the gold standard in evaluating medical interventions.
- Quasi-experimental designs: These designs resemble experimental designs but lack random assignment. This limits the ability to make strong causal inferences but may be necessary when random assignment is not feasible. Examples include interrupted time series designs, which track a dependent variable over time before and after an intervention.
- Correlational designs: These designs explore the relationship between two or more variables without manipulating any variables. They can identify associations but do not establish causality. For instance, a correlational study might explore the relationship between hours of sleep and academic performance.
In my previous work, I utilized a quasi-experimental design to assess the impact of a new teaching method on student learning outcomes in a specific school district. Random assignment was not possible due to logistical constraints, but careful matching of comparison groups helped to control for confounding variables. Another study utilized a correlational design to explore the relationship between socioeconomic status and access to healthcare, revealing a significant association that led to policy implications.
Q 22. What is your experience with mixed methods research?
Mixed methods research is a powerful approach that combines both qualitative and quantitative research methods within a single study. It leverages the strengths of each approach to provide a more comprehensive and nuanced understanding of a research problem than either method could achieve alone. For example, quantitative methods might involve surveys to gather numerical data on attitudes, while qualitative methods, such as interviews, could explore the reasons behind those attitudes in more depth. I've extensively used mixed methods in my work, employing various designs like explanatory sequential, exploratory sequential, and convergent parallel designs, depending on the research question and its context. In one project investigating employee engagement, we used quantitative data from surveys to measure engagement levels and then used qualitative interviews to understand the underlying factors contributing to high or low engagement scores. This allowed us to paint a much richer picture than either approach could have provided individually.
Q 23. How do you manage your time and resources effectively in a research project?
Effective time and resource management in research is crucial. I utilize a project management approach that involves several key strategies. First, I create a detailed project plan with clearly defined milestones and deadlines. This plan includes allocating specific timeframes for each stage of the research process, from literature review to data analysis and report writing. Second, I prioritize tasks based on their importance and urgency, often using tools like Gantt charts to visualize progress and identify potential bottlenecks. Third, I actively manage resources, including budget allocation, personnel management, and securing necessary equipment or software. Regular monitoring of progress and adjustments to the plan as needed are essential. Finally, effective communication with stakeholders is vital to ensure everyone is aligned with the project goals and timeline. This structured approach ensures projects are completed efficiently and within budget.
Q 24. Describe a challenging research project you worked on and how you overcame obstacles.
One challenging project involved researching the impact of a new educational program on student learning outcomes. The initial challenge was the lack of a standardized measurement tool for the specific skills the program aimed to develop. To overcome this, I collaborated with educational psychologists to develop a reliable and valid assessment instrument. Another significant hurdle was the difficulty in recruiting a diverse and representative sample of students. We addressed this by partnering with multiple schools and employing targeted recruitment strategies, including outreach to underrepresented groups. Finally, analyzing the complex dataset required advanced statistical techniques, which demanded significant time and expertise. To manage this, I engaged a statistical consultant and employed robust data analysis methods. The successful completion of this project underscored the importance of proactive problem-solving, collaboration, and adaptability in overcoming research obstacles.
Q 25. How do you stay current with the latest research methodologies and techniques?
Staying current in research methodologies and techniques is a continuous process. I regularly review leading academic journals in my field, attend conferences and workshops, and participate in online professional development courses. I also actively engage with research networks and communities, which often involve discussions and collaborations with leading researchers. Furthermore, I frequently explore new software and tools relevant to data analysis and visualization. This multifaceted approach ensures I'm abreast of the latest advancements and can integrate them into my own research practices. It's like constantly updating software – neglecting it leads to obsolescence. Staying updated ensures my work remains cutting-edge and relevant.
Q 26. Explain the difference between descriptive, exploratory, and explanatory research.
These three research approaches differ significantly in their purpose and methodology:
- Descriptive research aims to describe the characteristics of a population or phenomenon. It focuses on 'what is' rather than 'why it is'. Think of a census that describes the demographic characteristics of a country. Data collection methods often include surveys and observations.
- Exploratory research investigates a topic or problem that is not well understood. It aims to generate hypotheses or insights rather than testing pre-existing ones. For example, conducting preliminary interviews to understand the factors contributing to customer dissatisfaction before designing a larger quantitative study. Qualitative methods are frequently employed.
- Explanatory research seeks to understand the causal relationships between variables. It aims to answer 'why' questions and test hypotheses. For example, conducting an experiment to determine the effect of a new drug on blood pressure. Quantitative methods are often the primary tool.
Think of it as a progression: descriptive research lays the groundwork, exploratory research explores potential explanations, and explanatory research tests those explanations.
Q 27. What are your strengths and weaknesses as a researcher?
My strengths lie in my analytical skills, my ability to design and execute rigorous research projects, and my collaborative spirit. I'm adept at navigating complex datasets and interpreting findings in a meaningful way. I thrive in collaborative environments and enjoy working with diverse teams to achieve common research goals. A weakness I'm actively working on is time management, specifically in balancing multiple projects simultaneously. I'm addressing this by improving my prioritization skills and utilizing project management tools more effectively.
Q 28. Describe your experience with data visualization techniques.
I have extensive experience with various data visualization techniques, utilizing tools like R, Python (with libraries like Matplotlib and Seaborn), and Tableau. My experience encompasses creating various charts and graphs to effectively communicate research findings, including:
- Histograms and box plots for showing data distributions.
- Scatter plots and correlation matrices for illustrating relationships between variables.
- Bar charts and pie charts for comparing categorical data.
- Line graphs for showing trends over time.
- Interactive dashboards to enable exploration of complex datasets.
The choice of visualization technique is crucial; it depends on the type of data and the message I aim to convey. A well-designed visualization can significantly enhance the clarity and impact of research findings, making complex information easily understandable to a wider audience.
Key Topics to Learn for Research Techniques and Design Interview
- Research Paradigms: Understand the differences between qualitative and quantitative research, exploratory, descriptive, and experimental designs, and when to apply each.
- Research Questions & Hypotheses: Formulating clear, concise, and testable research questions and hypotheses; understanding the relationship between them and the research design.
- Sampling Methods: Mastering various sampling techniques (probability vs. non-probability) and their implications for data generalizability and validity.
- Data Collection Methods: Familiarize yourself with diverse methods like surveys, interviews, observations, experiments, and document analysis; know their strengths and weaknesses.
- Data Analysis Techniques: Gain proficiency in appropriate statistical analysis for quantitative data and qualitative data analysis techniques for rich interpretation of qualitative data.
- Ethical Considerations: Demonstrate a strong understanding of ethical principles in research, including informed consent, confidentiality, and data security.
- Research Report Writing: Practice structuring and writing clear, concise, and impactful research reports, including literature reviews, methodology sections, and results interpretation.
- Critical Evaluation of Research: Develop the ability to critically appraise research methodologies and findings, identifying biases and limitations.
- Specific Research Designs: Explore in-depth various research designs like case studies, longitudinal studies, cross-sectional studies, and their practical applications.
- Problem-Solving in Research: Be prepared to discuss how you approach challenges in research, such as dealing with unexpected results or limitations in data.
Next Steps
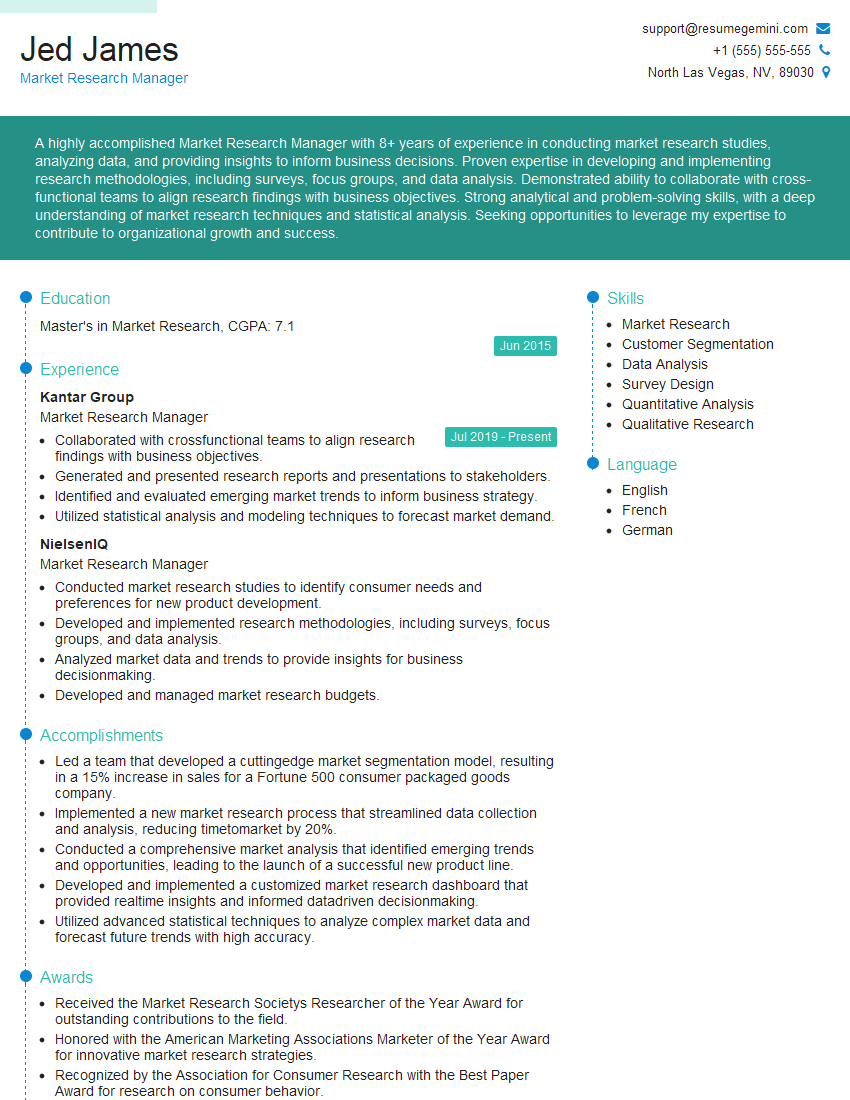
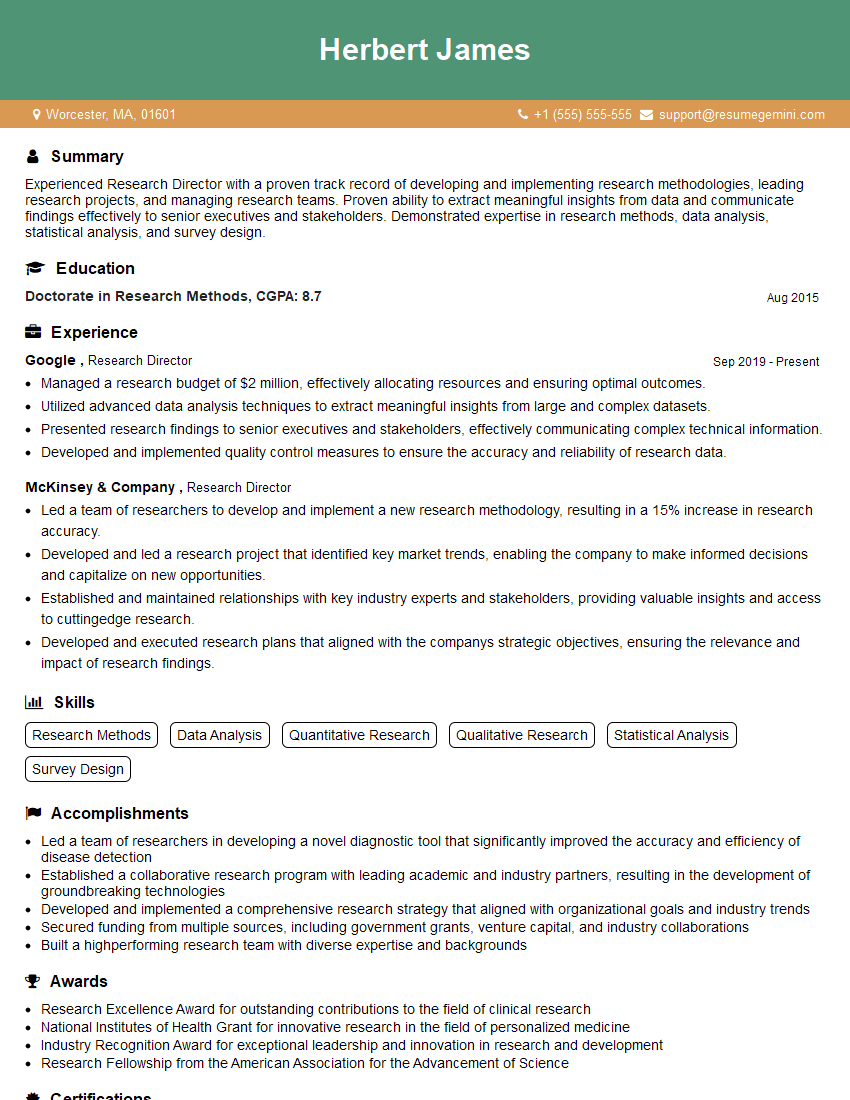
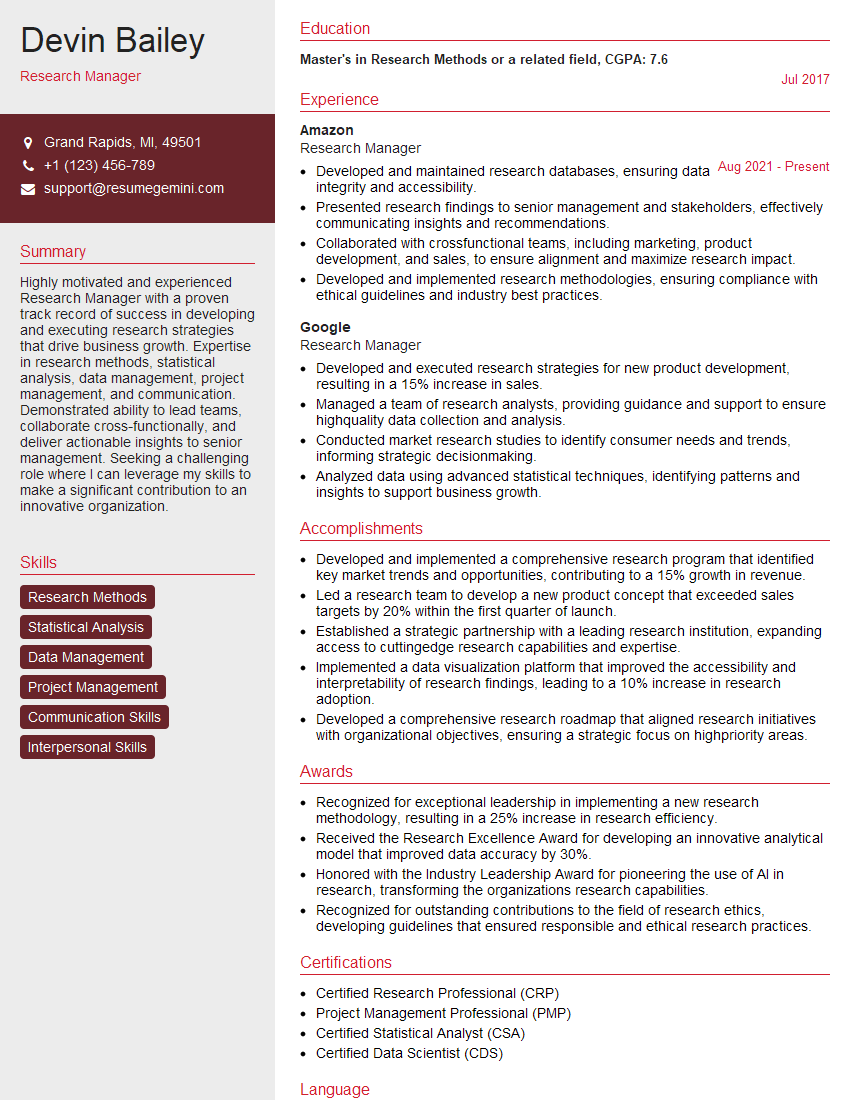
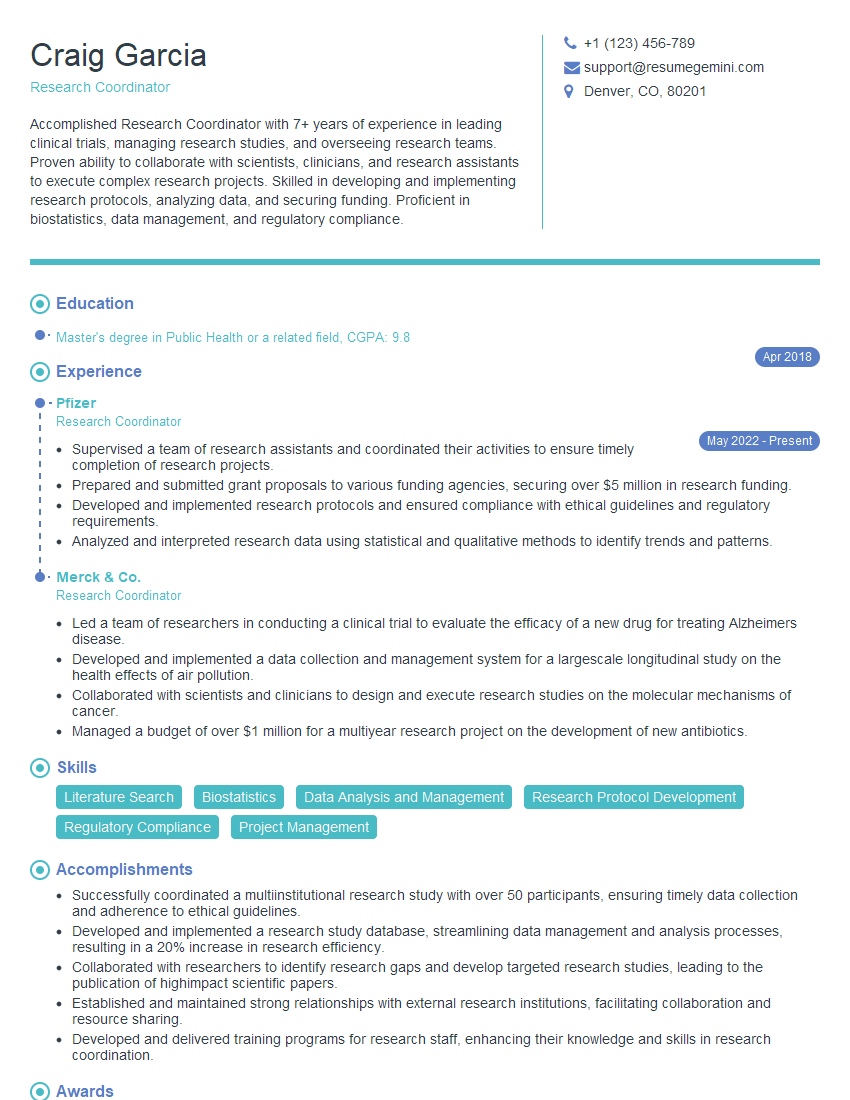
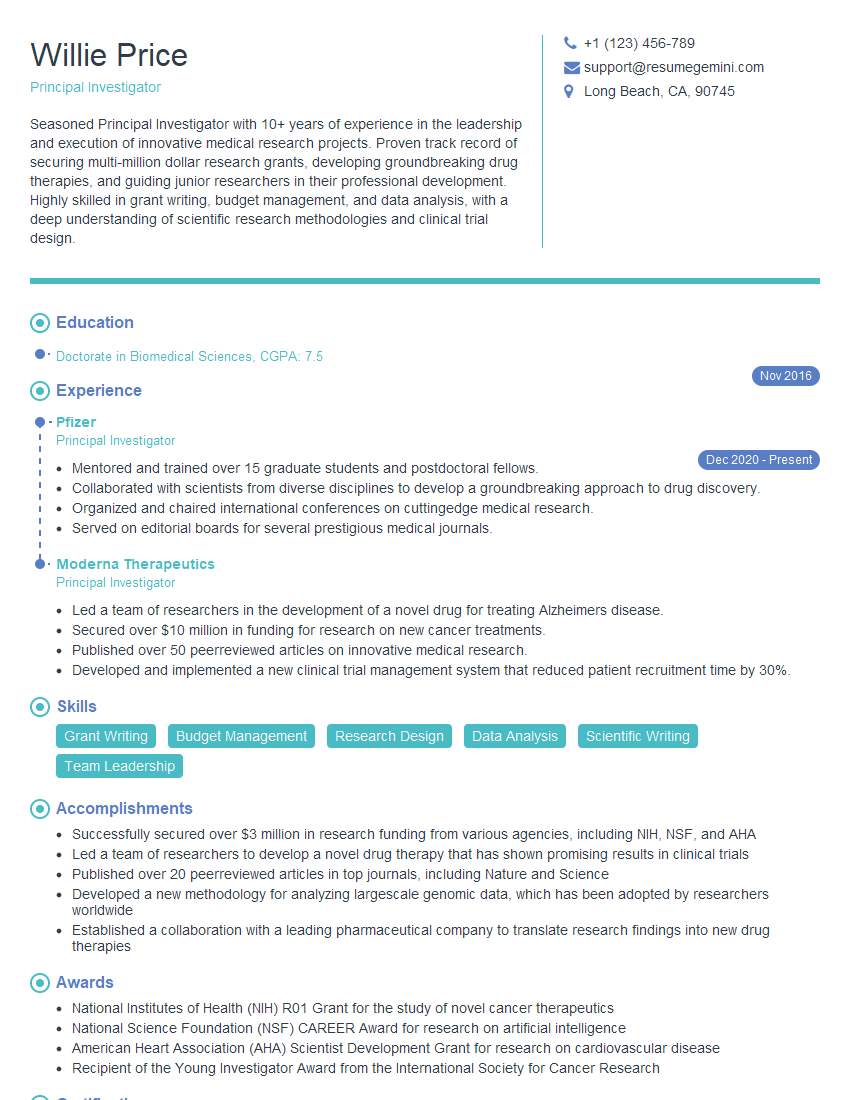
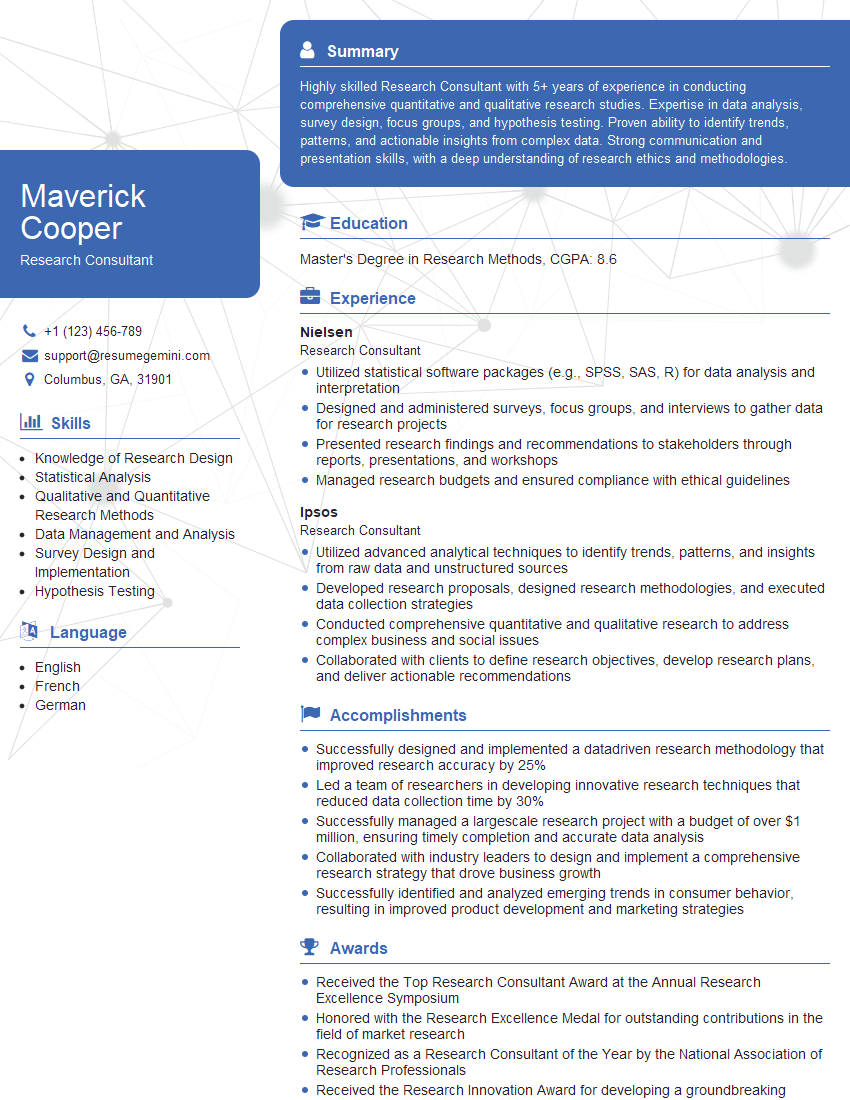
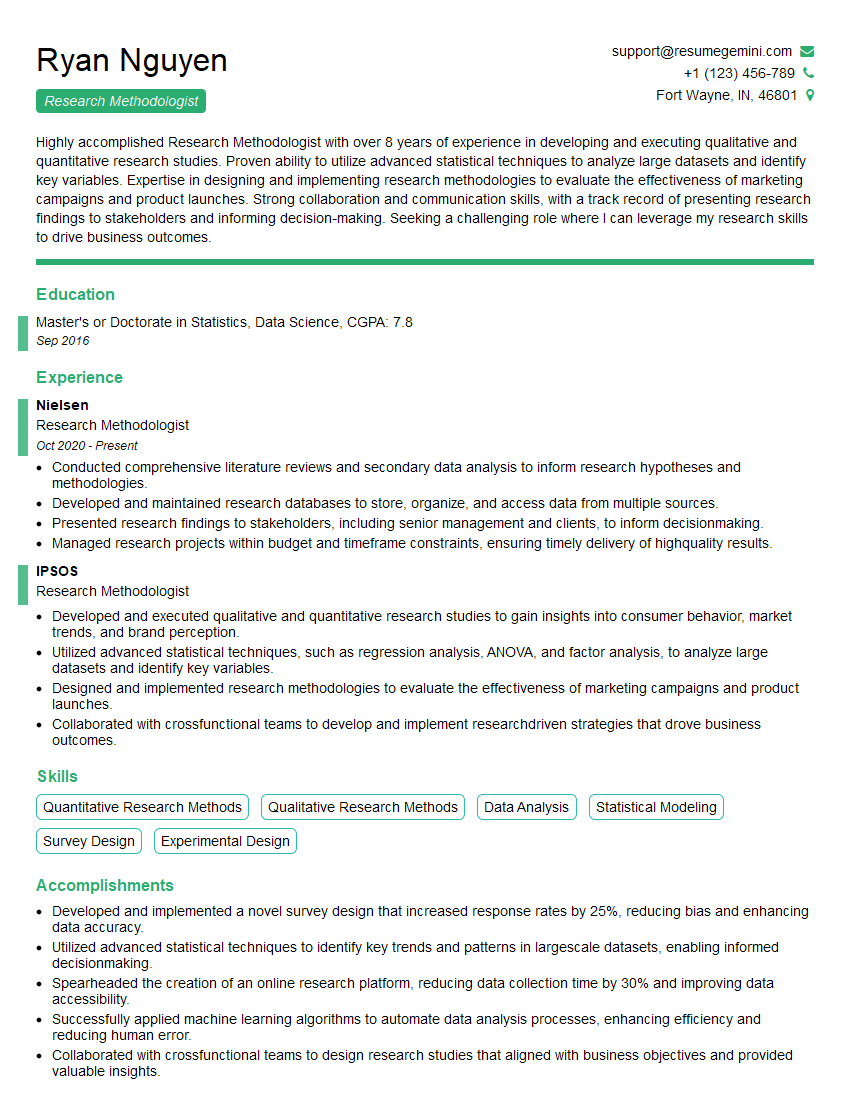
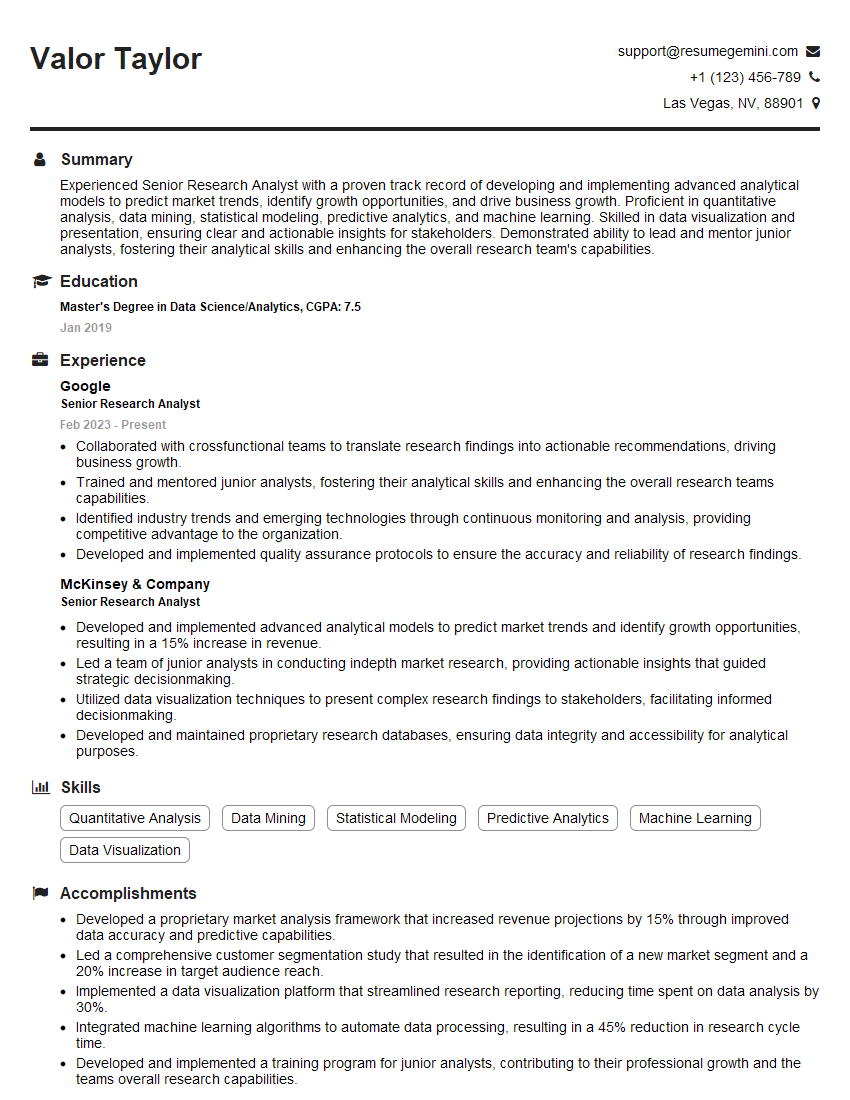
Mastering Research Techniques and Design is crucial for career advancement in many fields. A strong understanding of these principles demonstrates critical thinking, analytical skills, and the ability to contribute meaningfully to research-driven organizations. To stand out, create an ATS-friendly resume that highlights your skills and experience effectively. ResumeGemini is a trusted resource that can help you build a professional and impactful resume. They provide examples of resumes tailored to Research Techniques and Design to guide you in showcasing your qualifications effectively. Take the next step towards your dream career by crafting a resume that truly reflects your expertise.
Explore more articles
Users Rating of Our Blogs
Share Your Experience
We value your feedback! Please rate our content and share your thoughts (optional).
What Readers Say About Our Blog
good
