Feeling uncertain about what to expect in your upcoming interview? We’ve got you covered! This blog highlights the most important Technical Calculations interview questions and provides actionable advice to help you stand out as the ideal candidate. Let’s pave the way for your success.
Questions Asked in Technical Calculations Interview
Q 1. Explain the concept of significant figures and their importance in calculations.
Significant figures represent the number of digits in a value that carry meaning contributing to its precision. They indicate the uncertainty inherent in a measurement or calculation. The importance lies in accurately reflecting the precision of data and preventing the propagation of insignificant digits, leading to misleading results. For example, if you measure a length with a ruler marked to the nearest millimeter, reporting the length as 12.345 cm is incorrect, as the last three digits are uncertain. The correct representation would use the significant figures, perhaps 12.3 cm.
Consider a calculation where you add 10.2 cm and 1.25 cm. A calculator might display 11.45 cm. However, since 10.2 cm only has three significant figures, the result should be rounded to 11.5 cm, reflecting the least precise measurement. Using extra digits implies a greater precision than is justified by the data.
- Rules for Significant Figures: Non-zero digits are always significant. Zeros between non-zero digits are significant. Leading zeros are not significant (e.g., 0.002 has one significant figure). Trailing zeros in a number containing a decimal point are significant (e.g., 2.00 has three significant figures). Trailing zeros in a number without a decimal point are ambiguous and should be avoided by using scientific notation.
In engineering and scientific work, carefully considering significant figures is crucial for maintaining data integrity and obtaining accurate and reliable results.
Q 2. Describe different methods for solving systems of linear equations.
Solving systems of linear equations involves finding the values of multiple variables that satisfy a set of simultaneous linear equations. There are several methods, each with its strengths and weaknesses:
- Substitution Method: Solve one equation for one variable in terms of the others, then substitute this expression into the other equations. This method is simple for small systems but becomes cumbersome for larger ones.
- Elimination Method (also known as Gaussian elimination): Manipulate the equations by adding or subtracting multiples of one equation from others to eliminate variables systematically. This approach is more efficient for larger systems and forms the basis for many computer algorithms.
- Matrix Methods: Represent the system using matrices and use matrix algebra techniques like Gaussian elimination (row reduction) or finding the inverse of the coefficient matrix. This is the most efficient and general method for large systems, often implemented using computer software.
- Cramer’s Rule: A determinant-based method suitable for smaller systems; it can be computationally expensive for larger systems.
Example (Elimination):
Let’s solve:
2x + y = 5
x - y = 1
Adding the two equations eliminates ‘y’: 3x = 6, so x = 2. Substituting x = 2 into the first equation gives y = 1. Thus, the solution is x = 2, y = 1.
Choosing the best method depends on the size and structure of the system and the available tools. For large systems, matrix methods are often preferred because of their efficiency and suitability for computer implementation.
Q 3. How do you handle units and unit conversions in technical calculations?
Handling units and unit conversions is paramount in technical calculations. Inconsistent units lead to incorrect results. Here’s a systematic approach:
- Consistent Units: Ensure all values in a calculation use the same units. For instance, converting all lengths to meters before calculating area in square meters.
- Unit Conversion Factors: Use conversion factors to change from one unit to another. These factors are ratios equal to one (e.g., 1 meter/100 centimeters = 1). Always clearly indicate your units throughout the calculations, not just at the end.
- Dimensional Analysis: Verify the units of your answer by analyzing the units of the input values and the operations. The units of the result should be consistent with the quantity being calculated (e.g., if calculating speed, the units should be distance/time).
Example:
Convert 10 miles per hour to meters per second:
10 miles/hour * (1609.34 meters/1 mile) * (1 hour/3600 seconds) ≈ 4.47 meters/second
Using dimensional analysis, we see that the miles and hours cancel out, leaving meters per second.
Inaccurate unit handling is a common source of errors, so meticulous attention to units throughout the calculation process is essential for accuracy.
Q 4. What are the common sources of error in technical calculations?
Common sources of errors in technical calculations include:
- Human Errors: Mistakes in data entry, transcription, or calculation. This can be minimized through careful attention to detail, double-checking work, and using software that supports error checking.
- Measurement Errors: Limitations in the precision of measuring instruments introduce uncertainty in the data. Using more precise instruments and multiple measurements to calculate averages can help mitigate these errors.
- Rounding Errors: Errors due to rounding off numbers during calculations. Minimized by using sufficient significant figures throughout the calculation or employing high-precision numerical methods.
- Model Errors: Simplifications and assumptions in the mathematical models used can lead to deviations from reality. Choosing appropriate models and validating their applicability is crucial.
- Software Errors: Bugs or limitations in software packages can produce inaccurate results. It’s crucial to use reliable and well-tested software and to critically evaluate outputs.
- Unit Inconsistencies: Using different units within the same calculation without proper conversion leads to significantly flawed results.
Implementing error analysis, such as identifying potential sources of error and assessing their impact, is critical to validating results and building confidence in the conclusions drawn.
Q 5. Explain the concept of error propagation and how to minimize it.
Error propagation describes how uncertainties in input values affect the uncertainty in the calculated result. Minimizing error propagation involves understanding how errors combine during calculations.
Addition/Subtraction: When adding or subtracting values, the absolute uncertainties add up. For example, if we add two values with errors: (10 ± 0.1) + (5 ± 0.2), the resulting error is 0.3 (0.1 + 0.2). The result is 15 ± 0.3.
Multiplication/Division: The relative uncertainties (percentage errors) add up. For example, if you multiply (10 ± 10%) * (5 ± 20%), the relative uncertainty of the product is approximately 30% (10% + 20%).
Minimizing Error Propagation:
- Improve Measurement Precision: Use more precise instruments to reduce uncertainties in the input data.
- Reduce Number of Calculations: Fewer steps generally mean less accumulation of errors.
- Statistical Methods: Using multiple measurements and averaging the results reduces the effect of random errors.
- Error Analysis: Systematic analysis of potential error sources helps identify and minimize their effects.
- High-Precision Arithmetic: Use high-precision computation tools or software to reduce rounding errors.
Careful consideration of error propagation is vital for correctly interpreting the uncertainty associated with technical calculations, ensuring credible conclusions.
Q 6. Describe your experience with numerical methods for solving differential equations.
I have extensive experience with numerical methods for solving differential equations, commonly employed when analytical solutions are unavailable or too complex. My experience encompasses various techniques including:
- Euler’s Method: A simple first-order method suitable for introductory purposes, but it can be inaccurate for complex equations. I have used it for initial exploration and understanding of system behavior.
- Runge-Kutta Methods (e.g., RK4): Higher-order methods providing greater accuracy than Euler’s method. I’ve frequently applied the fourth-order Runge-Kutta (RK4) method in projects involving trajectory calculations and simulations due to its balance between accuracy and computational cost.
- Finite Difference Methods: Used for solving partial differential equations (PDEs) by discretizing the spatial and temporal domains. I have employed these methods in heat transfer modeling and fluid dynamics simulations, leveraging their suitability for handling boundary conditions.
- Finite Element Methods (FEM): A powerful technique for solving PDEs over complex geometries. I’ve utilized FEM in structural analysis and electromagnetic field calculations, benefiting from its ability to handle intricate geometries and material properties.
My experience involves implementing these methods in various programming languages such as Python (with libraries like SciPy) and MATLAB, focusing on ensuring accuracy, efficiency, and stability in the numerical solutions.
Q 7. How do you choose an appropriate numerical method for a given problem?
Choosing an appropriate numerical method depends on several factors:
- Type of Differential Equation: Ordinary Differential Equations (ODEs) vs. Partial Differential Equations (PDEs). ODE solvers are distinct from PDE solvers.
- Order of the Equation: First-order, second-order, etc. Higher-order equations often require specialized techniques.
- Equation Complexity: Linear vs. nonlinear. Nonlinear equations usually require iterative methods.
- Accuracy Requirements: The level of precision required for the solution dictates the order and complexity of the chosen method. Higher accuracy demands higher-order methods but come with increased computational cost.
- Computational Resources: Available computing power and memory limitations influence the feasibility of using computationally intensive methods.
- Boundary and Initial Conditions: The nature of boundary and initial conditions affects the suitability of certain numerical methods.
For instance, a simple first-order ODE with moderate accuracy requirements might be efficiently solved by RK4. A complex PDE involving irregular geometry may require a Finite Element method. A comprehensive understanding of numerical methods and the characteristics of the specific problem is essential to make an informed choice.
Q 8. What are the advantages and disadvantages of different numerical integration techniques?
Numerical integration approximates the definite integral of a function. Several techniques exist, each with its strengths and weaknesses. The choice depends on factors like the function’s complexity, accuracy requirements, and computational cost.
- Trapezoidal Rule: This method approximates the area under the curve using trapezoids. It’s simple to implement but can be inaccurate for highly curved functions. Think of it like approximating a curved land plot with a series of trapezoids – the more trapezoids, the better the approximation.
Advantages: Simple, easy to understand and implement.
Disadvantages: Low accuracy for complex functions, significant error with highly oscillatory functions. - Simpson’s Rule: This method uses parabolas to approximate the curve, leading to higher accuracy than the trapezoidal rule. It requires an even number of intervals. Imagine fitting smooth curves (parabolas) instead of straight lines to the data.
Advantages: Higher accuracy than the trapezoidal rule, relatively simple to implement.
Disadvantages: Still susceptible to error with highly oscillatory or discontinuous functions, requires an even number of intervals. - Gaussian Quadrature: This sophisticated technique uses strategically chosen points and weights to achieve high accuracy with fewer function evaluations. It’s like cleverly picking a few representative points to accurately estimate the area, rather than dividing the area into many small sections.
Advantages: High accuracy with fewer function evaluations.
Disadvantages: More complex to implement, requires knowledge of appropriate weights and points for the specific function. - Monte Carlo Integration: This probabilistic method uses random sampling to estimate the integral. It’s particularly useful for high-dimensional integrals and complex functions. Imagine throwing darts randomly at a target representing the area under the curve and estimating the area based on the proportion of darts landing inside.
Advantages: Applicable to high-dimensional integrals and complex functions, relatively easy to parallelize.
Disadvantages: Slower convergence than deterministic methods, results are stochastic (subject to random variation).
In practice, the choice depends heavily on the problem. For simple functions, the trapezoidal rule might suffice. For higher accuracy, Simpson’s rule or Gaussian quadrature would be preferred. Monte Carlo integration is reserved for complex, high-dimensional problems where other methods are impractical.
Q 9. Explain your understanding of interpolation and extrapolation methods.
Interpolation and extrapolation are techniques used to estimate the value of a function at points not explicitly defined in a dataset. Interpolation involves estimating values within the range of known data, while extrapolation estimates values outside this range.
Interpolation Methods:
- Linear Interpolation: Connects two data points with a straight line and estimates the value at a point on that line. Simple, but inaccurate for non-linear data.
Example: If we know f(1)=2 and f(3)=4, linear interpolation would estimate f(2) as 3. - Polynomial Interpolation: Fits a polynomial to the data points. Higher-degree polynomials can capture more complex relationships but are prone to oscillations (Runge’s phenomenon). This is like fitting a curve through all your known points.
- Spline Interpolation: Uses piecewise polynomial functions to interpolate between data points, offering flexibility and avoiding oscillations. This is like fitting multiple smaller curves together to get a smoother, more accurate fit.
Extrapolation Methods:
- Linear Extrapolation: Extends a linear trend beyond the known data. Risky as it assumes the trend continues indefinitely.
- Polynomial Extrapolation: Extends a polynomial trend beyond the known data. Even riskier than linear extrapolation due to potential for rapid divergence.
Extrapolation is generally less reliable than interpolation, as it relies on assumptions about the function’s behavior beyond the observed data. It’s crucial to be cautious when extrapolating and always consider the limitations and potential errors involved.
Q 10. How would you approach solving a non-linear equation?
Solving non-linear equations often requires iterative methods as there’s no closed-form solution. Popular techniques include:
- Bisection Method: This method repeatedly halves an interval known to contain the root until the desired accuracy is reached. It’s simple but converges slowly. Think of it as systematically narrowing down the location of a hidden treasure.
- Newton-Raphson Method: This method uses the derivative of the function to iteratively refine an estimate of the root. It converges quickly but requires the function to be differentiable and the initial guess to be reasonably close to the root. This is like using the slope of a curve to ‘zoom in’ on the solution.
- Secant Method: Similar to Newton-Raphson, but it approximates the derivative using two function values. It avoids the need to explicitly compute the derivative but may converge slower.
- Fixed-Point Iteration: This method rearranges the equation into the form x = g(x) and iteratively applies g to an initial guess until convergence. The convergence depends on the properties of g.
The choice of method depends on the function’s properties and the desired accuracy. Newton-Raphson is often preferred for its fast convergence if the derivative is readily available. The bisection method is robust but slow. A good approach is to try a simple method first, and if it’s not converging sufficiently quickly, switch to a faster method.
Q 11. Describe your experience with statistical analysis and data interpretation.
My experience with statistical analysis and data interpretation is extensive. I’m proficient in various techniques, from descriptive statistics to inferential statistics and hypothesis testing. I’ve worked with various statistical software packages (e.g., R, Python with SciPy/Statsmodels) to analyze datasets ranging from small experimental studies to large-scale observational data. I have experience in:
- Descriptive Statistics: Calculating measures of central tendency (mean, median, mode), dispersion (variance, standard deviation), and constructing visualizations (histograms, box plots).
- Inferential Statistics: Performing hypothesis tests (t-tests, ANOVA, chi-square tests), constructing confidence intervals, and regression analysis.
- Data Cleaning and Preprocessing: Handling missing data, identifying and removing outliers, and transforming variables as needed. In a recent project analyzing customer churn, I identified and removed several data entry errors which greatly improved the model’s predictive accuracy.
- Data Visualization: Creating informative and visually appealing graphs and charts to communicate insights effectively. A compelling visualization can make even complex results instantly understandable.
I approach data interpretation by first understanding the context of the data, identifying the research question, and then selecting appropriate statistical methods to address the question. I always pay close attention to assumptions and limitations of the methods used and present results in a clear and concise manner.
Q 12. How do you perform regression analysis and interpret the results?
Regression analysis models the relationship between a dependent variable and one or more independent variables. I typically use least squares methods to estimate the regression coefficients. The goal is to find the line or plane (or hyperplane in multiple regression) that best fits the data.
Process:
- Data Exploration and Preparation: Check for missing values, outliers, and linearity assumptions.
- Model Selection: Choose the appropriate regression model (linear, polynomial, logistic, etc.) based on the nature of the dependent variable and the relationship between variables.
- Model Fitting: Estimate the regression coefficients using least squares (or maximum likelihood for generalized linear models).
- Model Diagnostics: Assess the goodness of fit (R-squared, adjusted R-squared), check for violations of assumptions (normality of residuals, homoscedasticity), and identify influential observations.
- Interpretation of Results: Interpret the regression coefficients, p-values, and confidence intervals to understand the strength and significance of the relationships between variables.
Interpretation: The regression coefficients represent the change in the dependent variable for a one-unit change in the corresponding independent variable, holding other variables constant. P-values indicate the statistical significance of the coefficients. R-squared measures the proportion of variance in the dependent variable explained by the model. For example, in a linear regression modeling house prices based on square footage, the coefficient for square footage would tell us how much the price increases for each additional square foot, while R-squared would tell us how well the model fits the data.
Q 13. Explain your understanding of hypothesis testing.
Hypothesis testing is a statistical procedure used to make inferences about a population based on sample data. The process involves formulating a null hypothesis (H0), an alternative hypothesis (H1), setting a significance level (alpha), collecting data, performing a statistical test, and making a decision whether to reject or fail to reject the null hypothesis.
Steps:
- State the Hypotheses: Formulate the null and alternative hypotheses. The null hypothesis typically represents the status quo or no effect, while the alternative hypothesis represents the effect we want to test.
- Set the Significance Level: Choose a significance level (alpha), which is the probability of rejecting the null hypothesis when it is true (Type I error). A common significance level is 0.05.
- Collect Data and Perform the Test: Gather data and perform an appropriate statistical test (t-test, ANOVA, chi-square, etc.) depending on the nature of the data and the hypotheses.
- Make a Decision: Compare the p-value from the test to the significance level. If the p-value is less than or equal to the significance level, we reject the null hypothesis. Otherwise, we fail to reject the null hypothesis.
Example: Suppose we want to test if a new drug lowers blood pressure. H0: The drug has no effect on blood pressure. H1: The drug lowers blood pressure. We collect data from a clinical trial and perform a t-test. If the p-value is less than 0.05, we reject H0 and conclude that the drug does lower blood pressure. It’s important to remember that failing to reject the null hypothesis does not prove the null hypothesis is true; it simply means there is insufficient evidence to reject it.
Q 14. How would you approach a problem involving dimensional analysis?
Dimensional analysis is a powerful technique used to check the consistency of equations and to derive relationships between physical quantities. It’s based on the principle that the dimensions of both sides of an equation must be equal. Dimensions are fundamental units such as length (L), mass (M), time (T), and others.
Approach:
- Identify the variables: List all variables involved in the problem and their respective dimensions.
- Formulate a relationship: Assume a general relationship between the variables based on physical principles or intuition. Often this relationship will involve constants with unknown dimensions.
- Check dimensional consistency: Ensure that the dimensions on both sides of the equation are the same. This process often leads to constraints on the powers of the variables and constants.
- Solve for the unknowns: Determine the exponents and any unknown constants using the dimensional constraints.
Example: Let’s consider the period (T) of a simple pendulum, which depends on the length (L) of the pendulum and the acceleration due to gravity (g). We assume a relationship of the form T = k La gb, where k is a dimensionless constant and a, b are exponents. The dimensions are [T] = T, [L] = L, [g] = LT-2. Equating the dimensions, we get T = La (LT-2)b = La+b T-2b. For dimensional consistency, we must have a+b = 0 and -2b = 1. This gives b = -1/2 and a = 1/2. Therefore, T = k L1/2 g-1/2. Dimensional analysis doesn’t determine k, but it provides a powerful check on the equation’s form.
Q 15. Describe your experience with using spreadsheets for technical calculations.
Spreadsheets are invaluable tools for technical calculations, particularly when dealing with large datasets or iterative processes. My experience spans using spreadsheets like Microsoft Excel and Google Sheets for everything from simple unit conversions and statistical analysis to complex financial modeling and engineering simulations. I’m proficient in using built-in functions like SUM, AVERAGE, IF, VLOOKUP, and more advanced features like array formulas and data visualization tools. For instance, I’ve used Excel to model heat transfer in a building, creating a complex spreadsheet that iterated through different insulation thicknesses to optimize energy efficiency. The visual nature of spreadsheets allows for easy error detection and facilitates collaboration. I also leverage features like data validation and conditional formatting to improve the accuracy and clarity of the calculations.
Beyond basic calculations, I’ve effectively used macros and VBA scripting in Excel to automate repetitive tasks and develop custom functions for specialized calculations. This automation significantly improves efficiency, especially when dealing with large datasets or complex scenarios that require repeated analysis.
Career Expert Tips:
- Ace those interviews! Prepare effectively by reviewing the Top 50 Most Common Interview Questions on ResumeGemini.
- Navigate your job search with confidence! Explore a wide range of Career Tips on ResumeGemini. Learn about common challenges and recommendations to overcome them.
- Craft the perfect resume! Master the Art of Resume Writing with ResumeGemini’s guide. Showcase your unique qualifications and achievements effectively.
- Don’t miss out on holiday savings! Build your dream resume with ResumeGemini’s ATS optimized templates.
Q 16. What software packages are you proficient in for technical calculations (e.g., MATLAB, Python)?
My proficiency extends beyond spreadsheets to encompass several powerful software packages for technical calculations. I’m highly skilled in MATLAB, a programming environment specifically designed for numerical computation, and Python, a versatile language with extensive scientific computing libraries. In MATLAB, I’ve extensively used toolboxes like the Symbolic Math Toolbox for solving complex equations and the Image Processing Toolbox for image analysis. I find MATLAB particularly useful for its strong visualization capabilities and its optimized algorithms for matrix operations, which are crucial in many engineering and scientific applications.
Python, with libraries such as NumPy (for numerical computing), SciPy (for scientific algorithms), and Matplotlib (for plotting), provides a highly flexible and adaptable environment. I’ve used Python to develop custom scripts for data analysis, simulations, and creating interactive visualizations. For example, I developed a Python script using NumPy and SciPy to perform a complex finite element analysis for a structural engineering project. The flexibility of Python allows for integration with other software and databases, making it suitable for a wider range of tasks.
Q 17. Describe your experience with programming for technical calculations.
Programming is fundamental to my approach to technical calculations. My programming experience significantly enhances my ability to automate complex calculations, develop custom solutions, and handle large datasets efficiently. I’m proficient in several languages, including Python and MATLAB, as mentioned previously, and have used C++ for computationally intensive tasks where performance is paramount.
I understand the importance of writing clean, well-documented, and modular code. This allows for easier debugging, collaboration, and maintainability. My experience includes developing algorithms for numerical integration, solving differential equations, performing statistical analysis, and creating custom simulations. A recent example involved writing a C++ program to simulate fluid flow using the Finite Volume Method, which demanded careful consideration of computational efficiency and numerical stability.
Q 18. How do you ensure the accuracy and reliability of your calculations?
Ensuring the accuracy and reliability of calculations is paramount. My approach is multi-faceted and involves several key strategies. Firstly, I always verify formulas and algorithms independently. This includes comparing results against known analytical solutions, using different methods to solve the same problem, and performing sensitivity analysis to assess the impact of input variations on the outcome.
Secondly, I meticulously document all assumptions, input data, and calculation steps. This transparent approach allows for easy review and validation by others. Thirdly, I utilize unit checking at every stage of the calculation. Inconsistencies in units are a major source of error and careful attention to this prevents many mistakes. Finally, I use version control systems like Git to track changes and allow for easy rollback if necessary. This is particularly helpful in larger, collaborative projects.
Q 19. How do you handle uncertainties and tolerances in engineering calculations?
Uncertainties and tolerances are inherent in all engineering calculations. Ignoring them can lead to significant errors and potentially dangerous outcomes. I handle these uncertainties using several methods, depending on the context. For example, I often employ Monte Carlo simulations to propagate uncertainties through a calculation. This method generates many random samples from the input distributions and uses them to create a distribution of the output, giving insight into the range of likely results.
For simpler cases, I use worst-case scenarios to determine the maximum possible error. This involves using the extreme values of input tolerances to calculate the most pessimistic outcome. In both cases, clear documentation of the uncertainty analysis is essential for transparency and decision making. Furthermore, selecting appropriate tolerances for inputs is critical and reflects an understanding of the manufacturing processes and material properties involved.
Q 20. Explain your understanding of different types of uncertainties (e.g., systematic, random).
Understanding different types of uncertainties is crucial for robust error analysis. Systematic errors are consistent and repeatable; they result from biases in the measurement or calculation process. For example, a consistently miscalibrated instrument would introduce a systematic error. Random errors, on the other hand, are unpredictable and vary randomly from measurement to measurement. These errors are often due to noise or inherent limitations in the measuring device.
Another important category is model uncertainty, which stems from simplifications or approximations in the mathematical models used. For instance, using a linear model to represent a non-linear phenomenon inherently introduces model uncertainty. Properly characterizing and quantifying these different types of uncertainty is critical for evaluating the overall reliability of a calculation and informing design decisions.
Q 21. How would you present technical calculation results clearly and effectively?
Clear and effective presentation of technical calculation results is vital for communication and decision-making. I prioritize clarity and conciseness in my presentations. This means using clear language, avoiding unnecessary jargon, and structuring the results logically. Tables and graphs are indispensable for visualizing data and highlighting key findings. For instance, I might present a summary table of key results, accompanied by charts illustrating the sensitivity of the outcome to changes in input parameters.
Furthermore, I always include a thorough discussion of the uncertainties and limitations of the analysis. This includes documenting all assumptions made, the methods used, and the uncertainties associated with the input data and model. In some cases, I might also present a range of possible outcomes, reflecting the uncertainty in the input parameters. The goal is to give the audience a complete and accurate picture of the analysis and its implications.
Q 22. Describe your approach to troubleshooting errors in technical calculations.
Troubleshooting errors in technical calculations is a systematic process. My approach involves a multi-pronged strategy focusing on identifying the source of the error, verifying inputs, and systematically checking the calculation methodology.
- Reproduce the Error: The first step is always to try and reproduce the error consistently. This helps eliminate random fluctuations and ensures that the issue isn’t transient. I’ll meticulously document each step of the calculation.
- Check Inputs: Next, I meticulously verify all input data for accuracy. This includes checking for unit consistency, significant figures, and data entry errors. Often, the simplest mistakes are the hardest to catch.
- Review the Methodology: Once inputs are confirmed, I review the calculation methodology. I look for potential sources of error, such as incorrect formulas, inappropriate assumptions, or neglected factors. I might compare my approach with established methods or seek guidance from relevant literature or colleagues.
- Divide and Conquer: For complex calculations, I break the problem down into smaller, more manageable parts. This makes it easier to isolate the source of the error.
- Debugging Tools: I utilize debugging tools available in software like MATLAB or Python to help pinpoint issues in code. These tools often provide line-by-line execution and variable monitoring.
- Independent Verification: A crucial final step is to have another colleague or tool independently verify the results.
For example, if I’m calculating stress in a beam, I’d first check the material properties (Young’s Modulus, yield strength), the dimensions of the beam, and the applied load are correct. Then I’d review the stress formula (σ = My/I) to ensure I’m using it correctly and that I have calculated the moment (M), the distance from the neutral axis (y), and the moment of inertia (I) accurately.
Q 23. How do you validate the results of your calculations?
Validating calculation results is critical to ensure accuracy and reliability. My approach involves a combination of techniques:
- Independent Calculation: I often perform the calculation using a different method or software to compare results. This helps to catch errors that might be specific to a particular approach.
- Unit Consistency: Consistent units throughout the calculation are paramount. I always double-check that all units are compatible and correctly converted. A mismatch of units can easily lead to orders of magnitude errors.
- Order of Magnitude Estimation: Before diving into detailed calculations, I often perform a rough order of magnitude estimation. This provides a quick sanity check on the final results. If the detailed calculation deviates significantly from the estimation, it warrants further investigation.
- Sensitivity Analysis: For complex calculations, I conduct a sensitivity analysis to determine how sensitive the results are to variations in input parameters. This helps to identify critical inputs that require precise measurement or careful modeling.
- Comparison with Known Data: If possible, I compare my results with published data, experimental results, or simulation data from reliable sources. This provides a benchmark for the accuracy of my work.
- Dimensional Analysis: I use dimensional analysis to verify the correctness of formulas and equations. The dimensions of the results should always be consistent with the expected physical quantity.
For instance, if calculating the power output of a wind turbine, I might use an online calculator as an independent check, make sure all units (wind speed, rotor diameter, air density) are consistent, and estimate the power based on a simplified model to cross-validate the final detailed calculation. Inconsistencies trigger a review of the methodology and inputs.
Q 24. What are some common pitfalls to avoid when performing complex calculations?
Several common pitfalls can significantly affect the accuracy of complex calculations. Avoiding these is crucial:
- Unit Inconsistency: Mixing units (e.g., using both meters and feet in the same calculation) is a frequent source of error. Always use a consistent system of units (SI units are preferred).
- Rounding Errors: Repeated rounding during intermediate steps can accumulate and lead to significant errors in the final result. It’s best to carry as many significant figures as possible throughout the calculation and only round the final answer.
- Incorrect Formula Application: Using an incorrect or inappropriate formula is a major source of error. Always ensure the formula is relevant to the problem and the assumptions made are valid.
- Neglecting Significant Figures: Using insufficient significant figures in measurements or calculations can result in a loss of precision and accuracy. The number of significant figures used should reflect the uncertainty in the measurements.
- Ignoring Assumptions: Many calculations involve simplifying assumptions. It’s crucial to understand the limitations of these assumptions and their potential impact on the accuracy of the results. Clearly stating the assumptions is important for transparency and reproducibility.
- Data Entry Errors: Simple typos or data entry errors can have significant consequences. Carefully review all data entries and use checks to verify their correctness.
Imagine calculating the trajectory of a projectile. Mixing units (degrees for angle and radians for trigonometric functions) or incorrectly applying the equations of motion due to neglecting air resistance could lead to vastly different (and wrong) results.
Q 25. How do you balance speed and accuracy in your calculations?
Balancing speed and accuracy in calculations is a constant trade-off. The best approach depends on the context of the problem. Sometimes speed is critical, while in other cases, accuracy is paramount.
- Approximation Techniques: For situations requiring speed, approximation techniques can be employed. These methods sacrifice some accuracy for increased computational efficiency. Examples include linearization, perturbation methods, or using simplified models.
- Numerical Methods: Numerical methods offer a balance between speed and accuracy. They provide approximate solutions to complex problems that can’t be solved analytically. Choosing an appropriate numerical method (e.g., iterative solvers, finite element analysis) depends on the specific problem and desired level of accuracy.
- Computational Resources: Utilizing more powerful computational resources (e.g., high-performance computing clusters) can improve both speed and accuracy. Parallel processing can accelerate calculations significantly, while higher precision arithmetic can reduce rounding errors.
- Software Optimization: Efficient coding practices and use of optimized libraries can significantly enhance calculation speed. Profiling tools can help identify bottlenecks in the code and suggest areas for improvement.
- Adaptive Algorithms: Adaptive algorithms adjust their accuracy based on the needs of the problem. They can start with a coarse approximation and refine the solution iteratively until a desired level of accuracy is reached.
In a real-time control system, speed might be prioritized, using a simpler model even if some accuracy is lost. In contrast, designing a critical aerospace component requires utmost accuracy, justifying more complex calculations and intensive validation.
Q 26. Describe a challenging technical calculation problem you solved and how you approached it.
I once faced the challenge of optimizing the design of a heat exchanger for a chemical plant. The design needed to maximize heat transfer efficiency while minimizing pressure drop and material cost. This involved complex calculations involving fluid dynamics, heat transfer, and cost optimization.
My approach was:
- Develop a Mathematical Model: I first developed a detailed mathematical model that incorporated the relevant equations for heat transfer, fluid flow, and pressure drop. The model included parameters such as fluid flow rate, temperature difference, heat transfer coefficient, and material properties.
- Numerical Simulation: Due to the complexity of the equations, I employed numerical simulation techniques (specifically, Computational Fluid Dynamics or CFD) to solve the governing equations. This involved using specialized software to simulate the fluid flow and heat transfer within the heat exchanger.
- Optimization Algorithm: To optimize the design, I utilized a genetic algorithm. This evolutionary algorithm efficiently explores the design space by generating, evaluating, and selecting improved designs iteratively, leading to an optimal configuration that minimized pressure drop and cost, while maximizing heat transfer.
- Validation and Verification: The results obtained from the simulation were rigorously validated by comparing them with empirical data from similar heat exchangers and by performing sensitivity analysis on the input parameters. This helped to confirm the accuracy and reliability of the optimized design.
The project successfully resulted in a significantly more efficient and cost-effective heat exchanger design compared to the initial design, demonstrating the effectiveness of the combined modeling, simulation, and optimization approach.
Q 27. Explain your experience with optimization techniques in engineering calculations.
I have extensive experience with optimization techniques in engineering calculations. These techniques are crucial for finding the best solution within given constraints. My experience encompasses various methods, including:
- Linear Programming: Used for problems where the objective function and constraints are linear. I’ve applied this to problems like resource allocation and scheduling.
- Nonlinear Programming: Used for problems involving nonlinear objective functions or constraints. This often involves iterative algorithms such as gradient descent or Newton’s method. I’ve utilized this in designing optimal shapes or control systems.
- Genetic Algorithms: Evolutionary algorithms that are particularly useful for complex, multi-objective optimization problems. These are well-suited for scenarios where the design space is vast and non-convex. My work with heat exchanger optimization exemplified this.
- Simulated Annealing: A probabilistic technique that allows for escapes from local optima, useful when dealing with rugged optimization landscapes. This is beneficial in cases where finding a global optimum is important.
- Gradient-Based Methods: Efficient for smooth objective functions, but susceptible to getting stuck in local optima. I use these in conjunction with other techniques to mitigate that.
The choice of optimization technique depends heavily on the nature of the problem (linear vs. nonlinear, convex vs. non-convex), the number of design variables, and the computational resources available. I carefully consider these factors before selecting an appropriate method.
Q 28. How familiar are you with different types of numerical modeling techniques?
I am familiar with a wide range of numerical modeling techniques, including:
- Finite Element Analysis (FEA): A powerful technique for solving partial differential equations that govern various physical phenomena (stress, heat transfer, fluid flow). I have extensive experience using FEA software to model complex structures and systems.
- Finite Difference Method (FDM): A simpler method for solving differential equations, particularly useful for simpler geometries. I’ve used this for solving problems in heat transfer and fluid mechanics.
- Finite Volume Method (FVM): A popular technique for solving fluid dynamics problems, particularly suitable for conservation laws. My CFD work frequently uses this method.
- Boundary Element Method (BEM): Effective for problems with infinite or semi-infinite domains. This is useful in applications involving potential fields or acoustics.
- Monte Carlo Simulation: A statistical method used to model complex systems with random variables. I’ve applied this to uncertainty quantification and risk analysis.
My selection of a numerical method is guided by the specific characteristics of the problem—the governing equations, boundary conditions, geometry, and desired accuracy. Understanding the strengths and limitations of each method is critical for choosing the most appropriate and efficient approach.
Key Topics to Learn for Technical Calculations Interview
- Dimensional Analysis: Understanding unit conversions and ensuring consistent units throughout calculations. Practical application: Converting between different units of measurement in engineering problems.
- Significant Figures and Error Analysis: Understanding the precision of measurements and how it affects calculated results. Practical application: Determining the uncertainty in experimental data and reporting results accurately.
- Algebraic Manipulation and Equation Solving: Proficiency in solving equations, manipulating formulas, and working with variables. Practical application: Deriving equations from given information and solving for unknowns in engineering or scientific contexts.
- Trigonometry and Geometry: Applying trigonometric functions and geometric principles to solve problems involving angles, distances, and shapes. Practical application: Calculating forces and distances in structural analysis or surveying.
- Calculus (if applicable): Depending on the role, understanding derivatives, integrals, and their applications might be crucial. Practical application: Optimizing designs, modeling dynamic systems, or analyzing rates of change.
- Statistical Analysis (if applicable): Understanding basic statistical concepts and methods for data analysis. Practical application: Interpreting experimental results, identifying trends, and drawing conclusions from datasets.
- Problem-Solving Strategies: Developing a systematic approach to problem-solving, including identifying the problem, defining variables, formulating equations, solving for unknowns, and checking solutions. Practical application: Effectively tackling complex technical challenges in a methodical manner.
Next Steps
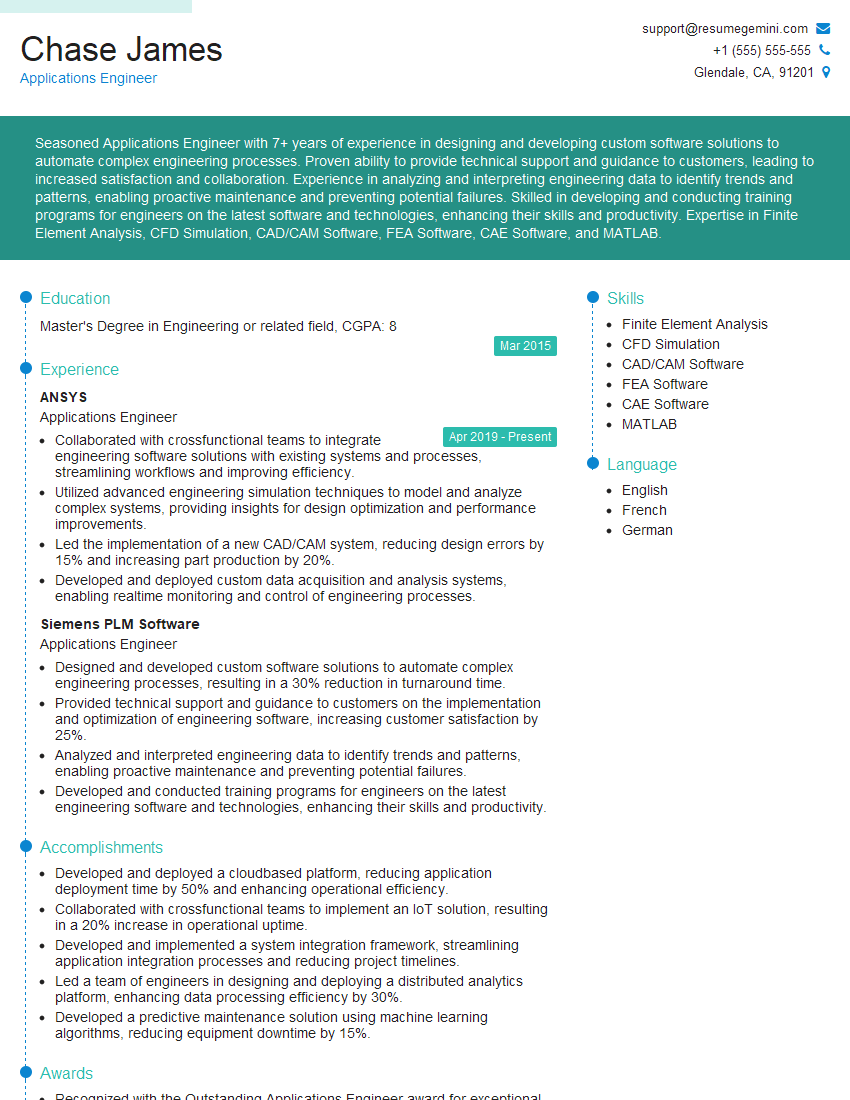
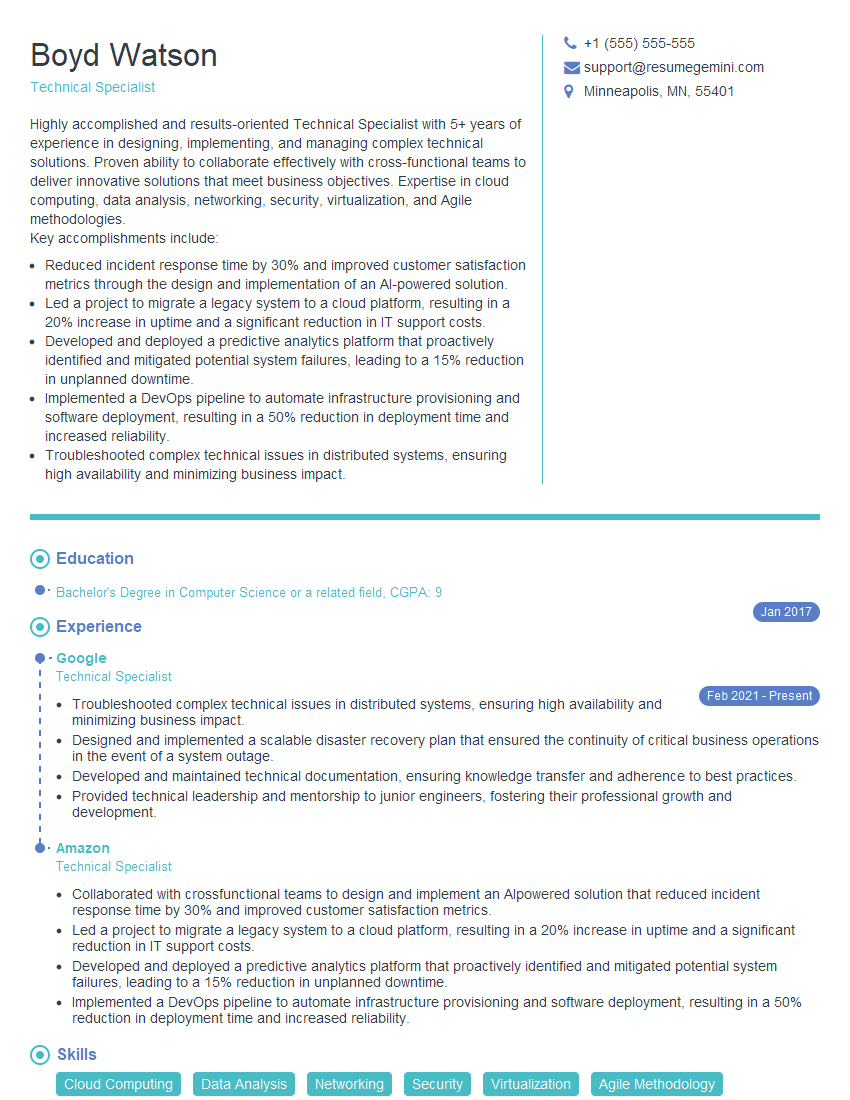
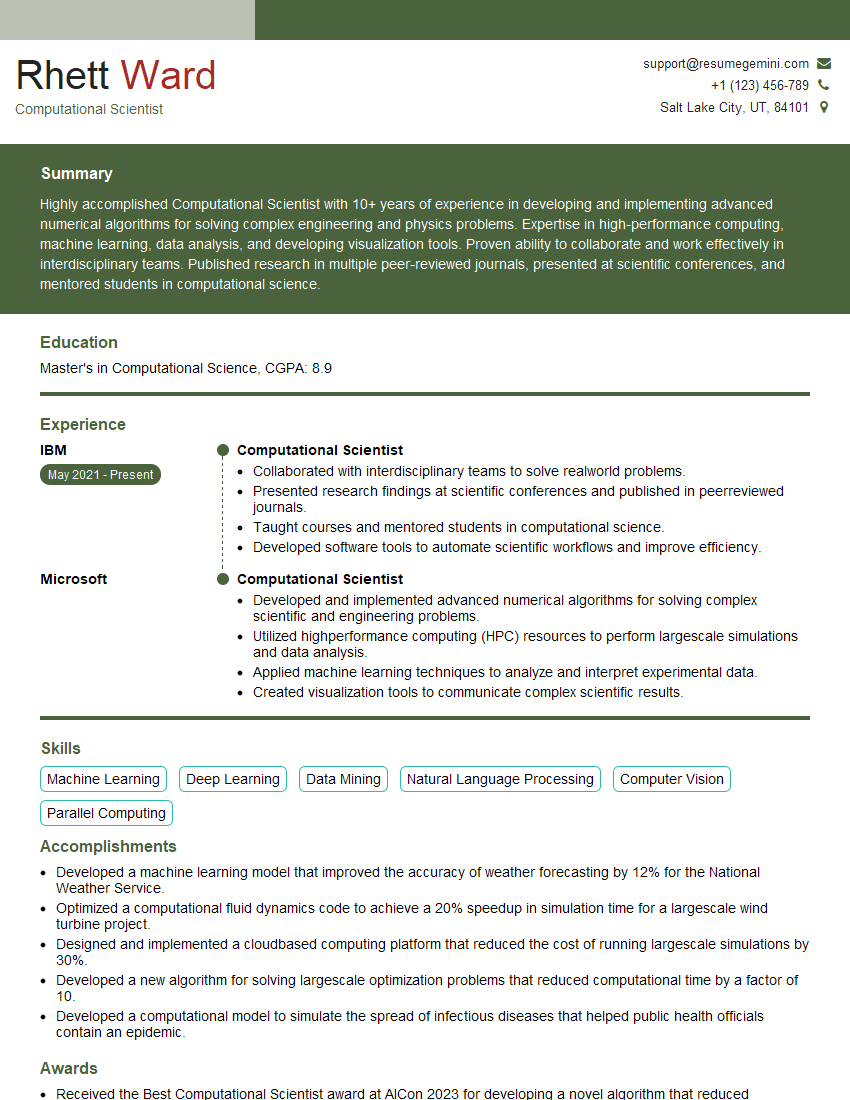
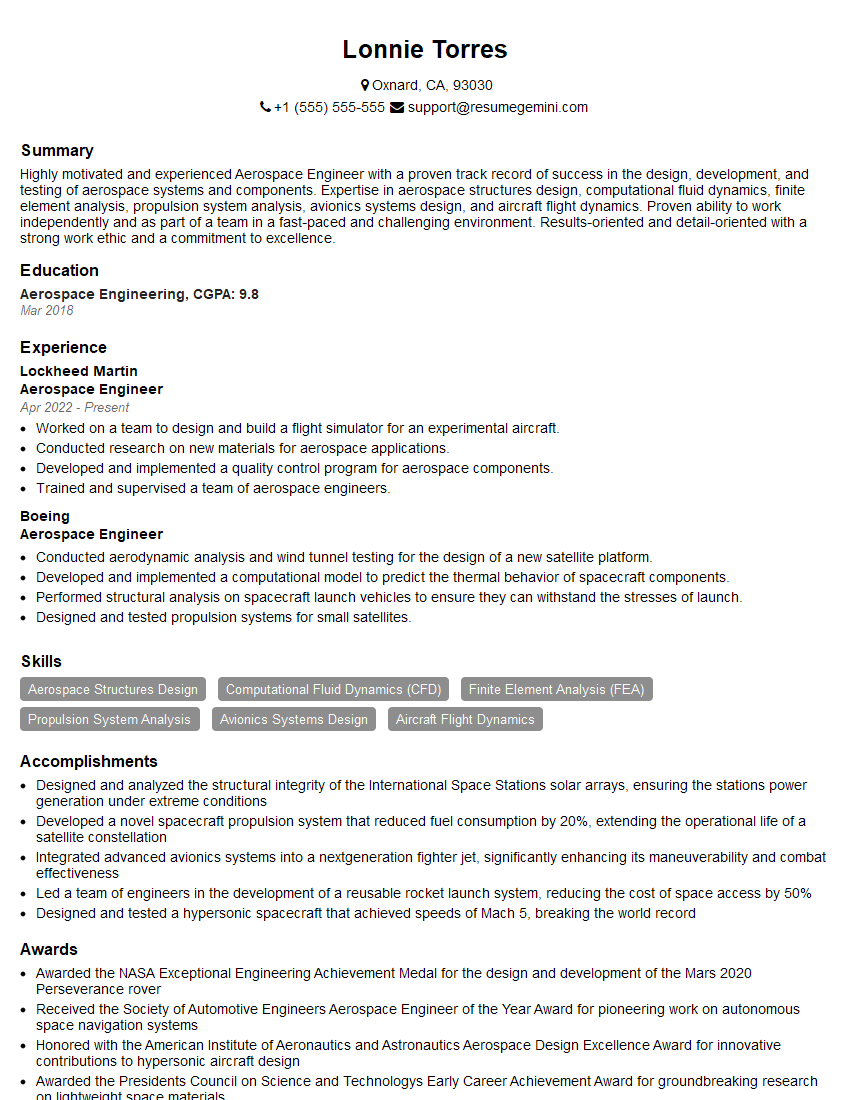
Mastering technical calculations is paramount for career advancement in many technical fields. A strong foundation in these skills demonstrates your analytical abilities and problem-solving aptitude – highly valued by employers. To maximize your job prospects, it’s essential to have an ATS-friendly resume that showcases your skills effectively. ResumeGemini is a trusted resource to help you build a professional and impactful resume that gets noticed. Examples of resumes tailored specifically for candidates with expertise in Technical Calculations are available to guide you. Invest time in crafting a compelling resume; it’s your first impression on potential employers.
Explore more articles
Users Rating of Our Blogs
Share Your Experience
We value your feedback! Please rate our content and share your thoughts (optional).
What Readers Say About Our Blog
Hello,
We found issues with your domain’s email setup that may be sending your messages to spam or blocking them completely. InboxShield Mini shows you how to fix it in minutes — no tech skills required.
Scan your domain now for details: https://inboxshield-mini.com/
— Adam @ InboxShield Mini
Reply STOP to unsubscribe
Hi, are you owner of interviewgemini.com? What if I told you I could help you find extra time in your schedule, reconnect with leads you didn’t even realize you missed, and bring in more “I want to work with you” conversations, without increasing your ad spend or hiring a full-time employee?
All with a flexible, budget-friendly service that could easily pay for itself. Sounds good?
Would it be nice to jump on a quick 10-minute call so I can show you exactly how we make this work?
Best,
Hapei
Marketing Director
Hey, I know you’re the owner of interviewgemini.com. I’ll be quick.
Fundraising for your business is tough and time-consuming. We make it easier by guaranteeing two private investor meetings each month, for six months. No demos, no pitch events – just direct introductions to active investors matched to your startup.
If youR17;re raising, this could help you build real momentum. Want me to send more info?
Hi, I represent an SEO company that specialises in getting you AI citations and higher rankings on Google. I’d like to offer you a 100% free SEO audit for your website. Would you be interested?
Hi, I represent an SEO company that specialises in getting you AI citations and higher rankings on Google. I’d like to offer you a 100% free SEO audit for your website. Would you be interested?
good


