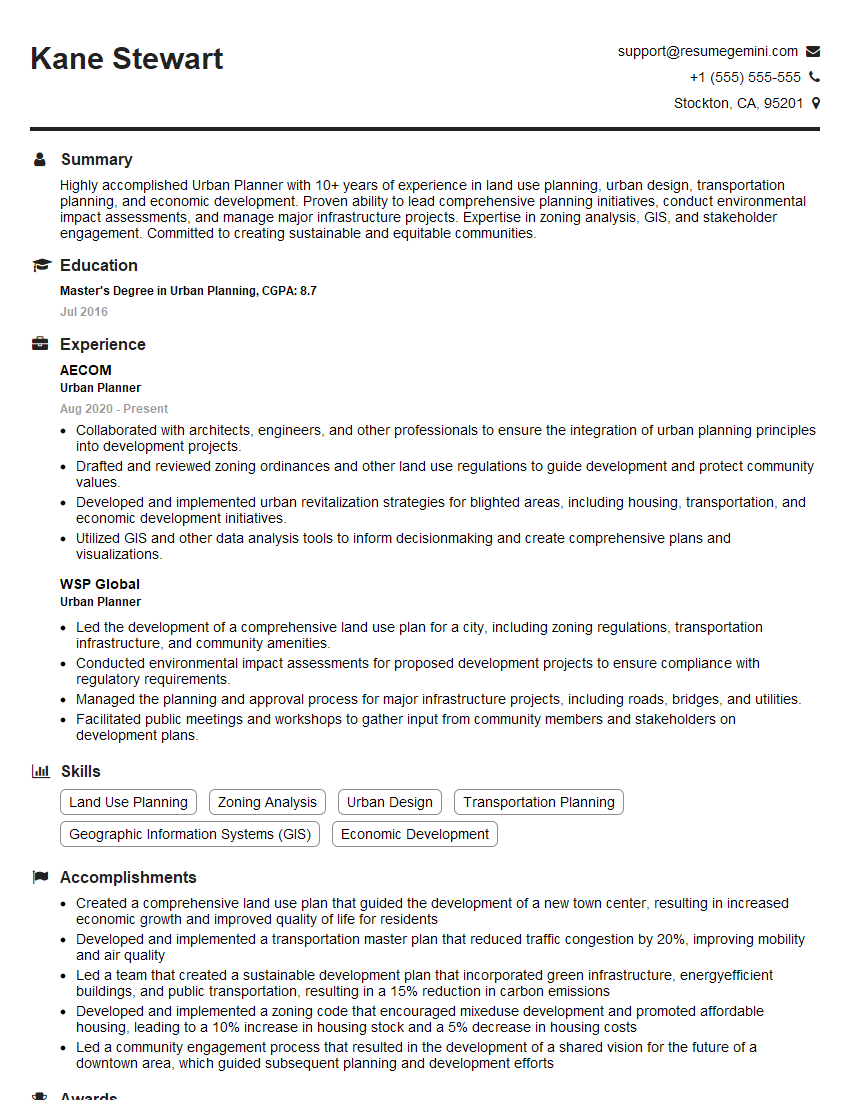
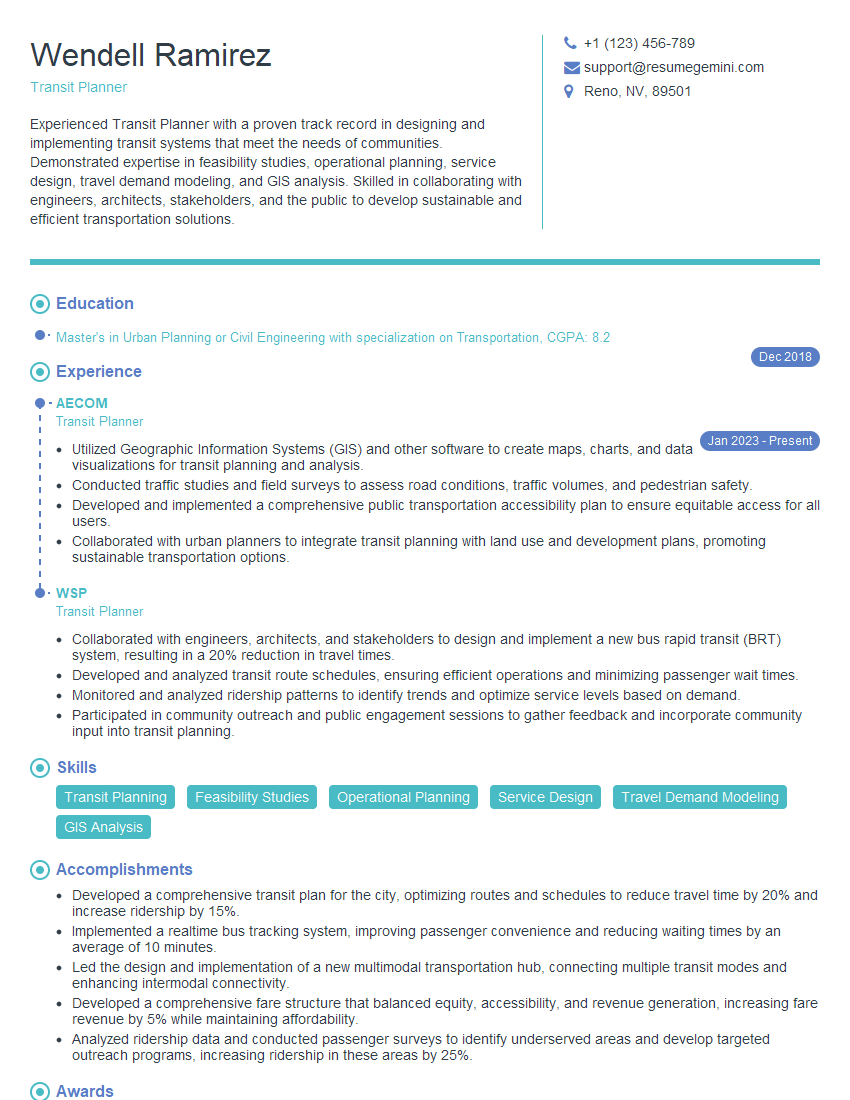
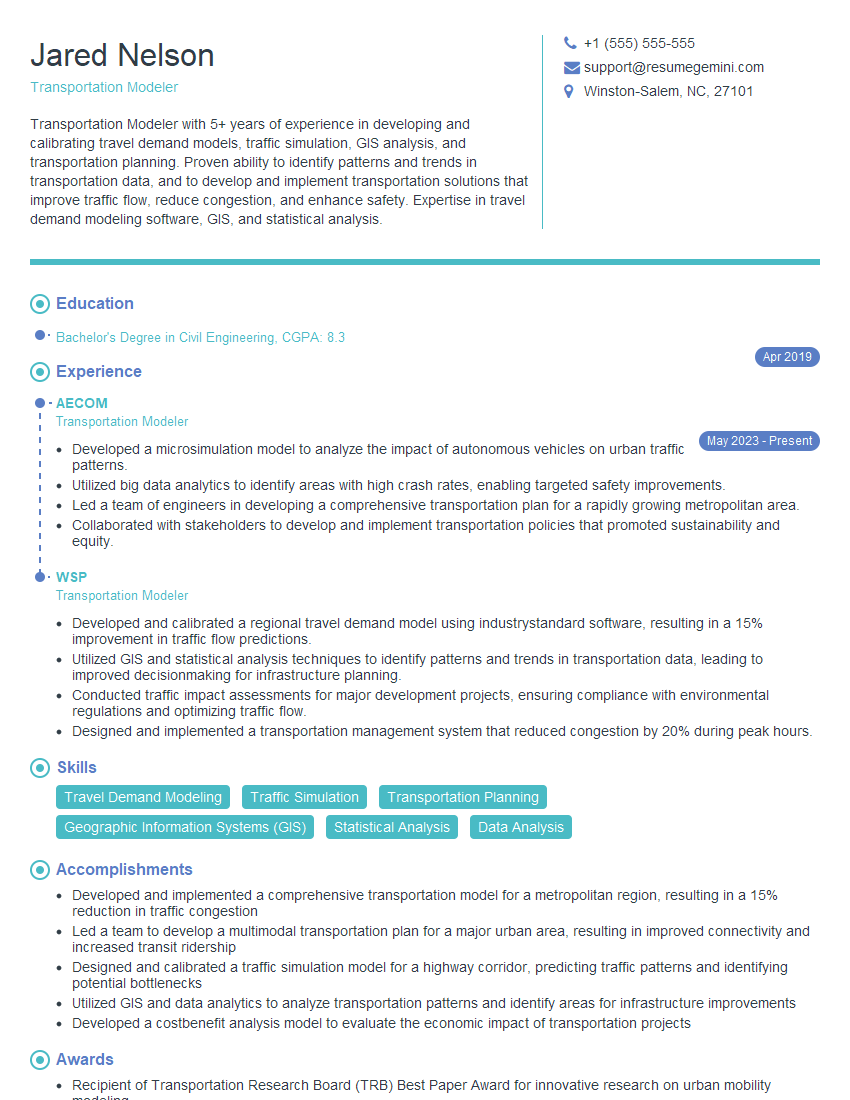
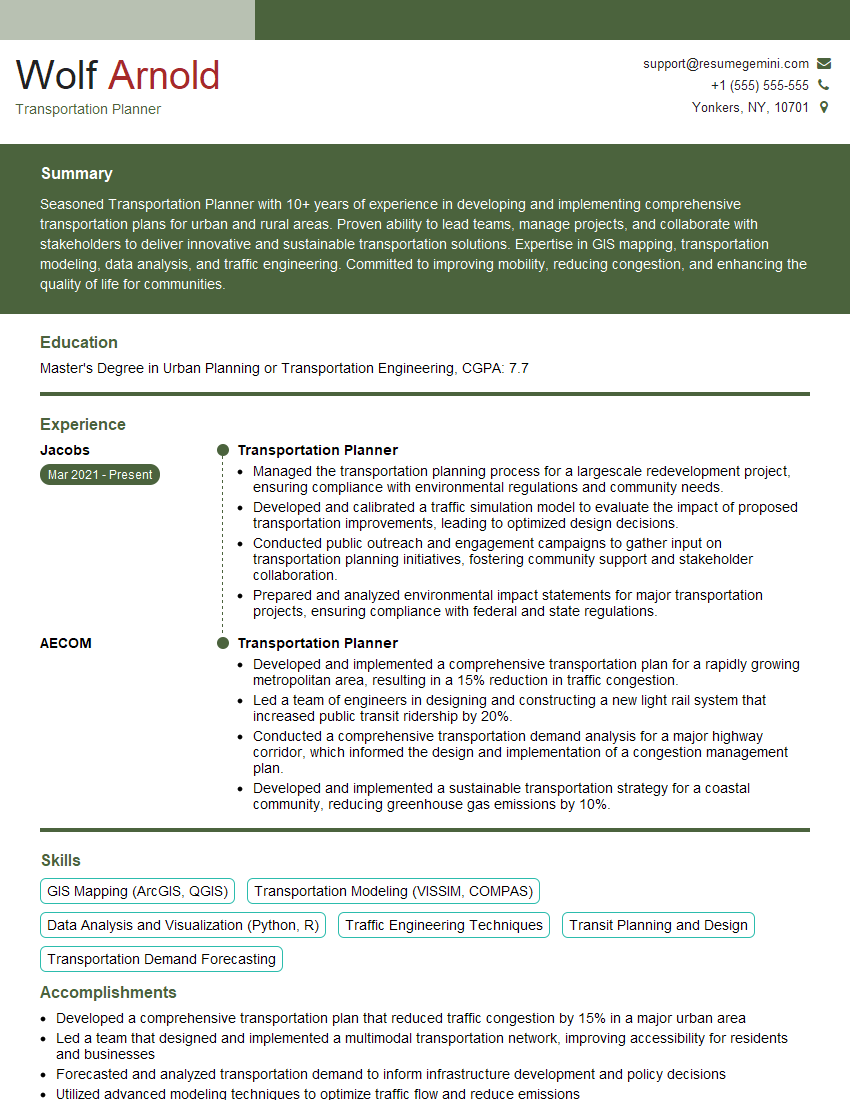
Interviews are more than just a Q&A session—they’re a chance to prove your worth. This blog dives into essential Travel Demand Modeling interview questions and expert tips to help you align your answers with what hiring managers are looking for. Start preparing to shine!
Questions Asked in Travel Demand Modeling Interview
Q 1. Explain the four-step travel demand model.
The four-step travel demand model is a classic approach to forecasting transportation system usage. It’s a sequential process, meaning each step relies on the output of the previous one. Think of it as a recipe for predicting how people will travel. It’s not perfect, but it provides a structured way to analyze complex travel patterns.
- Trip Generation: This step estimates the number of trips originating from and destined to different zones within the study area. Factors like household size, income, car ownership, and land use influence trip generation. Imagine counting how many cars leave each neighborhood in the morning.
- Trip Distribution: This step determines the origin-destination (O-D) matrix, which shows the number of trips between each pair of zones. Models like the gravity model (explained later) are often used here. This is like figuring out which neighborhoods people are traveling *between*.
- Mode Choice: This step predicts the mode of transportation (car, bus, bike, walk) used for each trip. It considers factors like travel time, cost, comfort, and availability of different modes. This is like deciding whether to take the highway or a smaller road.
- Trip Assignment: Finally, this step routes the trips on the transportation network, assigning them to specific links and calculating link volumes. This helps determine congestion levels on roads and transit lines. Think of this as visualizing the flow of traffic on a map.
The four-step model’s sequential nature makes it relatively easy to understand and implement, but its simplicity also means it has limitations. It doesn’t directly account for feedback loops, for instance; congestion in one area might affect trip choices, but this interaction isn’t explicitly modeled in each step.
Q 2. Describe the differences between trip generation, distribution, mode choice, and assignment.
The four steps of the travel demand model each play a distinct role in understanding and predicting travel patterns. Let’s differentiate them:
- Trip Generation: Focuses on *how many* trips originate and end in each zone, irrespective of their destination or mode.
- Trip Distribution: Determines the *spatial interaction* between zones, answering *where* trips are going from and to. It connects trip generation to the network structure.
- Mode Choice: Focuses on *how* people travel, selecting the appropriate transport mode (car, transit, bike, walk) based on various factors influencing the decision.
- Trip Assignment: Focuses on *route selection*, distributing the trips across the network links to simulate traffic flow and congestion. It is the most network-centric step.
Think of it as planning a road trip: Trip generation is deciding how many trips you’ll take, trip distribution is figuring out your destinations, mode choice is selecting your vehicle (car, plane, train), and trip assignment is planning your route.
Q 3. What are the key assumptions of the gravity model?
The gravity model, commonly used in trip distribution, assumes that the number of trips between two zones is proportional to the interaction between their attractiveness and inversely proportional to the impedance or separation between them. Think of it like Newton’s Law of Gravitation, but for trips. Key assumptions include:
- Proportionality: The number of trips is proportional to the product of the generating and attracting potentials of the zones.
- Inverse proportionality: The number of trips is inversely proportional to a function of the distance or travel time (impedance) between the zones.
- Independence of trips: Trips are assumed to be independent of each other. This means that one person’s travel choice doesn’t affect another’s. This is a simplification, as congestion clearly affects individual choices.
- Spatial interaction: The model captures the interaction between different zones based on their characteristics and the distance separating them.
For example, a zone with many employment opportunities (high attracting potential) and a zone with many residential units (high generating potential) will likely have a larger number of trips between them, especially if the travel time between them is short.
Q 4. How do you calibrate a travel demand model?
Calibrating a travel demand model involves adjusting the model’s parameters to best fit observed travel patterns. It’s like fine-tuning a machine to produce accurate results. The process typically involves these steps:
- Data Collection: Gathering observed trip data from sources like traffic counts, household travel surveys, and transit ridership data.
- Model Specification: Selecting appropriate models for each step (trip generation, distribution, mode choice, assignment) and specifying the relevant parameters.
- Parameter Estimation: Using statistical methods (e.g., least squares, maximum likelihood) to estimate the model parameters. This often involves using observed data to ‘tune’ the model’s relationships.
- Model Validation: Assessing the model’s performance by comparing its predictions to observed data. This often involves splitting data into training and validation sets. Methods include statistical measures (e.g., R-squared) or visual comparisons.
- Sensitivity Analysis: Examining how the model’s predictions change in response to changes in its parameters. This helps identify which parameters are most influential.
- Iteration: The process is iterative; you may need to refine the model, adjust parameters, and re-validate it several times before achieving satisfactory results.
Successful calibration requires a good understanding of both the model and the data. Incorrect calibration can lead to inaccurate forecasts and misleading conclusions. For instance, if the calibration doesn’t accurately reflect the impact of transit fares, the model may poorly predict transit ridership.
Q 5. What are some common software packages used for travel demand modeling?
Several software packages are commonly used for travel demand modeling. The choice depends on the specific needs of the project, budget, and user expertise. Some popular choices include:
- TransCAD: A comprehensive GIS-integrated software suite for travel modeling, offering capabilities for network analysis, data management, and model calibration.
- Cube: Another powerful software widely used in the field. Offers a user-friendly interface and is particularly strong in visualization and scenario analysis.
- Emme/Inro: A well-established platform, known for its advanced network optimization capabilities and its wide range of modeling techniques. It’s often favoured for larger and more complex projects.
- Visum: Another strong contender, providing extensive functionalities for modeling various transport modes and managing large datasets.
- MATLAB/Python: These programming languages are often used to create custom models, offering flexibility and the potential to incorporate advanced statistical methods and algorithms.
Each software package has its strengths and weaknesses. Selecting the right package requires considering factors such as the complexity of the project, available data, budgetary constraints, and the modeller’s expertise.
Q 6. Explain the concept of network equilibrium.
Network equilibrium in travel demand modeling describes a state where the travel choices of all individuals are consistent with the prevailing network conditions. Imagine a rush hour commute: network equilibrium is reached when no individual can improve their travel time by unilaterally changing their route. In other words, everyone is making the best decision they can, given everyone else’s decisions.
Two main types of network equilibrium are commonly studied:
- User Equilibrium (UE): Each individual chooses the route with the minimum travel time, given the congestion caused by the routes chosen by others. It’s a state of self-optimization for each user.
- System Optimum (SO): This is a state where the total travel time for all users is minimized. This might require traffic control measures or other interventions to coordinate travel choices.
The concept of network equilibrium is fundamental to traffic assignment, as it helps in predicting realistic traffic flows and congestion levels under different scenarios. It’s often solved using iterative algorithms that adjust route choices until a state of equilibrium is reached.
Q 7. How do you handle missing data in travel demand modeling?
Missing data is a common challenge in travel demand modeling, as data collection is often expensive and time-consuming. Several strategies can be used to handle this:
- Imputation: Replacing missing data with estimated values. Methods include using the mean, median, or mode of the available data, or more sophisticated techniques like regression imputation. This is like filling in gaps in a puzzle with educated guesses.
- Regression Analysis: Using statistical models to predict missing values based on available data. This approach leverages relationships between variables to infer missing values.
- Multiple Imputation: Generating multiple plausible replacements for the missing data, acknowledging uncertainty in the imputation process. This helps to account for the uncertainty introduced by missing values.
- Weighting: Adjusting the weights of the available data to compensate for missing values. This ensures that the remaining data are appropriately represented in the analysis.
- Data Sensitivity Analysis: Assessing how sensitive the model’s results are to the missing data. This helps to determine if missing data are a major source of uncertainty.
The best approach depends on the nature and extent of the missing data, and the characteristics of the dataset. It is crucial to document the methods used to handle missing data and evaluate its impact on the reliability and validity of the model results.
Q 8. What are the limitations of four-step models?
Four-step models, while foundational in travel demand modeling, suffer from several limitations stemming from their sequential and independent nature. These limitations significantly impact the accuracy and realism of the model outputs.
Independence of Steps: The four steps (trip generation, trip distribution, mode choice, and route assignment) are treated as independent processes. In reality, these steps are interconnected. For example, the choice of mode significantly impacts trip distribution and route assignment. The four-step model ignores these feedback loops.
Static Nature: The model assumes a static state, meaning travel patterns are assumed to remain constant. This fails to capture the dynamic nature of travel behavior, influenced by factors like time-of-day variations, congestion, and incidents.
Aggregation Issues: The model typically works with aggregated data, representing zones rather than individual travelers. This can mask significant variations within zones and lead to inaccurate predictions, especially in heterogeneous areas.
Difficulty in handling complex scenarios: Modeling complex scenarios such as transit networks with multiple transfers, dynamic traffic assignment, or the impact of shared mobility services proves challenging within the four-step framework.
First-order effects only: The model primarily captures direct effects rather than higher-order effects. For instance, the impact of a new highway on traffic might be correctly predicted, but its subsequent impact on land use and subsequent travel patterns is often neglected.
For instance, imagine modeling the impact of a new light rail line using a four-step model. The model might accurately predict ridership on the new line, but might not accurately reflect the ripple effects – such as increased development along the corridor and the subsequent shift in car travel from other modes.
Q 9. Describe different types of travel demand models (e.g., static, dynamic).
Travel demand models can be categorized in several ways, one key distinction being static versus dynamic models.
Static Models: These models, like the traditional four-step model, assume a constant state of the transportation system and user behavior. They offer a snapshot of travel patterns for a specific time period. While simpler to implement, their limited ability to capture time-varying conditions can lead to significant inaccuracies.
Dynamic Models: These models explicitly account for time-varying factors, including congestion, incidents, and time-dependent travel choices. They provide a more realistic representation of traffic flow and user behavior throughout the day. Examples include dynamic traffic assignment (DTA) models, which simulate the evolution of traffic flows over time.
Other categorizations: Models can also be classified based on their spatial scale (e.g., regional, metropolitan, city-level), level of detail (aggregate vs. disaggregate), and the specific travel behavior being modeled (e.g., trip generation, mode choice, route choice).
For example, a static model might only predict average commute times during the morning peak, while a dynamic model can predict commute times at different intervals throughout the peak period, accounting for congestion buildup and dissipation.
Q 10. How do you validate a travel demand model?
Validating a travel demand model is crucial to ensure its reliability and accuracy. This involves a multi-step process comparing model outputs to observed data.
Data Comparison: The most direct validation method involves comparing model-predicted travel patterns (e.g., trip volumes, mode shares, travel times) against observed data from sources like traffic counts, household travel surveys, and GPS data. Statistical measures like RMSE (Root Mean Squared Error) and R-squared are used to quantify the goodness of fit.
Scenario Testing: Testing the model’s response to different scenarios (e.g., changes in land use, transportation infrastructure improvements) allows for validation under varied conditions. The model’s response should be both reasonable and consistent with expected behavior.
Sensitivity Analysis: Evaluating the model’s sensitivity to changes in input parameters helps assess its robustness. A model with high sensitivity to minor input changes might not be reliable.
Internal Consistency Checks: Examining the consistency of the model’s internal workings, such as ensuring that the predicted total number of trips in a zone matches the generated trips, is also important.
Expert Review: Involving domain experts to evaluate the model’s structure, assumptions, and outputs adds a qualitative layer to validation.
For example, if a model predicts a 20% increase in bus ridership after a fare reduction, this prediction can be validated by comparing it with actual bus ridership data after the fare change. If the observed increase is significantly different, it indicates a need for model calibration or refinement.
Q 11. Explain the concept of Logit models in mode choice.
Logit models are a widely used class of discrete choice models employed in mode choice modeling. They provide a probabilistic framework for predicting the probability of an individual choosing a specific mode of transportation (car, bus, train, etc.) among available alternatives.
The core idea is that the utility (or attractiveness) of each mode is a function of its attributes, such as travel time, cost, comfort, and convenience. The Logit model assumes that the utility of each mode is randomly distributed according to a Gumbel distribution. This assumption leads to a closed-form expression for the probability of choosing each mode.
A basic multinomial logit (MNL) model can be expressed as:
Pi = exp(Vi) / Σj exp(Vj)where:
Piis the probability of choosing modeiViis the utility of modei, typically a linear function of its attributes (e.g.,Vi = β1*timei + β2*costi + β3*comforti)
The coefficients (β’s) are estimated using statistical techniques such as maximum likelihood estimation (MLE) from observed travel data.
Beyond the basic MNL, more complex models like nested logit and mixed logit address limitations of MNL such as the independence from irrelevant alternatives (IIA) property.
For example, if we are modeling mode choice between car, bus, and train, a Logit model would estimate the probability of choosing each mode based on factors like travel time, cost, and waiting time for each alternative. The model parameters would reflect the relative importance of these attributes in influencing mode choice.
Q 12. How do you incorporate land use data into a travel demand model?
Land use data plays a crucial role in travel demand modeling as it dictates the origins and destinations of trips. Integrating land use data involves linking it to the transportation network through a process called spatial interaction modeling.
Zone System Definition: Land use data is typically aggregated into zones. These zones form the basis for trip generation and distribution models. The characteristics of each zone, such as population density, employment density, and land use mix, inform trip generation and attraction rates.
Trip Generation and Attraction: Land use data is used to estimate the number of trips originating (generated) and ending (attracted) in each zone. Regression models, often calibrated using observed travel data, are commonly used to relate these trip rates to land use characteristics.
Trip Distribution: The distribution of trips between zones is often modeled using spatial interaction models such as the gravity model or the intervening opportunities model. These models consider the spatial separation between zones and the attractiveness of each zone (often reflected by its land use characteristics).
Calibration and Validation: The parameters of land use related trip generation and distribution models are calibrated using observed travel data, and the models are validated to ensure they accurately reflect the relationship between land use and travel patterns.
For example, a high-density residential zone might generate a large number of trips in the morning peak as residents commute to work. Conversely, a high-density employment center would attract a large number of trips during the same period.
Q 13. What are the different types of network data used in travel demand modeling?
Network data is the backbone of any travel demand model, providing the infrastructure on which trips are routed. Different types of network data are utilized depending on the model’s scope and complexity.
Node-Link Data: This is the most common format representing the network as a set of nodes (intersections, origins, and destinations) connected by links (road segments, transit lines). This data includes attributes for each link such as length, free-flow speed, capacity, and number of lanes. Data formats include shapefiles, CSV files, or specialized network databases.
Transit Network Data: For modeling transit systems, specialized data is needed describing routes, schedules, stop locations, and transfer times between routes. General Transit Feed Specification (GTFS) is a common standard for this data.
Pedestrian and Bicycle Networks: Modeling non-motorized modes requires separate network data representing pedestrian walkways and bicycle paths, including attributes relevant to these modes (e.g., grade, surface type).
Multimodal Networks: Integrated multimodal networks combine data from multiple modes, allowing modeling of transfers and mode shifts.
The quality and completeness of the network data are critical for accurate model predictions. For instance, incorrect link lengths or speeds can lead to significant errors in travel time estimations, which in turn affects mode choice and route assignment results.
Q 14. Discuss the role of stated preference and revealed preference data.
Stated preference (SP) and revealed preference (RP) data are both vital in travel demand modeling but serve distinct purposes.
Revealed Preference (RP) Data: This data reflects actual travel choices made by individuals. Sources include household travel surveys, automatic vehicle identification (AVI) data, and GPS tracking data. RP data provides information on individuals’ actual travel behavior under existing conditions, which is invaluable for model calibration and validation.
Stated Preference (SP) Data: This data is collected through surveys or experiments where individuals are presented with hypothetical scenarios and asked about their choices. SP data is useful for assessing potential changes in travel behavior under different conditions (e.g., changes in travel times, costs, or service levels) that haven’t yet occurred in reality. This is particularly valuable when modeling the impact of new technologies or policies.
For example, RP data from a travel survey might show that 60% of commuters choose to drive to work. Simultaneously, SP data from a survey presenting hypothetical scenarios with different bus service levels could show that this percentage could increase to 75% with improved bus service frequency.
Often, a combined approach utilizing both RP and SP data provides the most comprehensive understanding of travel behavior and allows for more robust and reliable model development.
Q 15. How do you address issues of model instability?
Model instability in travel demand modeling refers to situations where small changes in input data lead to disproportionately large changes in model outputs. This can be due to several factors, including poorly calibrated models, insufficient data, or inappropriate model structures. Addressing this requires a multi-pronged approach.
Data Quality Enhancement: The most crucial step is ensuring high-quality input data. This involves thorough data cleaning, validation, and error correction. Outliers and inconsistencies can significantly destabilize a model. For instance, if you’re using census data, ensuring accuracy of population counts and trip generation rates is vital.
Model Calibration and Validation: Rigorous calibration and validation are essential. Calibration involves adjusting model parameters to match observed data, while validation uses independent data to assess the model’s performance and stability. Using multiple calibration datasets and techniques helps avoid overfitting.
Model Structure and Specification: An improperly specified model can be highly unstable. For example, using a linear model where a non-linear relationship exists between variables can lead to inaccurate and unstable predictions. Exploring alternative model structures and assessing their stability is vital.
Regularization Techniques: Techniques like ridge regression or LASSO can help to reduce the impact of highly influential variables and improve model stability by adding a penalty to large coefficients.
Sensitivity Analysis: A thorough sensitivity analysis helps identify parameters or inputs that significantly influence model output variability. This can guide data collection efforts and inform strategies to enhance stability.
Imagine building a house of cards – a single misplaced card can cause the entire structure to collapse. Similarly, a poorly calibrated or structured travel demand model is highly vulnerable to instability.
Career Expert Tips:
- Ace those interviews! Prepare effectively by reviewing the Top 50 Most Common Interview Questions on ResumeGemini.
- Navigate your job search with confidence! Explore a wide range of Career Tips on ResumeGemini. Learn about common challenges and recommendations to overcome them.
- Craft the perfect resume! Master the Art of Resume Writing with ResumeGemini’s guide. Showcase your unique qualifications and achievements effectively.
- Don’t miss out on holiday savings! Build your dream resume with ResumeGemini’s ATS optimized templates.
Q 16. What are some common sources of error in travel demand modeling?
Errors in travel demand modeling stem from various sources, often intertwined. Some common ones are:
Data Errors: Inaccurate or incomplete data is a major source of error. This includes errors in origin-destination (OD) matrices, network data (missing links, incorrect speeds), and socioeconomic data (population, income).
Model Specification Errors: Incorrectly specifying the model structure, functional forms, or assumptions about traveler behavior can lead to significant errors. For instance, ignoring the impact of specific transportation technologies or misrepresenting the behavioral aspects of route choice may cause biased results.
Calibration Errors: Poorly calibrated models fail to accurately represent observed travel patterns, resulting in substantial errors in forecasting. Overfitting to the calibration data can lead to poor generalization to new scenarios.
Aggregation Errors: Aggregating data to a coarser level (e.g., using zones instead of individual households) can mask important details and create inaccuracies. The zone system itself can be a source of error if not designed appropriately.
External Factors: Unexpected events like natural disasters, economic downturns, or policy changes can significantly influence travel patterns and affect the accuracy of forecasts. Models may not adequately account for these unforeseen circumstances.
Think of baking a cake – if you use incorrect ingredients or follow a faulty recipe, the end result will be flawed. Similarly, errors in any stage of travel demand modeling can compromise the quality and reliability of the forecast.
Q 17. Explain the concept of sensitivity analysis in a travel demand model.
Sensitivity analysis in a travel demand model assesses the impact of changes in input parameters on model outputs. It helps identify the most influential variables and quantify their effects. This allows modelers to understand the robustness of their predictions and prioritize data collection or model refinement efforts.
A common approach involves systematically varying one parameter at a time, while holding others constant, and observing the change in key output metrics (e.g., total vehicle kilometers traveled, average trip time). This can be done using various techniques, including:
One-at-a-time (OAT) sensitivity analysis: The simplest approach, where parameters are varied individually.
Global sensitivity analysis: Techniques like variance-based methods (e.g., Sobol indices) are used to assess the influence of multiple parameters simultaneously.
For example, you might assess the sensitivity of predicted traffic volume to changes in fuel prices or the impact of a new transit line on overall commute times. The results would highlight which parameters require more precise estimation or further investigation.
Imagine a weather forecast: a small change in temperature input might lead to a dramatic shift in the predicted rainfall. Similarly, in travel demand models, even minor variations in certain input parameters can significantly affect the forecast.
Q 18. How do you handle uncertainty in travel demand forecasting?
Uncertainty in travel demand forecasting is inherent due to many factors (data limitations, model simplifications, unexpected events). Addressing this involves several strategies:
Probabilistic Modeling: Instead of point estimates, use probabilistic models that provide a range of possible outcomes. This could involve Bayesian methods or Monte Carlo simulations.
Scenario Planning: Develop multiple scenarios representing different assumptions about future conditions (e.g., economic growth, technological advancements, policy changes). This helps explore a range of potential outcomes under different conditions.
Ensemble Modeling: Combine predictions from multiple models to reduce uncertainty and obtain more robust forecasts.
Uncertainty Quantification: Quantify the uncertainty associated with model outputs, using confidence intervals or prediction intervals. This provides a measure of the reliability of the forecasts.
Consider stock market predictions: No one can predict the exact future stock price, but probabilistic models and scenario planning can provide a range of possible outcomes and associated probabilities. Similarly, in travel demand modeling, acknowledging and quantifying uncertainty is crucial for making informed decisions.
Q 19. Describe different types of network assignment models (e.g., all-or-nothing, user equilibrium).
Network assignment models distribute trips on a transportation network. Two common types are:
All-or-Nothing Assignment: This simplistic model assigns all trips from an origin to a destination via the shortest path. It ignores congestion and assumes all travelers choose the same route.
Example: If route A is shortest, all trips use route A.While computationally simple, it’s unrealistic because it doesn’t reflect the decentralized route choice behavior of travelers.User Equilibrium (UE) Assignment: This model assumes each traveler chooses a path that minimizes their individual travel time, given the choices of other travelers. This accounts for congestion as travel times depend on the traffic volume on each route. Finding UE solutions often requires iterative algorithms, such as the Frank-Wolfe algorithm. It provides a more realistic representation of network flows under congestion.
Other assignment models, such as stochastic user equilibrium (SUE), incorporate randomness in route choice behavior to better represent the variability in individual choices.
Think of rush hour traffic: All-or-nothing assignment would predict that everyone takes the same route, leading to massive congestion. UE assignment, however, accounts for the fact that people might choose slightly different routes to avoid the worst congestion, leading to a more realistic distribution of traffic.
Q 20. How do you incorporate transit into a travel demand model?
Incorporating transit into a travel demand model requires considering its unique characteristics, which differ significantly from driving. This involves:
Transit Network Representation: Represent the transit network with its stops, lines, schedules, and transfer opportunities. This typically involves a separate network layer from the road network.
Transit Assignment Models: Use specialized transit assignment models that account for factors such as waiting times, transfer penalties, and headway (frequency of service). These often utilize algorithms different from those used for road networks.
Mode Choice Modeling: Include a mode choice model that considers the relative attractiveness of transit compared to other modes (driving, walking, cycling). This model considers factors like travel time, cost, comfort, and convenience.
Transit Supply Data: Acquire accurate data on transit schedules, frequencies, and service levels. This data is crucial for realistic simulation of transit operations.
A common approach involves integrating transit and road networks into a multimodal model where travelers choose between different modes based on their perceived utility, which is often influenced by factors such as cost, travel time, and waiting time. This requires a more complex model structure than a model only considering road networks.
Imagine planning a trip: You wouldn’t simply use a road map if you’re considering taking public transport. Similarly, a travel demand model must account for the unique characteristics and constraints of transit to provide accurate forecasts.
Q 21. What are the implications of different time periods (e.g., peak vs. off-peak) in a model?
Different time periods (peak vs. off-peak) have significant implications in travel demand modeling because travel behavior changes substantially throughout the day. Peak periods (typically morning and evening commutes) are characterized by higher traffic volumes, longer travel times, and a higher demand for transportation services. Off-peak periods have significantly lower traffic volumes and faster travel times.
Network Congestion: Peak periods experience significant network congestion, impacting travel times and route choices. Off-peak periods usually exhibit free-flow conditions or minimal congestion.
Demand Variation: Trip generation and trip distribution patterns vary dramatically between peak and off-peak periods. The types of trips undertaken also change, with more commuting trips during peak periods and leisure and shopping trips during off-peak periods.
Transit Service Levels: Transit service levels (frequency and capacity) often differ between peak and off-peak periods, affecting transit accessibility and utilization.
Model Calibration: Separate calibration of the model for peak and off-peak periods is crucial to accurately capture the different travel behaviors.
Imagine a highway: During rush hour (peak), the highway is packed, with vehicles crawling at low speeds. Outside rush hour (off-peak), the highway is clear, and vehicles move freely. A travel demand model needs to account for this fundamental difference in congestion levels and travel behaviors to accurately reflect reality.
Q 22. Explain the concept of accessibility in travel demand modeling.
Accessibility in travel demand modeling refers to the ease with which individuals can reach different destinations within a transportation network. It’s not just about the physical presence of roads or transit lines, but also about the time and cost associated with travel. A highly accessible location is easily reachable from many origins, while a less accessible location might be difficult to reach due to long travel times, high fares, or lack of convenient transport options.
We often quantify accessibility using indicators like travel time, travel cost, and the number of opportunities (jobs, services, etc.) reachable within a certain time or cost threshold. For example, we might calculate the average travel time from residential areas to employment centers to assess accessibility to jobs. A low average travel time suggests good accessibility, while a high average travel time indicates poor accessibility.
In practice, accessibility analysis helps in urban planning. Imagine a city planning a new subway line. By modeling accessibility changes, planners can anticipate the positive effects on areas previously underserved and the potential impacts on existing transportation patterns.
Q 23. How do you incorporate behavioral factors into a travel demand model?
Incorporating behavioral factors is crucial for building realistic travel demand models. People don’t always make rational choices based solely on minimizing travel time or cost; their decisions are influenced by a complex interplay of psychological, social, and economic factors. These factors influence mode choice, route choice, and the overall decision to travel or not.
We can incorporate behavioral factors using various techniques. For example, stated preference (SP) surveys directly ask individuals about their travel choices under different scenarios. Revealed preference (RP) data, on the other hand, observes actual travel choices and infers preferences from these observations. Discrete choice models (like logit models) are frequently used to analyze both SP and RP data and estimate the influence of behavioral factors such as perceived safety, comfort, convenience, and environmental concerns.
Consider the example of choosing between driving and using public transportation. A simple model might only consider travel time and cost. A more sophisticated model would also incorporate factors like the perceived safety of walking to a bus stop, the comfort of the bus, the availability of parking, and even the individual’s attitude towards environmental sustainability.
Q 24. What are some emerging trends in travel demand modeling?
Travel demand modeling is a dynamic field, constantly evolving with technological advancements and changing travel patterns. Here are some key emerging trends:
- Increased use of big data and data analytics: The availability of large datasets from various sources (GPS traces, smart card data, social media) is revolutionizing how we build and calibrate models, allowing for more granular and accurate predictions.
- Integration of agent-based modeling (ABM): ABM simulates the individual decision-making processes of travelers, leading to more realistic representations of complex interactions and emergent phenomena within the transportation system.
- Focus on sustainable transport and micro-mobility: Models are increasingly incorporating the effects of electric vehicles, ride-sharing, bike-sharing, and walking on traffic flows and emissions.
- Enhanced incorporation of uncertainty and risk: Methods are being developed to better account for uncertainties in future travel demand, infrastructure development, and policy interventions.
- Application of Artificial Intelligence (AI) and Machine Learning (ML): AI and ML techniques offer new possibilities for improving model calibration, forecasting, and the identification of patterns and anomalies in travel data.
Q 25. Discuss the importance of data quality in travel demand modeling.
Data quality is paramount in travel demand modeling. Garbage in, garbage out is a very apt phrase here. Inaccurate or incomplete data will lead to flawed models and unreliable predictions, potentially resulting in inefficient or even harmful transportation planning decisions.
Data quality issues can arise from various sources, including:
- Measurement errors: Inaccurate GPS tracking or incomplete trip reporting in surveys.
- Sampling bias: Surveys that do not represent the population accurately.
- Data inconsistencies: Discrepancies between different datasets.
- Missing data: Gaps in information that can hinder the analysis.
To address these issues, rigorous data validation and cleaning procedures are necessary. This includes checking for outliers, inconsistencies, and missing values; employing appropriate imputation techniques to fill in missing data; and using appropriate statistical methods to account for sampling errors.
For instance, a survey might find that many respondents underreport their car trips, potentially due to social desirability bias. Understanding this bias and correcting for it is crucial to getting a true picture of travel behavior.
Q 26. How do you present the results of a travel demand model to a non-technical audience?
Presenting complex model results to a non-technical audience requires clear and concise communication, avoiding jargon. Instead of presenting tables of numbers, I would focus on visual aids and storytelling.
My strategy would be:
- Use maps and charts: Visual representations of travel patterns, congestion levels, or accessibility changes are easier to understand than numerical data.
- Focus on key findings: Highlight the most significant results and their implications for the audience.
- Use simple language: Avoid technical terms and explain concepts in a clear and straightforward manner.
- Provide real-world examples: Illustrate the results with relatable scenarios and analogies.
- Prepare a summary document: A concise document summarizing the key findings and their implications would help the audience refer to the information later.
For example, instead of saying “The model predicts a 15% increase in peak-hour traffic on Highway 101,” I might say, “Our analysis suggests that rush hour traffic on Highway 101 will be significantly worse, potentially leading to longer commutes for many people.” Accompanying this with a clear map highlighting the affected areas further enhances understanding.
Q 27. Describe a situation where you had to overcome a challenge in a travel demand modeling project.
In a recent project modeling the impact of a new light rail system, we encountered significant challenges with data availability. The existing data on public transport ridership was incomplete and inconsistent across various sources. Some data were missing altogether, while others had significant errors. This directly impacted the accuracy and reliability of our model.
To overcome this challenge, we adopted a multi-pronged approach:
- Data triangulation: We compared the available data from multiple sources (e.g., smart card data, passenger counts, and surveys) to identify discrepancies and inconsistencies. Where data was missing, we used other data sources to fill in the gaps.
- Data imputation: For remaining gaps, we employed statistical imputation techniques to estimate missing values based on available data and known patterns in ridership.
- Sensitivity analysis: We performed sensitivity analysis to assess how the model’s predictions changed under different assumptions about the missing data, allowing us to quantify the uncertainty associated with the imputations.
- Collaboration with stakeholders: We worked closely with local transit authorities to gather additional data and validate our assumptions.
Through this systematic approach, we were able to produce a reasonably reliable model, although we clearly communicated the limitations and uncertainties due to data availability in our final report.
Key Topics to Learn for Travel Demand Modeling Interview
- Trip Generation: Understanding factors influencing trip origins and destinations. Practical application: Analyzing land use data to predict daily trips generated from a new residential development.
- Trip Distribution: Modeling how trips are distributed across different zones. Practical application: Using gravity models or other distribution techniques to allocate trips between origin and destination zones.
- Mode Choice: Predicting the probability of individuals selecting different transportation modes (car, transit, bike, walk). Practical application: Evaluating the impact of transit improvements on mode share.
- Traffic Assignment: Determining the flow of traffic on the network based on trip assignments and route choices. Practical application: Simulating congestion and travel times under different traffic management scenarios.
- Calibration and Validation: Refining model parameters and ensuring accuracy through comparison with real-world data. Practical application: Using observed traffic counts to adjust model parameters for better predictive capabilities.
- Data Analysis and Visualization: Proficiency in handling large datasets and visualizing model outputs effectively. Practical application: Creating clear and concise maps and charts to present model findings to stakeholders.
- Software Proficiency: Familiarity with common Travel Demand Modeling software packages (e.g., Cube, Visum, TransCAD). Practical application: Demonstrating expertise in using these tools for data processing and model building.
- Advanced Modeling Techniques: Exposure to more sophisticated approaches like agent-based modeling or dynamic traffic assignment. Practical application: Understanding the strengths and limitations of various modeling techniques and choosing the appropriate method for a specific project.
Next Steps
Mastering Travel Demand Modeling opens doors to exciting and impactful careers in transportation planning, urban development, and environmental consulting. To significantly boost your job prospects, creating a strong, ATS-friendly resume is crucial. ResumeGemini can be a valuable partner in this process, helping you craft a professional and compelling resume that highlights your skills and experience. Examples of resumes tailored to Travel Demand Modeling are available within ResumeGemini to provide further guidance and inspiration. Invest in your future – build a standout resume today!
Explore more articles
Users Rating of Our Blogs
Share Your Experience
We value your feedback! Please rate our content and share your thoughts (optional).
What Readers Say About Our Blog
Hello,
We found issues with your domain’s email setup that may be sending your messages to spam or blocking them completely. InboxShield Mini shows you how to fix it in minutes — no tech skills required.
Scan your domain now for details: https://inboxshield-mini.com/
— Adam @ InboxShield Mini
Reply STOP to unsubscribe
Hi, are you owner of interviewgemini.com? What if I told you I could help you find extra time in your schedule, reconnect with leads you didn’t even realize you missed, and bring in more “I want to work with you” conversations, without increasing your ad spend or hiring a full-time employee?
All with a flexible, budget-friendly service that could easily pay for itself. Sounds good?
Would it be nice to jump on a quick 10-minute call so I can show you exactly how we make this work?
Best,
Hapei
Marketing Director
Hey, I know you’re the owner of interviewgemini.com. I’ll be quick.
Fundraising for your business is tough and time-consuming. We make it easier by guaranteeing two private investor meetings each month, for six months. No demos, no pitch events – just direct introductions to active investors matched to your startup.
If youR17;re raising, this could help you build real momentum. Want me to send more info?
Hi, I represent an SEO company that specialises in getting you AI citations and higher rankings on Google. I’d like to offer you a 100% free SEO audit for your website. Would you be interested?
Hi, I represent an SEO company that specialises in getting you AI citations and higher rankings on Google. I’d like to offer you a 100% free SEO audit for your website. Would you be interested?
good
