Every successful interview starts with knowing what to expect. In this blog, we’ll take you through the top Trend Forecasting and Market Analysis interview questions, breaking them down with expert tips to help you deliver impactful answers. Step into your next interview fully prepared and ready to succeed.
Questions Asked in Trend Forecasting and Market Analysis Interview
Q 1. Explain your understanding of different forecasting methodologies (e.g., time series, regression, qualitative).
Trend forecasting relies on various methodologies, each with its strengths and weaknesses. Choosing the right method depends heavily on the data available and the nature of the trend being predicted.
- Time Series Analysis: This method uses historical data to predict future values. It assumes that past patterns will continue into the future. Common techniques include moving averages, exponential smoothing, and ARIMA modeling. For example, predicting monthly sales based on the past year’s sales data falls under this category.
ARIMA(p,d,q)models, for instance, use autoregressive (p), integrated (d), and moving average (q) components to capture patterns in time-series data. - Regression Analysis: This statistical method identifies the relationship between a dependent variable (e.g., sales) and one or more independent variables (e.g., price, advertising spend). Linear regression is the most common type, but other forms like multiple regression and logistic regression exist. Imagine predicting the demand for electric vehicles based on factors like gas prices, government incentives, and charging infrastructure availability. This would be a prime use case for regression analysis.
- Qualitative Forecasting: This approach relies on expert opinions, surveys, and market research to predict future trends. Methods include Delphi method (gathering expert opinions anonymously), market research surveys, and focus groups. Predicting the success of a new product launch using customer feedback and industry expert interviews would be a typical application.
In practice, I often combine these methods for a more robust forecast. For example, I might use time series analysis to establish a baseline prediction, then adjust it based on insights from qualitative research and regression analysis incorporating macroeconomic factors.
Q 2. Describe your experience with market research methodologies.
My experience with market research methodologies is extensive, encompassing both quantitative and qualitative approaches. I’ve utilized a wide range of techniques, including:
- Surveys: Designing and administering online, telephone, and in-person surveys to gather data on consumer preferences, purchasing behavior, and brand perceptions.
- Focus Groups: Facilitating group discussions to explore in-depth consumer opinions and gain qualitative insights.
- Interviews: Conducting one-on-one interviews to delve deeper into individual experiences and perspectives.
- Secondary Research: Analyzing publicly available data from sources like market reports, industry publications, and government statistics.
- Competitive Analysis: Evaluating competitor strategies, market positioning, and strengths and weaknesses.
- Data Analytics: Using statistical software like R and Python to analyze large datasets and identify key trends and patterns.
In a recent project, we used a mixed-methods approach combining survey data on consumer preferences with focus group insights to inform the development of a new product line. The quantitative data provided a broad understanding of market demand, while the qualitative data helped refine the product features and messaging.
Q 3. How do you identify and assess key market trends?
Identifying and assessing key market trends involves a systematic approach. It’s not just about spotting a change; it’s about understanding its significance and potential impact.
- Data Mining: I leverage various data sources, including market research reports, social media trends, news articles, and consumer reviews to identify emerging patterns and shifts in consumer behavior.
- Trend Analysis: I use statistical techniques to identify significant trends and separate noise from meaningful change. This includes analyzing data for patterns, seasonality, and cyclical fluctuations.
- SWOT Analysis: Understanding the strengths, weaknesses, opportunities, and threats related to each identified trend helps determine its true potential and risks.
- Expert Interviews: Engaging with industry experts and thought leaders provides valuable insights and alternative perspectives, helping to validate or challenge initial observations.
- Scenario Planning: Developing multiple possible scenarios for the future helps to prepare for a range of potential outcomes based on different trend developments.
For instance, recently, I observed a growing trend towards sustainable and ethically sourced products. Through data analysis and expert interviews, I confirmed the trend’s strength and determined the factors driving consumer demand. This allowed me to advise my clients on incorporating sustainable practices into their business models.
Q 4. What are some common pitfalls in trend forecasting, and how can they be avoided?
Trend forecasting is prone to several pitfalls. Recognizing and mitigating these is crucial for accurate predictions.
- Confirmation Bias: Overemphasizing data that supports pre-existing beliefs and ignoring contradictory evidence. This can be countered by actively seeking out dissenting opinions and rigorously testing hypotheses.
- Extrapolation Bias: Assuming that past trends will continue indefinitely without considering potential shifts or disruptive events. Robust scenario planning and incorporating potential black swan events can help mitigate this.
- Ignoring Qualitative Data: Relying solely on quantitative data and neglecting valuable insights from qualitative research. A balanced approach incorporating both is crucial.
- Data Limitations: Drawing conclusions based on incomplete or inaccurate data. Careful data validation, quality control, and understanding data limitations are vital.
- Overconfidence: Overestimating the precision of forecasts. Presenting forecast ranges and acknowledging uncertainty are essential.
For example, in predicting the rise of online shopping, simply extrapolating past growth rates would have underestimated the impact of technological advancements and changing consumer habits. A more comprehensive approach would have considered these factors and provided a more accurate forecast.
Q 5. How do you handle conflicting data sources when conducting market analysis?
Conflicting data sources are common in market analysis. Resolving discrepancies requires a careful and systematic approach:
- Data Source Evaluation: Assessing the reliability and credibility of each data source. Consider the methodology used, sample size, potential biases, and reputation of the source.
- Data Triangulation: Comparing data from multiple sources to identify patterns and inconsistencies. Convergence across multiple sources strengthens the validity of the findings.
- Data Reconciliation: Attempting to resolve discrepancies by identifying potential errors, inconsistencies, or differences in definitions.
- Expert Judgment: Consulting with industry experts to interpret conflicting data and provide informed judgments.
- Sensitivity Analysis: Assessing the impact of different data assumptions on the overall conclusions. This helps to understand the range of potential outcomes.
Imagine having conflicting sales figures from two different reporting systems. I would first investigate the data collection methodologies of each system, checking for data entry errors or inconsistencies in definitions. Then, I might reconcile the data by identifying and correcting errors or using a weighted average if the discrepancies can’t be fully resolved. Finally, sensitivity analysis would show the impact of using either data set on the overall forecast.
Q 6. How do you measure the accuracy of your forecasts?
Measuring forecast accuracy is crucial for evaluating the effectiveness of the forecasting methodology and improving future predictions. Several metrics can be employed:
- Mean Absolute Deviation (MAD): The average absolute difference between the forecasted and actual values. A lower MAD indicates higher accuracy.
- Mean Squared Error (MSE): The average of the squared differences between the forecasted and actual values. MSE gives more weight to larger errors.
- Root Mean Squared Error (RMSE): The square root of the MSE. RMSE is easier to interpret than MSE because it’s in the same units as the original data.
- Mean Absolute Percentage Error (MAPE): The average absolute percentage difference between the forecasted and actual values. MAPE is useful for comparing accuracy across different datasets with varying scales.
The choice of metric depends on the specific context and the relative importance of different types of errors. I often use multiple metrics to get a comprehensive assessment of forecast accuracy. For instance, a low RMSE might indicate good overall accuracy, but a high MAPE might suggest significant errors in forecasting particularly high or low values.
Q 7. Explain your experience with market segmentation and targeting.
Market segmentation and targeting are essential for effective marketing and product development. My experience encompasses various segmentation strategies:
- Demographic Segmentation: Dividing the market based on age, gender, income, education, occupation, family size, etc. For example, targeting a younger demographic with products emphasizing affordability and trendy designs.
- Geographic Segmentation: Dividing the market based on location, climate, population density, etc. For instance, tailoring products to suit regional preferences.
- Psychographic Segmentation: Dividing the market based on lifestyle, values, personality traits, interests, etc. For example, targeting environmentally conscious consumers with sustainable products.
- Behavioral Segmentation: Dividing the market based on purchasing behavior, brand loyalty, usage rate, etc. For example, targeting frequent buyers with loyalty programs or exclusive offers.
After segmenting the market, I then help clients develop targeted marketing strategies and product offerings that resonate with each specific segment’s needs and preferences. For example, in a recent project, we segmented the market for athletic apparel based on both demographic and psychographic factors, resulting in distinct marketing campaigns for different segments. This targeted approach led to significantly improved campaign performance compared to a generalized marketing strategy.
Q 8. Describe a time you had to make a critical decision based on market analysis. What was the outcome?
One critical decision I made involved forecasting the impact of a new competitor entering the sustainable packaging market. My analysis involved examining their projected production capacity, pricing strategies, marketing reach, and the overall market saturation. I combined quantitative data like historical sales figures and projected market growth with qualitative factors such as brand perception surveys and expert interviews to determine the potential threat.
My quantitative analysis suggested a moderate market share disruption, while qualitative feedback indicated a strong potential for consumer adoption of the competitor’s eco-friendly branding. Based on this combined analysis, I recommended a proactive strategy: launching a new product line with improved sustainability features to maintain our market share and strengthen our brand position. This involved a significant investment in R&D and marketing, but the outcome justified the risk. We not only retained our market position but also saw an increase in sales due to our enhanced product offering, demonstrating the importance of integrating both quantitative and qualitative data in strategic decision-making.
Q 9. How do you incorporate qualitative data into your quantitative analysis?
Incorporating qualitative data into quantitative analysis is crucial for a complete picture. Quantitative data provides the numbers – sales figures, market size, etc. – while qualitative data gives the context – consumer preferences, brand perception, market sentiment. Think of it like having a map (quantitative) and a travel guide (qualitative).
I use a mixed-methods approach. For example, I might run regression analysis (quantitative) to predict sales based on price and advertising spend. Simultaneously, I’ll conduct focus groups or surveys (qualitative) to understand consumer attitudes towards the product and its marketing. By triangulating the data – comparing findings from both quantitative and qualitative analyses – I can validate my findings and identify potential biases or limitations in either dataset. The qualitative insights often help me interpret the statistical results, offering deeper understanding and explaining unexpected trends or anomalies.
Q 10. How do you use statistical software (e.g., R, Python, SPSS) for market analysis?
Statistical software is essential for my work. I’m proficient in R and Python. I use R for its extensive statistical packages like ggplot2 for data visualization and dplyr for data manipulation. For instance, I might use lm() for linear regression to model the relationship between advertising spend and sales. Python’s libraries like pandas and scikit-learn are excellent for data cleaning, preprocessing, and more advanced machine learning techniques.
# Example R code for linear regression model <- lm(sales ~ advertising_spend, data = mydata) summary(model)
I use these tools to perform various analyses such as time series forecasting, cluster analysis for market segmentation, and A/B testing to evaluate marketing campaign effectiveness. The ability to automate data processing, build predictive models, and create insightful visualizations is critical for efficient and accurate market analysis.
Q 11. Explain your understanding of Porter’s Five Forces.
Porter’s Five Forces is a framework for analyzing the competitive intensity and attractiveness of an industry. It helps determine the potential profitability and sustainability of a business within a specific market.
- Threat of New Entrants: How easy is it for new competitors to enter the market? High barriers to entry (e.g., high capital requirements, strong brand loyalty) reduce this threat.
- Bargaining Power of Suppliers: How much power do suppliers have to raise prices or reduce quality? A few dominant suppliers increase their bargaining power.
- Bargaining Power of Buyers: How much power do customers have to negotiate prices or demand better terms? Large, concentrated buyers have more leverage.
- Threat of Substitute Products or Services: Are there alternative products or services that could fulfill the same customer need? The availability of close substitutes increases competitive pressure.
- Rivalry Among Existing Competitors: How intense is the competition between existing firms in the market? Factors such as numerous competitors, slow industry growth, and high fixed costs intensify rivalry.
By analyzing these five forces, businesses can understand their competitive landscape, identify opportunities, and develop appropriate strategies. For example, a company facing intense rivalry might focus on differentiation or cost leadership to gain a competitive edge. A company with powerful suppliers might explore vertical integration.
Q 12. How do you stay current with industry trends and developments?
Staying current is paramount. I employ a multi-faceted approach:
- Industry Publications and Reports: I regularly read leading industry publications, research reports from firms like Gartner and Forrester, and government data releases to grasp emerging trends and macro-economic factors.
- Conferences and Webinars: Attending industry conferences and webinars allows me to network with experts and learn about the latest innovations and developments firsthand.
- Online Resources: I leverage online resources like industry-specific blogs, social media groups, and research databases to track real-time developments and engage with industry discussions.
- Competitive Monitoring: I actively monitor competitors’ activities, including their product launches, marketing campaigns, and financial performance, to anticipate their moves and adjust strategies accordingly.
This continuous learning ensures my analyses are informed by the most up-to-date information, leading to more accurate forecasts and effective strategic recommendations.
Q 13. How familiar are you with competitive analysis techniques?
I’m very familiar with competitive analysis techniques. My approach typically involves:
- Market Mapping: Identifying key competitors and their market positions.
- Competitive Profiling: Analyzing competitors’ strengths, weaknesses, strategies, and resources.
- SWOT Analysis: Evaluating the strengths, weaknesses, opportunities, and threats for each competitor and for our own organization.
- Value Chain Analysis: Examining the value creation process for each competitor and identifying areas for improvement.
- Scenario Planning: Developing different scenarios to anticipate competitors’ potential actions and our own responses.
This detailed analysis enables me to identify competitive advantages, anticipate threats, and develop effective strategies for market penetration, differentiation, and sustainable growth. I regularly use these techniques to inform go-to-market strategies and pricing decisions.
Q 14. How do you present complex market data to non-technical audiences?
Presenting complex data to non-technical audiences requires clear, concise communication and effective visualization. I avoid jargon and technical terms whenever possible. Instead, I focus on telling a story using simple language and compelling visuals. Here’s my approach:
- Visualizations: I use charts, graphs, and infographics to present data in an easy-to-understand format. For example, instead of presenting a table of numbers, I might use a bar chart to visually compare market share across different competitors.
- Analogies and Metaphors: I use simple analogies and metaphors to explain complex concepts. For instance, I might compare market segmentation to slicing a cake into different pieces to illustrate different customer groups.
- Storytelling: I frame my presentation as a narrative, outlining the key findings and their implications in a logical and engaging manner.
- Key Takeaways: I summarize the main points of my presentation, emphasizing the key insights and recommendations.
The goal is to communicate the essence of the data clearly, enabling the audience to grasp the key findings and make informed decisions without needing a deep understanding of statistical methods.
Q 15. Describe your experience with data visualization tools.
Data visualization is crucial for communicating complex market trends effectively. My experience spans several tools, including Tableau, Power BI, and Python libraries like Matplotlib and Seaborn. I’m proficient in creating various chart types – from simple bar charts to more complex heatmaps and interactive dashboards – tailored to the specific audience and insights being presented. For instance, when analyzing consumer purchasing patterns, I might use a heatmap to visualize sales across different demographics and product categories, instantly highlighting key trends. In another project, I built an interactive dashboard in Tableau that allowed stakeholders to filter sales data by region, time period, and product line, enabling them to explore the data independently and draw their own conclusions. Choosing the right tool depends heavily on the data volume, the complexity of the analysis, and the audience’s technical proficiency.
Career Expert Tips:
- Ace those interviews! Prepare effectively by reviewing the Top 50 Most Common Interview Questions on ResumeGemini.
- Navigate your job search with confidence! Explore a wide range of Career Tips on ResumeGemini. Learn about common challenges and recommendations to overcome them.
- Craft the perfect resume! Master the Art of Resume Writing with ResumeGemini’s guide. Showcase your unique qualifications and achievements effectively.
- Don’t miss out on holiday savings! Build your dream resume with ResumeGemini’s ATS optimized templates.
Q 16. How do you assess the potential impact of macroeconomic factors on market trends?
Assessing the impact of macroeconomic factors is a critical aspect of trend forecasting. I employ a multi-faceted approach. Firstly, I identify relevant macroeconomic indicators, such as inflation rates, interest rates, GDP growth, unemployment levels, and currency exchange rates. Then, I analyze their historical relationships with the market I’m studying. For example, a rise in interest rates might negatively impact consumer spending on big-ticket items like cars and houses, while a strong currency could negatively affect export-oriented businesses. I use statistical methods like regression analysis to quantify these relationships and forecast potential impacts. Qualitative factors also play a crucial role; I consider geopolitical events, government policies, and consumer sentiment. For example, a sudden geopolitical crisis can drastically alter consumer behavior and market dynamics. This holistic approach, combining quantitative and qualitative analysis, allows for a more nuanced and accurate assessment of macroeconomic influence.
Q 17. How do you identify emerging markets and opportunities?
Identifying emerging markets and opportunities requires a combination of data analysis and forward-thinking. I start by analyzing demographic trends, technological advancements, and shifts in consumer behavior. For example, the growth of e-commerce in developing nations presents significant opportunities for businesses that can adapt to these markets. I also closely monitor industry reports, competitor activity, and emerging technologies to pinpoint areas of potential disruption. A strong understanding of global supply chains and political climates is vital. For instance, I might identify an underserved market in a region with growing disposable income and limited access to a particular product or service. My analysis includes assessing the market size, potential competition, regulatory hurdles, and cultural nuances. Furthermore, I use scenario planning to evaluate potential future outcomes and assess risk associated with entering new markets. This proactive approach allows us to capitalize on emerging opportunities while mitigating potential risks.
Q 18. How do you determine the reliability of market data?
Determining the reliability of market data is paramount. I assess data reliability using several methods. First, I identify the source. Is it a reputable research firm, government agency, or an industry association? I then evaluate the methodology employed in data collection – was the sample size adequate, was the sampling method unbiased, and were there any potential sources of error? I also cross-reference data from multiple sources to check for consistency. Discrepancies might indicate inaccuracies or biases. Finally, I analyze the data’s timeliness – outdated information is less reliable. For example, if I’m using sales data, I’ll ensure it’s current and accounts for seasonality. By applying these checks, I build confidence in the accuracy of the data used in my analyses and forecasts, minimizing the risk of making decisions based on flawed information.
Q 19. Describe your experience with market sizing and potential.
Market sizing and potential assessment are crucial for strategic decision-making. My experience involves using both top-down and bottom-up approaches. The top-down approach starts with broad market indicators (like overall market revenue) and applies market share estimates to determine the potential for a specific segment. The bottom-up approach starts by analyzing individual customer segments and extrapolating to estimate total market size. I utilize various models, including regression analysis and market penetration models, to refine my estimates. For example, when assessing the potential for a new product, I might examine the number of potential customers, their average purchasing power, and the projected market penetration rate. This gives a range of potential market size and revenue that allows for informed business decisions, such as investment levels and marketing strategies.
Q 20. How do you quantify the value of market insights?
Quantifying the value of market insights depends on their impact on business decisions. I typically use a few methods. First, I demonstrate how the insights have improved forecasting accuracy, leading to better resource allocation and risk management. This might include a comparison of the accuracy of forecasts made with and without the insights. Second, I quantify the financial impact of decisions made based on these insights – for example, how much additional revenue was generated or how much cost was saved because of better-informed decisions. Third, I consider the insights’ contribution to competitive advantage, enabling the company to identify and capitalize on market opportunities before competitors. Ultimately, the value is demonstrated by linking insights directly to improved business outcomes, measurable in financial terms or market share gains.
Q 21. Explain your experience with A/B testing and its role in trend analysis.
A/B testing plays a significant role in trend analysis, particularly in understanding consumer preferences and optimizing marketing campaigns. My experience includes designing and implementing A/B tests to evaluate the effectiveness of different marketing messages, website designs, and product features. For example, I might run an A/B test comparing two different website layouts to see which one drives higher conversion rates. The results of these tests directly inform trend analysis by identifying which elements resonate most with consumers and which trends are gaining traction. Analyzing A/B test results helps validate hypotheses about emerging trends and informs future strategy. The data generated quantifies the impact of these variations, giving a precise understanding of user behavior and preferences, directly impacting future trend forecasts.
Q 22. How do you handle uncertainty and risk in forecasting?
Uncertainty and risk are inherent in forecasting. My approach involves acknowledging this uncertainty from the outset and building robustness into the process. This isn’t about eliminating risk, but about managing it effectively. I employ several key strategies:
- Scenario Planning: Instead of relying on a single point forecast, I develop multiple scenarios based on different assumptions about key variables (e.g., economic growth, competitor actions, technological advancements). Each scenario has a probability assigned to it, allowing for a range of possible outcomes rather than a single, potentially misleading prediction.
- Quantitative and Qualitative Methods: I combine quantitative methods like time series analysis, regression models, and econometric techniques with qualitative methods like expert interviews, Delphi studies, and focus groups. This approach integrates objective data with subjective insights, providing a more holistic and nuanced understanding of the future.
- Sensitivity Analysis: I systematically vary the input parameters of my models to assess their impact on the forecast. This reveals which variables are most influential and highlights areas of potential vulnerability. This helps me identify where further research or risk mitigation strategies might be needed.
- Regular Monitoring and Adjustment: Forecasts are not static. I continually monitor the relevant data and indicators, updating the models and adjusting the forecasts as new information becomes available. This iterative process allows for a more accurate and timely understanding of the evolving situation.
For instance, during the COVID-19 pandemic, relying solely on pre-pandemic trends would have been disastrous. Scenario planning that incorporated various pandemic severity levels proved crucial for agile decision-making.
Q 23. How would you approach a situation where your forecast is significantly different from other internal projections?
A significant discrepancy between my forecast and internal projections demands a thorough investigation. It’s crucial to avoid ego or defensiveness and instead focus on finding the root cause of the divergence. My approach would include:
- Reconciling Data Sources and Methodologies: I would first meticulously compare the data sources and methodologies used by both teams. Are we using the same definitions, data sets, and analytical techniques? Minor differences in these areas can lead to substantial variations in the outcome.
- Identifying Underlying Assumptions: I would then examine the underlying assumptions built into each forecast. Different assumptions about future market conditions, consumer behavior, or competitor actions will inevitably lead to different predictions. Open discussion is key to clarifying these assumptions.
- Assessing the Validity of Assumptions: A critical step is to evaluate the validity of the assumptions made. We might need to conduct further research to validate or refute them. This could involve reviewing new data, conducting additional market research, or consulting with subject matter experts.
- Presenting Findings and Recommendations: Once the discrepancies are understood, I’d present the findings and my proposed course of action to the relevant stakeholders. This might involve recommending a revised forecast, adopting a more robust methodology, or adjusting strategic plans based on the combined insights.
In one instance, a difference in forecast stemmed from a competitor’s unexpected launch of a disruptive technology. Incorporating this new information into the model resolved the discrepancy and improved the accuracy of our subsequent projections.
Q 24. Describe your experience using different forecasting software packages.
I’m proficient in several forecasting software packages, each with its strengths and weaknesses. My experience includes:
- SAS: A powerful statistical software suite ideal for complex econometric modeling, time series analysis, and forecasting. I’ve used SAS to build sophisticated models incorporating macroeconomic variables, demographic data, and other relevant factors.
- R: A flexible and open-source statistical programming language well-suited for data manipulation, visualization, and building custom forecasting models. Its vast library of packages provides access to advanced statistical techniques and allows for tailoring solutions to specific needs.
- EViews: A user-friendly econometrics software package frequently used for time series analysis and forecasting. I appreciate EViews for its ease of use and its ability to handle large datasets.
- Spreadsheet Software (Excel): Although simpler than dedicated statistical packages, spreadsheet software provides a valuable tool for data exploration, basic forecasting techniques, and data visualization. I frequently use Excel for preliminary analysis and for presenting findings in a clear and accessible manner.
The choice of software depends heavily on the complexity of the forecasting task, the availability of data, and the specific analytical needs of the project. I prioritize selecting the tool best suited for the job, rather than being limited to one specific platform.
Q 25. How do you incorporate consumer behavior insights into market analysis?
Incorporating consumer behavior insights is critical for accurate market analysis. It’s not enough to simply track sales figures; we need to understand the ‘why’ behind those numbers. I use a combination of methods:
- Consumer Surveys and Focus Groups: These qualitative methods provide in-depth understanding of consumer preferences, attitudes, and motivations. Direct interaction allows for exploring nuances that quantitative data often misses.
- Social Media Listening and Sentiment Analysis: Analyzing social media conversations, reviews, and online forums helps identify emerging trends, understand brand perception, and gauge consumer sentiment towards products and services.
- Market Research Databases: Access to commercial databases such as Nielsen, Mintel, or Statista provides rich consumer demographic and behavioral data, enriching forecasting models.
- Web Analytics and CRM Data: Analyzing website traffic, customer interactions, and purchase history from CRM systems provides valuable insights into consumer behavior on a granular level, informing future marketing strategies and product development.
For example, analyzing social media sentiment during a product launch can quickly identify potential issues and allow for proactive adjustments to marketing or product development. Integrating this data into the forecasting model significantly improves its accuracy and enables more effective decision-making.
Q 26. Explain the difference between leading, lagging, and coincident indicators.
Leading, lagging, and coincident indicators are crucial economic indicators used in forecasting. They differ in their timing relative to the overall economic cycle:
- Leading Indicators: These indicators tend to change *before* a change in the overall economy. They predict future economic activity. Examples include:
- Stock market prices
- Building permits
- Consumer confidence index
- Lagging Indicators: These indicators change *after* a change in the overall economy. They confirm past economic activity. Examples include:
- Unemployment rate
- Inflation rate
- Prime interest rates
- Coincident Indicators: These indicators move *at the same time* as the overall economy. They provide a current snapshot of the economy. Examples include:
- Gross Domestic Product (GDP)
- Personal income
- Industrial production
Imagine a thermometer: a leading indicator might be a change in barometric pressure (predicting a storm); a lagging indicator could be the damage after the storm has passed; a coincident indicator is the actual temperature during the storm.
Q 27. What are the ethical considerations when conducting market research?
Ethical considerations are paramount in market research. Maintaining integrity and protecting participants’ rights is crucial. Key ethical considerations include:
- Informed Consent: Participants must be fully informed about the purpose of the research, how their data will be used, and their right to withdraw at any time without penalty.
- Data Privacy and Confidentiality: All data collected must be treated with strict confidentiality, complying with relevant data protection regulations (e.g., GDPR, CCPA). Anonymizing data where possible is essential.
- Avoiding Bias and Manipulation: Research designs and questions must be carefully constructed to avoid bias and manipulation of results. Transparency and objectivity are crucial.
- Transparency and Honesty: Findings must be presented honestly and accurately, without misrepresenting results or selectively highlighting data to support a predetermined conclusion.
- Respect for Participants: Participants should be treated with respect and courtesy throughout the research process. Their time and input are valuable and should be acknowledged.
Failure to adhere to these ethical standards can damage reputation, lead to legal repercussions, and undermine the credibility of the research.
Q 28. How familiar are you with different types of market research reports?
I’m familiar with a range of market research reports, each designed to serve specific purposes. These include:
- Market Sizing Reports: Estimate the size and growth potential of a specific market, often segmented by geography, demographics, or product type.
- Competitive Analysis Reports: Assess the competitive landscape of a market, identifying key players, their strategies, and strengths and weaknesses.
- Consumer Behavior Reports: Analyze consumer attitudes, preferences, and purchasing behavior to understand market trends and opportunities.
- Product/Service Launch Reports: Evaluate the success of a new product or service launch, assessing market acceptance and identifying areas for improvement.
- Industry Trend Reports: Track emerging trends and developments within a specific industry to identify growth opportunities and potential risks.
- Forecasting Reports: Project future market growth and trends, providing insights for strategic planning and investment decisions.
Understanding the nuances of each report type is crucial for effectively interpreting market data and making informed strategic decisions. The specific format and content of each report would vary depending on the client’s needs and the research methodology used.
Key Topics to Learn for Trend Forecasting and Market Analysis Interview
- Macroeconomic Trends & Their Impact: Understanding how global economic shifts, inflation, and interest rates influence consumer behavior and market dynamics. Practical application: Analyzing historical data to predict future market performance based on macroeconomic indicators.
- Consumer Behavior Analysis: Exploring consumer segmentation, purchasing patterns, and the influence of demographics, psychographics, and lifestyle factors. Practical application: Developing targeted marketing strategies based on identified consumer segments and their evolving needs.
- Competitive Analysis: Evaluating competitors’ strengths, weaknesses, strategies, and market share. Practical application: Identifying opportunities for market penetration and developing strategies to gain a competitive advantage.
- Qualitative & Quantitative Research Methods: Mastering data collection techniques like surveys, focus groups, and interviews, alongside statistical analysis and data visualization. Practical application: Using data analysis to support trend predictions and strategic decision-making.
- Trend Identification & Forecasting Techniques: Exploring various forecasting methods, including time series analysis, regression modeling, and scenario planning. Practical application: Developing accurate and actionable forecasts for different market segments.
- Market Segmentation & Targeting: Defining distinct market segments based on relevant criteria and developing targeted strategies for each segment. Practical application: Optimizing marketing campaigns for maximum ROI based on specific target audience profiles.
- Data Visualization & Presentation: Effectively communicating insights and findings through clear and compelling data visualizations. Practical application: Presenting complex market analysis and forecasting results to stakeholders in a concise and impactful manner.
- Technological Advancements & Their Market Impact: Analyzing the disruptive potential of emerging technologies and their influence on market trends and consumer behavior. Practical application: Identifying opportunities and challenges related to technological advancements in your specific industry.
Next Steps
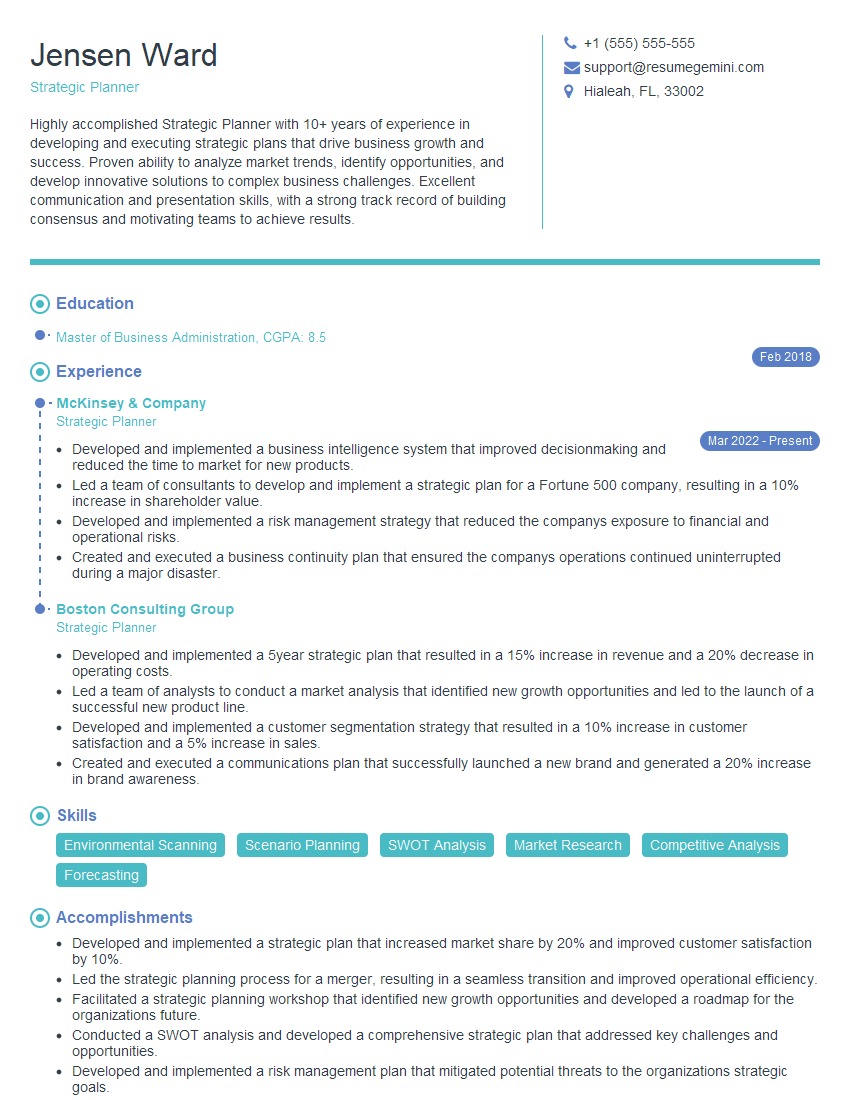
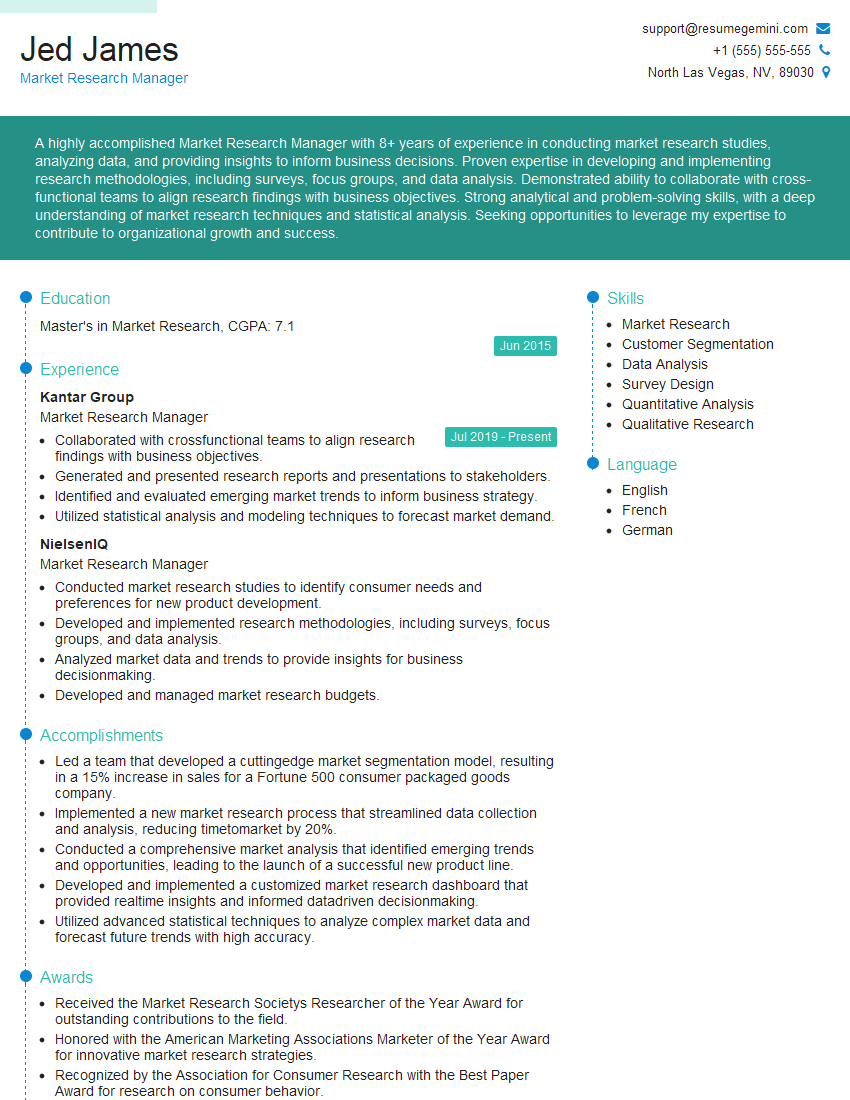
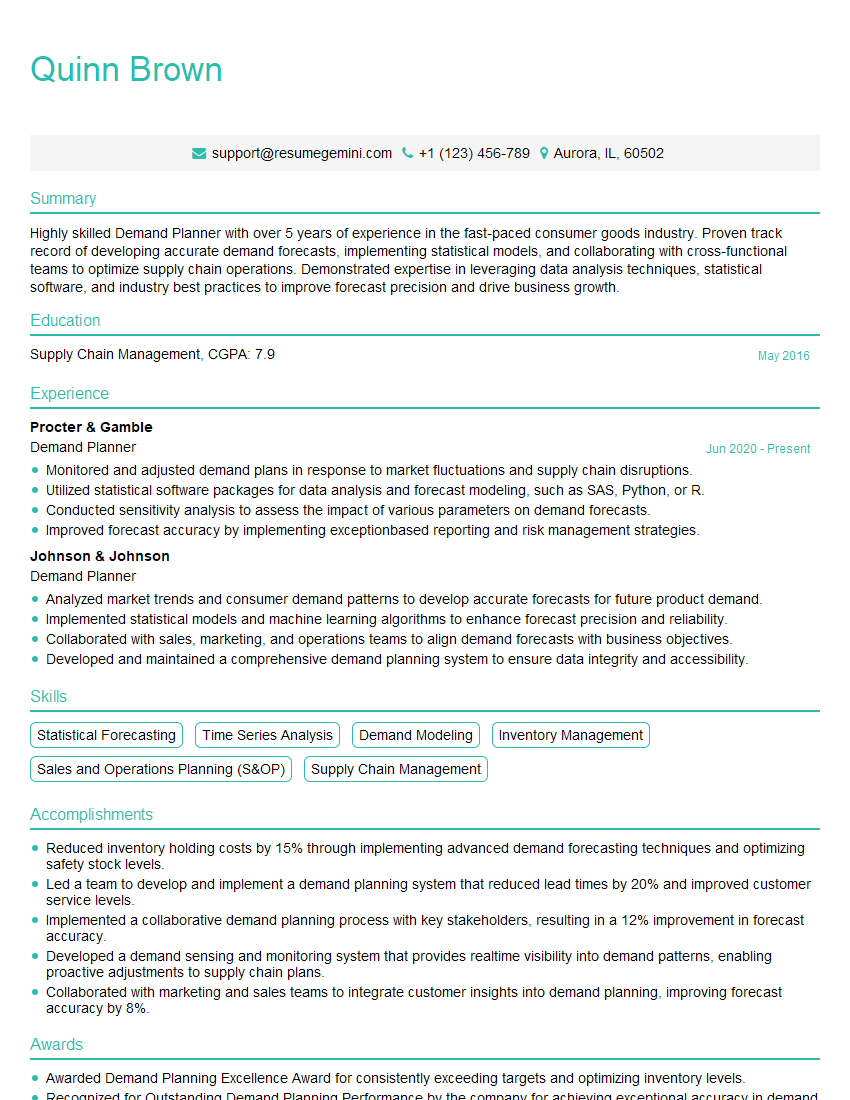
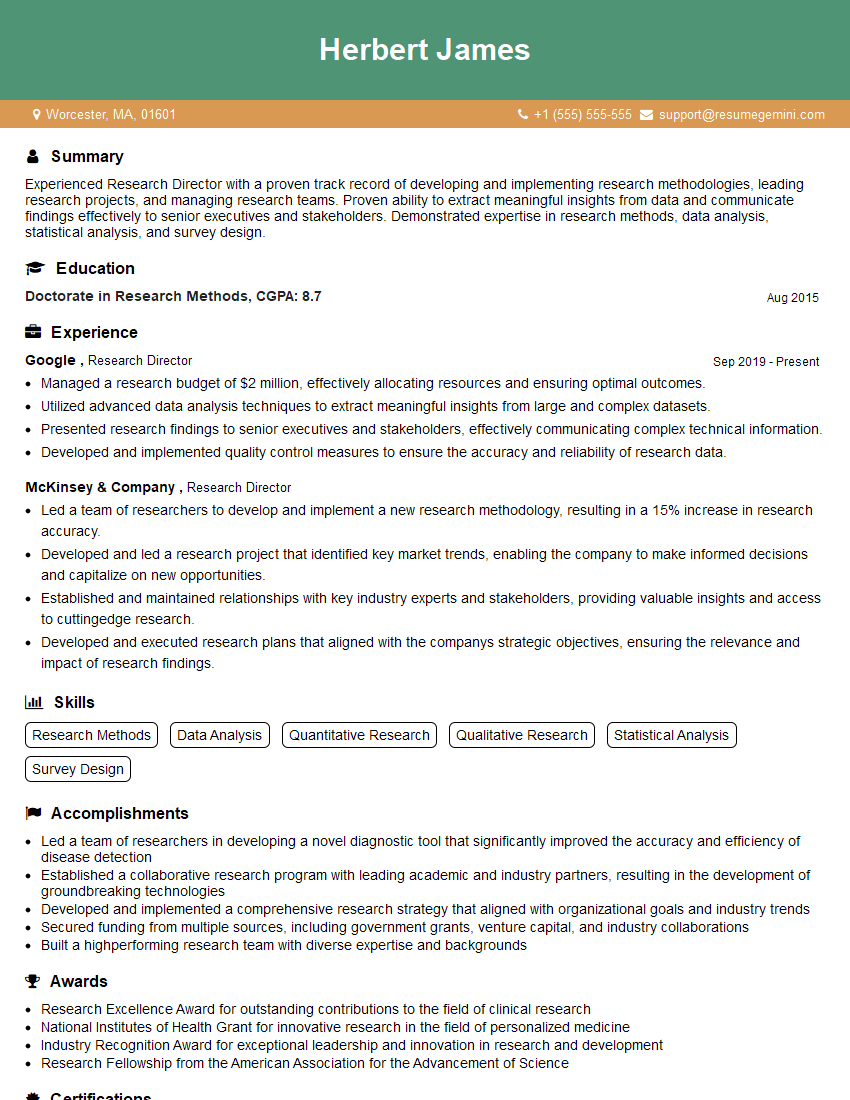
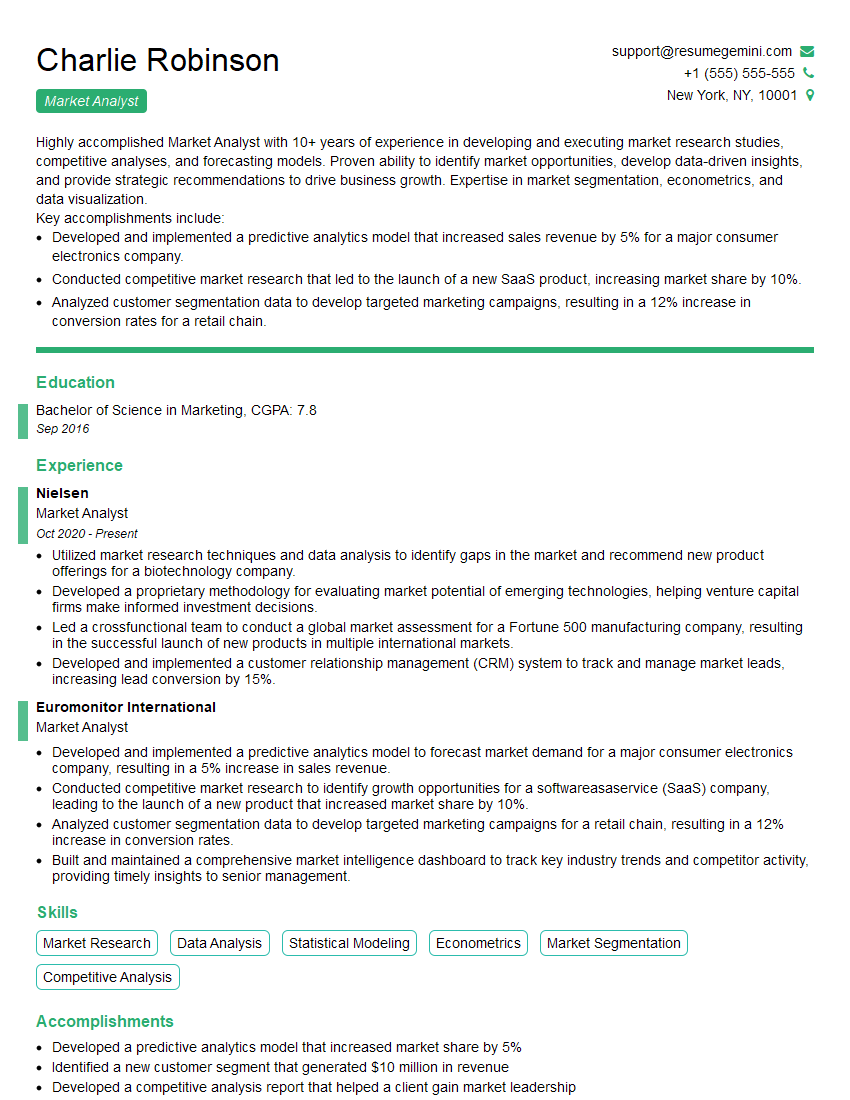
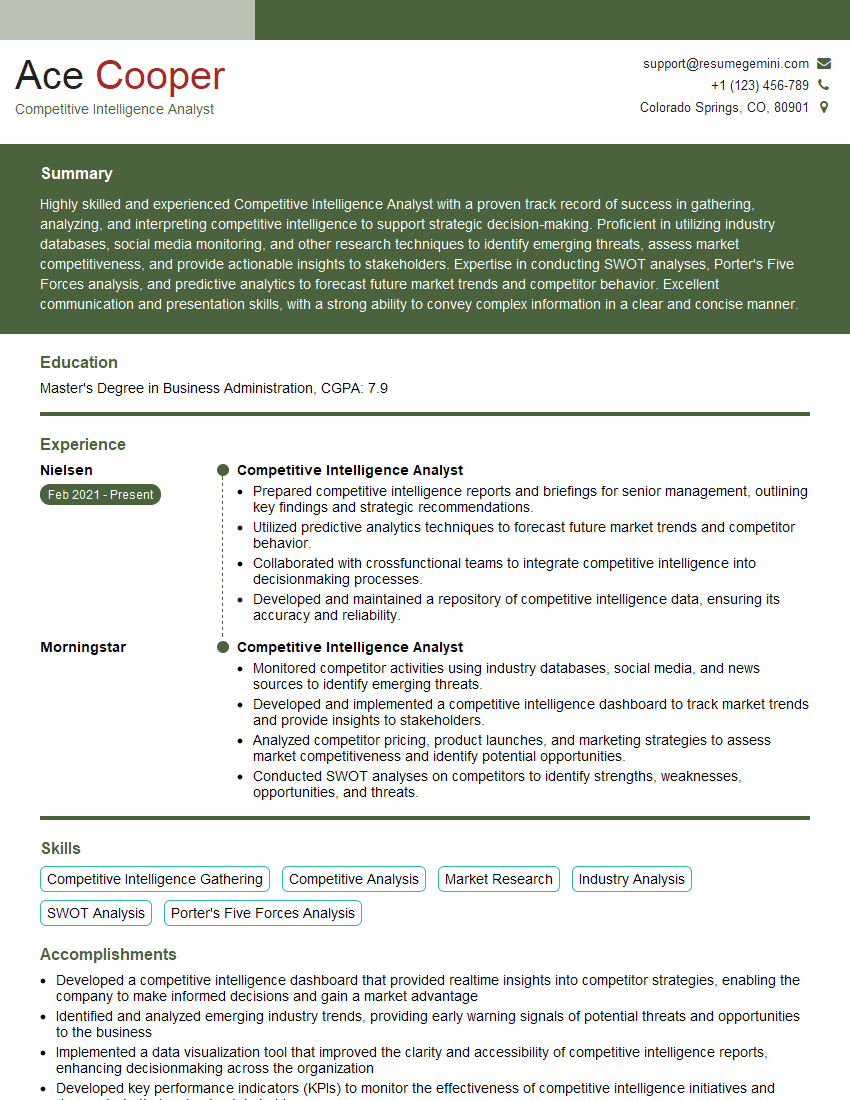
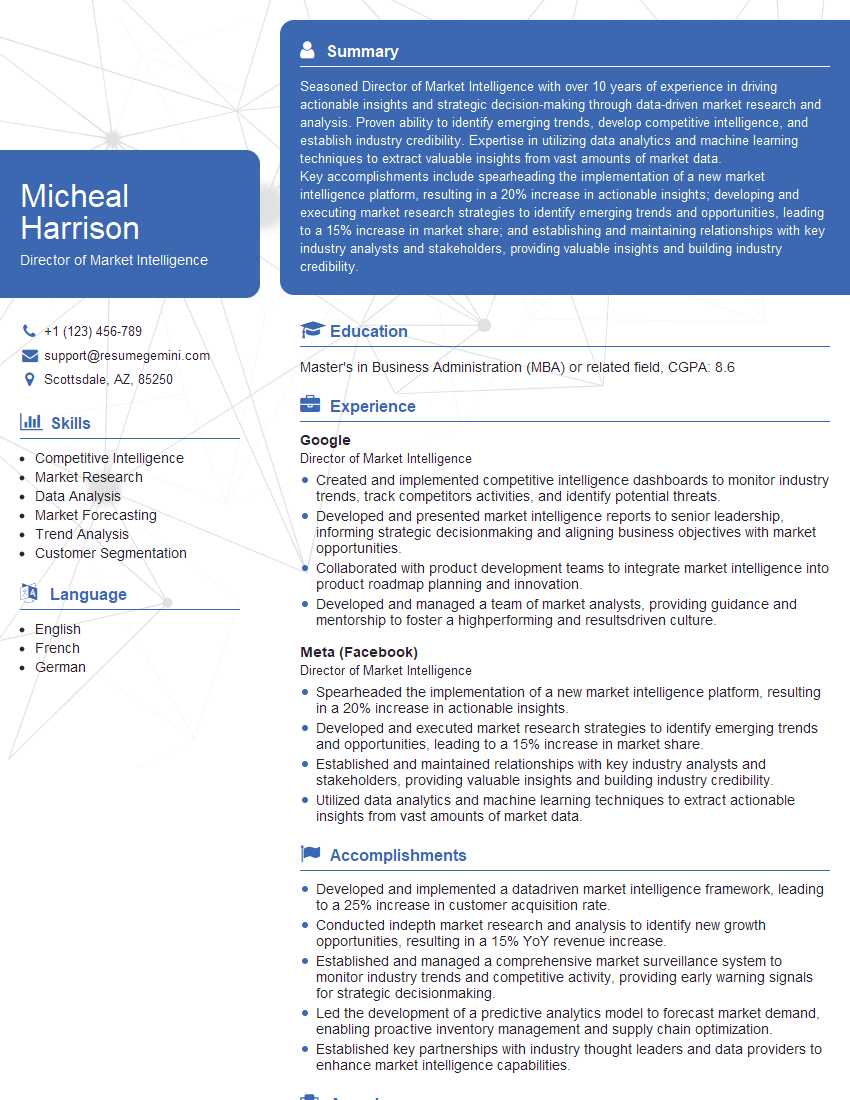
Mastering Trend Forecasting and Market Analysis is crucial for a successful career in today’s dynamic business landscape. It equips you with the critical skills to anticipate market shifts, identify opportunities, and drive strategic decision-making. To significantly increase your job prospects, it’s vital to craft an ATS-friendly resume that showcases your expertise effectively. ResumeGemini is a trusted resource that can help you build a professional and impactful resume, maximizing your chances of landing your dream role. Examples of resumes tailored to Trend Forecasting and Market Analysis are available to provide inspiration and guidance.
Explore more articles
Users Rating of Our Blogs
Share Your Experience
We value your feedback! Please rate our content and share your thoughts (optional).
What Readers Say About Our Blog
Hello,
We found issues with your domain’s email setup that may be sending your messages to spam or blocking them completely. InboxShield Mini shows you how to fix it in minutes — no tech skills required.
Scan your domain now for details: https://inboxshield-mini.com/
— Adam @ InboxShield Mini
Reply STOP to unsubscribe
Hi, are you owner of interviewgemini.com? What if I told you I could help you find extra time in your schedule, reconnect with leads you didn’t even realize you missed, and bring in more “I want to work with you” conversations, without increasing your ad spend or hiring a full-time employee?
All with a flexible, budget-friendly service that could easily pay for itself. Sounds good?
Would it be nice to jump on a quick 10-minute call so I can show you exactly how we make this work?
Best,
Hapei
Marketing Director
Hey, I know you’re the owner of interviewgemini.com. I’ll be quick.
Fundraising for your business is tough and time-consuming. We make it easier by guaranteeing two private investor meetings each month, for six months. No demos, no pitch events – just direct introductions to active investors matched to your startup.
If youR17;re raising, this could help you build real momentum. Want me to send more info?
Hi, I represent an SEO company that specialises in getting you AI citations and higher rankings on Google. I’d like to offer you a 100% free SEO audit for your website. Would you be interested?
Hi, I represent an SEO company that specialises in getting you AI citations and higher rankings on Google. I’d like to offer you a 100% free SEO audit for your website. Would you be interested?
good
