The right preparation can turn an interview into an opportunity to showcase your expertise. This guide to Weather Forecasting and Navigation interview questions is your ultimate resource, providing key insights and tips to help you ace your responses and stand out as a top candidate.
Questions Asked in Weather Forecasting and Navigation Interview
Q 1. Explain the difference between synoptic and mesoscale weather forecasting.
Synoptic and mesoscale forecasting differ primarily in their spatial and temporal scales. Synoptic forecasting focuses on large-scale weather systems, covering areas hundreds to thousands of kilometers, and predicting weather patterns over several days. Think of it like looking at a wide-angle lens view of the atmosphere. It uses data from numerous weather stations, satellites, and radar to analyze high-pressure systems, low-pressure systems, fronts, and jet streams. The output is typically a general weather forecast for a region.
Mesoscale forecasting, on the other hand, zooms in on smaller areas – tens to hundreds of kilometers – and shorter timeframes, from minutes to a few hours. This is like using a telephoto lens to examine specific atmospheric features. It’s crucial for predicting phenomena like thunderstorms, tornadoes, severe hail, and even localized flash floods. These predictions often rely on higher-resolution data and more sophisticated numerical models that can resolve finer details in the atmosphere.
For example, a synoptic forecast might predict rain for a state tomorrow, while a mesoscale forecast could pinpoint which counties within that state will see the heaviest rainfall and when.
Q 2. Describe the various types of weather models and their limitations.
Several types of weather models exist, each with its strengths and weaknesses. Numerical Weather Prediction (NWP) models are the backbone of modern forecasting. These models solve complex mathematical equations that represent atmospheric physics, using vast amounts of observational data as input. Different NWP models exist, varying in resolution (how finely they divide the atmosphere), complexity, and the physical processes they represent. Global models cover the entire planet but have coarser resolutions, while regional models focus on smaller areas with higher resolution, leading to more detail but potentially less accuracy for the larger picture.
Statistical models use historical weather data to find correlations and predict future weather conditions based on past patterns. These are simpler and faster than NWP models but often less accurate, especially for unusual or extreme events. Ensemble forecasting runs multiple NWP models with slightly different initial conditions to create a range of possible outcomes, offering a measure of forecast uncertainty.
Limitations include the accuracy of the initial data (garbage in, garbage out), limitations in representing complex atmospheric processes like cloud formation or turbulent airflow, and computational constraints that limit the resolution and complexity of models. Even the best models are not perfect and will always include uncertainties.
Q 3. How do you interpret weather charts and satellite imagery?
Interpreting weather charts and satellite imagery involves understanding the symbology and patterns representing atmospheric conditions. Weather charts typically show variables like temperature, pressure, wind, humidity, and precipitation. Isobars (lines of constant pressure), isotherms (lines of constant temperature), and isohyets (lines of constant precipitation) highlight gradients and patterns. For example, tightly packed isobars indicate strong pressure gradients and thus strong winds.
Satellite imagery provides visual representations of clouds, temperature, water vapor, and other atmospheric parameters. Different wavelengths of light reveal different aspects of the atmosphere. Visible imagery shows cloud cover and shape; infrared imagery depicts cloud-top temperatures, crucial for identifying severe thunderstorms (cold cloud tops suggest strong updrafts). Water vapor imagery illustrates the distribution of moisture in the atmosphere, which is essential for tracking storm systems.
Experienced meteorologists learn to identify weather patterns and features on these charts and images. A sequence of satellite images helps track storm movement and evolution, aiding in prediction. The combination of surface observations, charts and satellite imagery provides a holistic understanding of the atmospheric state.
Q 4. What are the key factors influencing marine navigation safety?
Marine navigation safety is significantly influenced by several key factors, all interconnected. Weather conditions are paramount, with factors like strong winds, high seas, reduced visibility (fog, rain, snow), and icing posing significant risks. Understanding and predicting these factors through weather forecasts is critical for safe passage.
Navigation equipment is essential, including GPS, radar, electronic charts, and Automatic Identification Systems (AIS), which provides vessel information such as location and course. Proper maintenance and operation of this equipment is critical.
Human factors play a significant role, including crew training and experience, navigational skills, fatigue, and adherence to safety procedures.
Environmental factors beyond weather include currents, tides, and shallow water hazards. Navigation should account for their potential impact, particularly for smaller vessels or those in unfamiliar waters.
Vessel condition is fundamental to safety, requiring regular maintenance, functioning safety equipment (life rafts, flares, emergency radios) and proper cargo securing. Finally, compliance with maritime regulations and best practices significantly minimizes risk.
Q 5. Explain the concept of GPS and its limitations in navigation.
GPS (Global Positioning System) relies on a constellation of satellites orbiting the Earth to pinpoint a receiver’s location through trilateration. Signals from multiple satellites are received, the time difference of arrival is measured, and this data is used to calculate the receiver’s position. GPS has become indispensable for navigation, offering accuracy typically within a few meters.
However, limitations exist. The accuracy can be degraded by atmospheric conditions (ionospheric and tropospheric delays), signal blockage (buildings, trees, canyons), and intentional or unintentional interference (jamming). The accuracy can also reduce significantly near the poles and under dense tree cover. Multipath error, when signals bounce off of surfaces, also reduces the accuracy of GPS signals. Differential GPS (DGPS) and other augmentation systems are used to improve the precision by providing correction signals.
In marine navigation, while GPS is incredibly useful, reliance on a single source of positioning information is risky. It’s essential to use GPS in conjunction with other navigational aids (charts, radar, compass) to ensure redundancy and backup systems. Therefore, while incredibly useful, it is vital to remember its limitations.
Q 6. How do you handle conflicting weather forecasts from different sources?
Conflicting weather forecasts from different sources require a careful and systematic approach. The first step is to assess the reliability and credibility of each source. Consider the reputation of the forecaster or institution, the model used, the resolution, and the track record of the source’s previous predictions. For example, a forecast from a national meteorological agency typically carries more weight than one from an amateur weather website.
Next, examine the differences in detail. Are the forecasts drastically different, or are the variations minor? Identify the specific parameters that show the most disagreement (e.g., timing of precipitation, wind speed). Look at the underlying reasoning and data used in each forecast.
Consider ensemble forecasting if available. A range of potential outcomes provides a better understanding of the uncertainty. Ultimately, a holistic approach is needed, weighting forecasts based on their credibility and synthesizing the information to form the most reasonable and conservative prediction. If in doubt, err on the side of caution. In critical scenarios, consulting with a senior or experienced meteorologist might be necessary to improve decision-making.
Q 7. What are the different types of navigational aids?
Navigational aids come in various forms, serving different purposes. Lighthouses and buoys provide visual markers of channels, hazards, and safe water areas. Radio beacons transmit signals to help vessels determine their position and track their course. GPS and other satellite-based navigation systems provide highly accurate positional information. Radar helps detect other vessels, landmasses, and navigational hazards in reduced visibility. Electronic charts (ENCs) display detailed navigational information, including depth contours, hazards, and aids to navigation.
AIS (Automatic Identification System) allows vessels to automatically broadcast their position and other data. LORAN-C (Long Range Navigation), while becoming less used, utilizes radio signals to provide medium-to long-range navigation in coastal regions. The specific types of aids used depend on location, type of vessel, and the mission profile. Proper training and knowledge of the use of these aids are critical for safe navigation.
Q 8. Describe the process of planning a safe flight route based on weather conditions.
Planning a safe flight route hinges on meticulously analyzing weather data to identify and mitigate potential hazards. The process involves several key steps. First, we consult various weather sources – aviation weather briefings, weather radar, satellite imagery, and surface observations – to get a comprehensive picture of the atmospheric conditions along the planned route and at the destination. This includes examining wind speed and direction, temperature, precipitation type and intensity, cloud cover, visibility, and the presence of turbulence or icing.
Next, we identify potential weather-related challenges, such as thunderstorms, icing conditions, low visibility, or strong headwinds. Based on this assessment, we may need to adjust the flight altitude, route, or even postpone the flight. For example, if we anticipate encountering a severe thunderstorm, we might reroute to avoid it, possibly taking a slightly longer but safer path. If icing conditions are anticipated, we might need to adjust the flight altitude or choose a different aircraft type altogether.
Crucially, we factor in safety margins. We don’t just aim to meet minimum weather requirements; we build in a buffer to account for unforeseen changes in weather or unexpected mechanical issues. This might involve selecting a route that provides more flexibility in case conditions deteriorate. Throughout the flight, we continuously monitor the weather and make adjustments as needed, ensuring passenger and crew safety is the top priority. It’s like planning a road trip – you wouldn’t just follow a map blindly; you’d check for traffic, road closures, and weather alerts along the way.
Q 9. How do you calculate wind correction angles for navigation?
Calculating wind correction angles (WCA) is essential for accurate navigation, especially in aviation. It’s the angle by which a pilot must steer the aircraft into the wind to maintain the desired ground track. Imagine trying to walk directly across a moving walkway – you’d need to angle yourself to counteract the walkway’s movement.
The calculation typically involves using vector addition or a flight computer. The key factors are the aircraft’s airspeed (the speed relative to the air), the wind speed, and the wind direction. A simple method, although not perfectly precise for high wind speeds, involves using a wind triangle. The desired ground track forms one side, the airspeed forms another side, and the wind speed forms the third. The angle between the ground track and the airspeed vector is the WCA.
For instance, if you have a headwind of 20 knots at 30 degrees and an airspeed of 100 knots, and you want to fly directly North, you’d need to use a flight computer or trigonometry (vector addition) to calculate the WCA needed to compensate for this headwind. The exact angle would depend on the wind strength and direction. Professional pilots rely on onboard computers or specialized flight calculators for precise WCA computation, ensuring that their course corrections are accurate and safe.
Q 10. Explain the concept of isobars and their significance in weather forecasting.
Isobars are lines on a weather map that connect points of equal atmospheric pressure. They’re fundamental in weather forecasting because they reveal the distribution of pressure, a key driver of wind and weather systems. Imagine isobars as contour lines on a topographic map, but instead of showing elevation, they show pressure.
Closely spaced isobars indicate a steep pressure gradient, signifying strong winds. Think of it like a river – a steep slope results in a fast current. Conversely, widely spaced isobars represent a gentle pressure gradient and lighter winds. The pattern of isobars can also reveal the presence of weather systems like cyclones (low-pressure systems with winds rotating counterclockwise in the Northern Hemisphere) and anticyclones (high-pressure systems with clockwise rotation in the Northern Hemisphere). These systems are associated with specific weather patterns: cyclones often bring cloudy and rainy conditions, while anticyclones usually bring clear skies and fair weather.
By analyzing the isobar patterns, meteorologists can predict wind speed and direction, forecast the movement of weather systems, and anticipate changes in weather conditions. They are a critical tool for short-term forecasting, helping us understand the immediate weather dynamics in a region.
Q 11. What are the different types of precipitation and how are they formed?
Precipitation refers to any form of water that falls from the atmosphere to the Earth’s surface. Several types exist, each with a unique formation process:
- Rain: Forms when cloud droplets grow large enough to overcome updrafts and fall as liquid water. This happens through a process called collision-coalescence, where smaller droplets collide and merge into larger ones.
- Snow: Forms when water vapor in clouds freezes directly into ice crystals. These crystals grow through deposition (direct conversion from vapor to ice) and aggregation (combining of ice crystals).
- Sleet: Begins as snow, but melts as it falls through a warm layer of air, only to refreeze before reaching the ground as small ice pellets.
- Freezing rain: Similar to sleet, it starts as snow but melts in a warm layer. However, it remains liquid as it falls and freezes upon contact with a surface below freezing.
- Hail: Forms within strong thunderstorms. Ice pellets are repeatedly lifted and lowered by strong updrafts, accumulating layers of ice until they become heavy enough to fall to the ground.
The formation of each precipitation type depends on temperature profiles within the atmosphere and the presence of cloud condensation nuclei (tiny particles that serve as surfaces for water vapor to condense).
Q 12. How do you interpret weather radar data?
Weather radar data provides a real-time picture of precipitation within a certain range. The radar transmits radio waves, and the amount of energy reflected back indicates the intensity and type of precipitation. Different colors or shades on a radar display represent various levels of precipitation intensity, from light rain to heavy snow. The radar can also show the movement of precipitation systems, helping forecasters to predict their future location and impact.
Interpreting weather radar involves recognizing patterns. For example, a bright red area indicates intense rainfall, potentially leading to flash floods. A hook-shaped echo can be indicative of a rotating thunderstorm, which may produce tornadoes. Meteorologists use radar data in conjunction with other weather information to make accurate and timely forecasts of severe weather events. The images provide a dynamic view of weather events unfolding, enabling effective warnings and preparedness measures.
Furthermore, some advanced radars can also detect the size and shape of hydrometeors (rain, snow, etc.), providing more information on the type and severity of the precipitation. Sophisticated algorithms help to analyze this data and create more accurate predictions.
Q 13. Describe the various types of clouds and their implications for weather.
Clouds are categorized based on their altitude and shape. Knowing cloud types is crucial for weather forecasting, as they are indicators of atmospheric conditions.
- High-level clouds (above 6,000 meters): These are typically made of ice crystals and include cirrus (wispy, feathery clouds), cirrostratus (thin, sheet-like clouds), and cirrocumulus (small, patchy clouds). Their presence often signifies fair weather, but sometimes they can precede an approaching storm.
- Mid-level clouds (2,000-6,000 meters): These are composed of water droplets or ice crystals and include altostratus (grayish or bluish sheet-like clouds) and altocumulus (patchy, layered clouds). Altostratus can indicate approaching precipitation.
- Low-level clouds (below 2,000 meters): These are mostly composed of water droplets and include stratus (uniform gray clouds), stratocumulus (lumpy gray clouds), and nimbostratus (dark gray rain clouds). Stratus often produces drizzle, while nimbostratus brings continuous rain or snow.
- Vertical clouds (extending through multiple levels): Cumulus (fluffy, puffy clouds) are typically fair-weather clouds, but cumulonimbus (towering clouds with anvil tops) are associated with thunderstorms, heavy rain, hail, and strong winds.
The presence, type, and movement of clouds provide valuable clues about the atmospheric stability, moisture content, and the likelihood of future weather conditions, informing short-term and long-term forecasts.
Q 14. What are the key factors influencing the formation of fog?
Fog formation is a complex process that requires the presence of water vapor and a mechanism for condensation to occur near the ground. Key factors include:
- Cooling of air to its dew point: This can happen through radiational cooling (loss of heat from the ground at night), advection (movement of warm, moist air over a cold surface), or evaporation (water evaporating into the air and cooling it).
- Sufficient water vapor: The air needs to be saturated or near saturation with water vapor for condensation to occur. This is often found in areas near bodies of water or where evaporation is significant.
- Condensation nuclei: Tiny particles in the air (dust, pollen, sea salt) provide surfaces for water vapor to condense upon, forming fog droplets. Without these nuclei, fog formation would be much less likely.
For example, radiation fog typically forms on clear nights when the ground cools rapidly, cooling the air near the surface to its dew point. Advection fog develops when warm, moist air moves over a cooler surface, causing the air to cool and condense. Understanding these factors allows for better prediction of fog formation and mitigation of its impact on transportation and other activities.
Q 15. How do you use weather information to predict sea state and currents?
Predicting sea state and currents relies heavily on weather information because wind, atmospheric pressure, and wave patterns directly influence ocean dynamics. Wind speed and direction are primary drivers of surface currents and wave generation. Strong winds create larger waves and more powerful currents. Atmospheric pressure systems, like high-pressure zones (anticyclones) and low-pressure zones (cyclones), also impact sea state and currents. High-pressure systems often lead to calmer seas, while low-pressure systems can generate stormy conditions with significant wave heights and strong currents.
We use weather models, which are sophisticated computer programs that simulate atmospheric processes, to predict wind speed, direction, and pressure patterns. These models provide data on wind speed, wave height, wave period, and direction at various locations and times, allowing us to forecast sea state. Oceanographic models, sometimes coupled with atmospheric models, are used to predict currents. These models incorporate factors like bathymetry (sea floor topography), tides, and temperature gradients to simulate current flow. By combining weather and oceanographic model outputs, we create a comprehensive picture of the expected sea state and currents in a particular area.
For example, a strong low-pressure system approaching a coastline would likely result in a forecast predicting high wave heights, strong winds, and powerful currents, cautioning mariners of hazardous conditions. Conversely, a high-pressure system would lead to a calmer sea state forecast, suggesting favorable conditions for navigation.
Career Expert Tips:
- Ace those interviews! Prepare effectively by reviewing the Top 50 Most Common Interview Questions on ResumeGemini.
- Navigate your job search with confidence! Explore a wide range of Career Tips on ResumeGemini. Learn about common challenges and recommendations to overcome them.
- Craft the perfect resume! Master the Art of Resume Writing with ResumeGemini’s guide. Showcase your unique qualifications and achievements effectively.
- Don’t miss out on holiday savings! Build your dream resume with ResumeGemini’s ATS optimized templates.
Q 16. Explain the concept of dead reckoning in navigation.
Dead reckoning (DR) is a navigation technique where we estimate a vessel’s position based on its known starting point, course, speed, and time elapsed. Think of it like following a map without actually seeing your current location – you’re making an educated guess based on where you started and how you’ve been traveling. It’s a crucial backup method, particularly when other navigational aids are unavailable or malfunctioning.
The process involves recording the vessel’s initial position, then continuously calculating its new position based on course and speed. Changes in course or speed are noted and incorporated into the calculation. A simple example: If a ship starts at position A, travels at 10 knots for 2 hours on a course of 090 degrees (east), its estimated position after 2 hours would be 20 nautical miles east of point A. This calculation uses basic trigonometry and considers factors such as leeway (the sideways drift caused by wind) and current (drift due to water movement).
DR isn’t perfectly accurate; errors accumulate over time due to variations in speed, course, currents, and leeway. Therefore, it’s always best to cross-reference DR positions with other navigation techniques (like GPS or celestial navigation) for better accuracy and safety.
Q 17. How do you use celestial navigation techniques?
Celestial navigation uses the positions of celestial bodies (sun, moon, stars, and planets) to determine a vessel’s latitude and longitude. It’s a time-tested technique, especially valuable when electronic systems fail. The key principle involves measuring the altitude (angle above the horizon) of celestial bodies and their azimuth (bearing) using a sextant.
The process involves:
- Identifying the celestial body: Using a nautical almanac or ephemeris, which provides the precise positions of celestial bodies at different times.
- Measuring the altitude and azimuth: A sextant is used to measure the altitude of the celestial body above the horizon. Azimuth is often determined using a compass or inferred from the sextant’s readings.
- Calculating the position: Using navigational tables or specialized calculators, the measured altitude and azimuth are used to determine the line of position (LOP), which represents all possible positions of the vessel on a great circle. At least two LOPs are required to determine a fix (precise position) via their intersection.
Celestial navigation requires a good understanding of spherical trigonometry, nautical astronomy, and the use of navigational tools. While demanding, its value as a backup navigation method remains significant, particularly in remote locations where other systems might be unreliable.
Q 18. Describe the process of using electronic charts (ENCs) for navigation.
Electronic charts (ENCs) are digital representations of nautical charts, offering numerous advantages over paper charts. They’re integrated into Electronic Chart Display and Information Systems (ECDIS), providing comprehensive navigational information and functionalities.
Using ENCs involves:
- Chart selection and loading: Selecting the appropriate ENCs covering the intended voyage area and loading them into the ECDIS.
- Route planning: Plotting a route on the ENC, considering factors like depth, obstructions, and traffic separation schemes.
- Position monitoring: The ECDIS constantly displays the vessel’s position on the ENC, overlaying this information with navigational data.
- Safety warnings: The system automatically provides warnings about shallow water, obstructions, restricted areas, and other hazards based on the vessel’s position and route.
- Data overlays: Additional information can be displayed over the ENC such as radar images, AIS data (Automatic Identification System, showing positions of other vessels), and meteorological data.
ENCs improve safety and efficiency through automated warnings, route planning tools, and seamless integration of various navigational data. Regular updates ensure the charts remain current, reflecting changes in the navigational environment.
Q 19. How do you determine the position of a vessel using GPS?
GPS (Global Positioning System) determines a vessel’s position by receiving signals from a constellation of satellites orbiting the Earth. At least four satellites are needed to accurately calculate three-dimensional position (latitude, longitude, and altitude).
The process works as follows:
- Signal reception: The GPS receiver on the vessel receives signals from multiple satellites.
- Time measurement: The receiver measures the precise time it takes for signals to travel from each satellite.
- Distance calculation: Knowing the speed of light, the receiver calculates the distance to each satellite.
- Position triangulation: Using the distances to at least four satellites, the receiver applies trilateration (geometric location calculation) to pinpoint the vessel’s position on Earth.
The accuracy of GPS is affected by atmospheric conditions, satellite geometry, and signal interference. Differential GPS (DGPS) and other augmentation systems improve accuracy by correcting for errors. GPS is a vital navigational tool, providing real-time position information for various applications including navigation, safety, and tracking.
Q 20. Explain the concept of collision avoidance using radar and ARPA.
Collision avoidance utilizes radar and Automatic Radar Plotting Aids (ARPA) to detect and track other vessels, preventing collisions at sea. Radar transmits radio waves that reflect off objects, providing information about their range, bearing, and speed.
ARPA enhances radar functionality by automatically tracking selected targets, predicting their future positions, and providing collision warnings. The process involves:
- Target detection: The radar detects other vessels and any potential hazards.
- Target tracking: ARPA automatically tracks selected targets, continuously updating their position, course, and speed.
- CPA (Closest Point of Approach) and TCPA (Time to Closest Point of Approach) calculation: ARPA calculates the closest point the vessel will approach a target and the time until this closest approach.
- Collision warning: If the CPA and TCPA indicate a potential collision, ARPA provides a warning.
- Maneuvering: The navigator uses the information from ARPA to plan and execute maneuvers to avoid collision, following the rules of the International Regulations for Preventing Collisions at Sea (COLREGs).
Radar and ARPA are not foolproof; proper seamanship, vigilance, and adherence to COLREGs are crucial. Factors like sea clutter (radar reflections from waves), target identification challenges, and electronic malfunctions must always be accounted for.
Q 21. What are the key elements of a pre-flight weather briefing?
A pre-flight weather briefing is crucial for safe and efficient flight operations. It provides pilots with essential meteorological information to make informed decisions regarding flight planning, route selection, and potential hazards.
Key elements include:
- Current weather conditions: Detailed information about weather at the departure, destination, and en-route locations, including visibility, cloud cover, temperature, wind, and precipitation.
- Forecast weather conditions: Predictions of weather changes during the planned flight time.
- Significant weather phenomena: Information on potential hazards such as thunderstorms, icing conditions, turbulence, strong winds, and low visibility.
- NOTAMs (Notices to Airmen): Alerts about temporary flight restrictions, airport closures, or other relevant information affecting flight operations.
- Air traffic information: Awareness of potential air traffic congestion or delays.
- Advisories and warnings: Specific alerts about severe weather or hazardous conditions that could impact flight safety.
The briefing’s format varies depending on the authority providing it (e.g., aviation weather service). The information received is tailored to the specific flight plan, route, and aircraft type. A thorough pre-flight weather briefing is vital for risk mitigation and ensuring safe and successful flight operations.
Q 22. How do you interpret weather forecasts for aviation purposes?
Interpreting weather forecasts for aviation requires a nuanced understanding beyond just temperature and wind. We look for parameters crucial for safe flight. This includes:
- Significant Weather Charts: These depict areas of thunderstorms, icing, turbulence, low clouds, and poor visibility. We meticulously examine the timing, intensity, and location of these phenomena along the planned flight path.
- Wind Forecasts: Headwinds and tailwinds significantly impact flight time and fuel consumption. Crosswinds influence takeoff and landing, requiring adjustments to approach procedures. We analyze wind speed, direction, and shear at various altitudes.
- Temperature Forecasts: Extreme temperatures affect aircraft performance, especially at higher altitudes where air density changes. Cold temperatures can lead to icing, while high temperatures can reduce engine efficiency. We assess temperature profiles throughout the flight.
- Visibility Forecasts: Low visibility due to fog, rain, or snow is a major safety concern. We determine the visibility forecast at departure, destination, and along the route to plan for instrument flight rules (IFR) procedures if necessary.
- Cloud Cover and Ceiling: The height of the cloud base (ceiling) determines whether visual flight rules (VFR) or IFR flight is permissible. We carefully examine the cloud cover, type, and altitude to ensure safe flight operations.
For example, if a forecast shows a line of thunderstorms along a planned route, we’d consider rerouting or delaying the flight to avoid hazardous conditions. A strong headwind would require recalculating fuel requirements to prevent fuel exhaustion.
Q 23. How do you assess the risk of icing conditions during flight?
Assessing icing risk involves a multi-faceted approach, combining weather data with aircraft specifications. We consider:
- Temperature and Dew Point: The closer the temperature and dew point are, the higher the likelihood of supercooled water droplets (liquid water below 0°C) forming ice on the aircraft. A temperature difference of less than 5°C is often a significant indicator.
- Liquid Water Content (LWC): This refers to the amount of supercooled water present in the clouds. Higher LWC leads to faster ice accumulation.
- Cloud Type: Certain cloud types, such as cumulonimbus (thunderstorm clouds) and stratiform clouds, are more prone to icing than others. We check for the presence of these clouds along the flight path.
- Altitude: Icing most often occurs at altitudes between 10,000 and 20,000 feet, in specific atmospheric layers.
Using weather models and charts, we create an icing probability forecast. This involves combining temperature, dew point, and LWC data to calculate the likelihood of encountering icing conditions. If the probability is high, alternative routes, delays, or de-icing procedures are implemented. Imagine flying through a cloud layer where the forecast predicts significant icing. We’d likely reroute to avoid the affected area or wait until the icing conditions subside.
Q 24. What are the different types of nautical charts?
Nautical charts are essential tools for marine navigation. They provide a visual representation of water bodies, including depths, hazards, and other crucial information. Different chart types cater to specific needs:
- General Charts: These provide a broad overview of a coastal area or ocean region, showing coastlines, depths, navigational aids, and other prominent features. They are useful for planning voyages and long-range navigation.
- Coastal Charts: These charts show more detail than general charts, focusing on coastal areas and harbors. They include information on navigational aids, shoals, reefs, and other hazards close to the coast.
- Harbor Charts: These are highly detailed charts of harbors and ports, showing docks, anchorages, mooring areas, and other specific information needed for navigating into and within a harbor.
- Electronic Navigational Charts (ENCs): These are digital versions of paper charts, often integrated into navigation systems. ENCs offer dynamic features, such as updating the vessel’s position and route in real-time. They can also overlay additional data such as weather information.
For example, a captain planning a transatlantic voyage would use a general chart to determine the route, while a harbor pilot would use a harbor chart to maneuver a ship into a specific dock.
Q 25. Explain the concept of tidal currents and their impact on navigation.
Tidal currents are the horizontal movement of water caused by the rise and fall of tides. These currents can be strong and unpredictable, significantly impacting navigation.
The strength and direction of tidal currents vary depending on location, time, and the phase of the moon. They are often depicted on nautical charts using arrows and numbers that indicate the speed and direction of the current. They can vary from slow drifts to fast-moving streams depending upon geographical features.
Understanding tidal currents is critical for safe navigation, as they can:
- Increase or decrease the speed of a vessel, impacting arrival times.
- Cause vessels to deviate from their intended course, requiring constant course correction.
- Create hazardous conditions, especially in narrow channels or around obstructions.
For instance, a captain navigating a narrow channel during peak tidal current might experience significant difficulty maintaining course, even with the help of engine power. Accurate tidal current prediction is essential to ensure successful navigation.
Q 26. How do you handle unexpected weather events during a flight or voyage?
Handling unexpected weather events demands quick thinking and decisive action. The priority is always safety. Our response is guided by established protocols and a risk-assessment framework.
The steps generally involve:
- Immediate Assessment: Evaluate the severity and nature of the event. Is it a sudden squall, a developing thunderstorm, or a rapidly shifting weather front?
- Consult Weather Updates: Obtain the most recent weather information from available sources (e.g., aviation or maritime weather services, radar, satellite imagery).
- Risk Mitigation: Determine the best course of action based on the risk assessment. This could range from minor course adjustments to seeking immediate shelter or initiating emergency procedures.
- Communication: Keep communication lines open with air traffic control (aviation) or other vessels (maritime) and inform them of your situation and intended actions.
- Documentation: Thoroughly document the event, including the circumstances, actions taken, and outcomes. This aids future decision-making and analysis.
For example, if a sudden squall hits during a voyage, the immediate priority would be to reduce speed and adjust the course to avoid the strongest winds. Once the immediate danger has passed, a complete assessment and potentially a change in route would be undertaken based on updated weather forecasts.
Q 27. How would you determine the best course of action in the event of an equipment malfunction impacting navigation?
Equipment malfunction impacting navigation is a serious situation requiring a methodical approach. Our response depends on the specific equipment affected and the available backup systems.
Steps usually follow this sequence:
- Identify the Malfunction: Pinpoint the failed system (e.g., GPS, radar, autopilot) and understand its impact on navigation.
- Activate Backup Systems: Immediately switch to backup navigational instruments and systems (e.g., paper charts, compass, manual steering).
- Assess Risks: Analyze the implications of the malfunction on safety and operational efficiency. How much precision has been lost? What are the potential hazards?
- Develop Contingency Plan: Formulate a safe plan based on the available resources. This may include slowing speed, altering course, requesting assistance, or finding shelter.
- Implement and Monitor: Execute the contingency plan and constantly monitor the situation, making adjustments as needed. Prioritize safe arrival.
For instance, if the GPS fails during a flight, we would immediately transition to using VOR (VHF Omnidirectional Range) and other radio navigation aids along with paper charts for navigation. A carefully planned route based on these instruments would be followed, taking into account potential errors and uncertainties.
Q 28. What are your strategies for staying up-to-date with the latest advancements in weather forecasting and navigation technology?
Staying current in weather forecasting and navigation technology is vital. My strategies include:
- Professional Development: I actively participate in industry conferences, workshops, and training courses to stay abreast of the latest advancements and best practices. This often involves attending seminars presented by leading meteorological and navigational experts.
- Continuous Learning: I regularly read scientific journals, industry publications, and online resources related to meteorology, navigation, and related technologies. This keeps me updated on new research and technological innovations.
- Membership in Professional Organizations: Participating in relevant professional organizations (e.g., American Meteorological Society, Institute of Navigation) provides access to valuable resources, networking opportunities, and the latest research in the field.
- Software and Technology Updates: I am continuously learning to use and optimize new weather and navigation software and applications. This often includes familiarizing myself with various models and data sets.
For example, I actively track the development and implementation of new satellite technology, improved weather models, and advancements in autonomous navigation systems to ensure I am effectively using the best available tools and strategies.
Key Topics to Learn for Weather Forecasting and Navigation Interview
- Atmospheric Dynamics: Understanding pressure systems, wind patterns, and their impact on weather formation and flight paths. Practical application: Analyzing weather charts to predict potential turbulence or headwinds.
- Meteorological Instruments and Data Analysis: Familiarity with weather satellites, radar systems, and surface observations. Practical application: Interpreting weather data to make informed decisions about flight planning and route optimization.
- Weather Forecasting Models and Techniques: Knowledge of numerical weather prediction (NWP) models and their limitations. Practical application: Evaluating forecast accuracy and incorporating uncertainties into flight planning.
- Aviation Meteorology: Specific knowledge of weather phenomena relevant to aviation, such as thunderstorms, icing, and low visibility conditions. Practical application: Identifying potential hazards and implementing mitigation strategies.
- Navigation Systems and Techniques: Understanding various navigation systems (e.g., GPS, VOR, ILS) and their limitations. Practical application: Calculating flight paths, considering wind effects and potential navigational challenges.
- Flight Planning and Route Optimization: The ability to plan efficient and safe flight routes considering weather conditions and navigational constraints. Practical application: Creating flight plans that minimize fuel consumption and flight time while maintaining safety.
- Emergency Procedures and Contingency Planning: Knowledge of procedures for handling unexpected weather events and navigational issues. Practical application: Developing backup plans and making quick decisions in challenging situations.
- Data Interpretation and Problem-Solving: Ability to critically analyze complex datasets and apply meteorological and navigational principles to solve practical problems. Practical application: Diagnosing unexpected weather patterns and making adjustments to the flight plan accordingly.
Next Steps
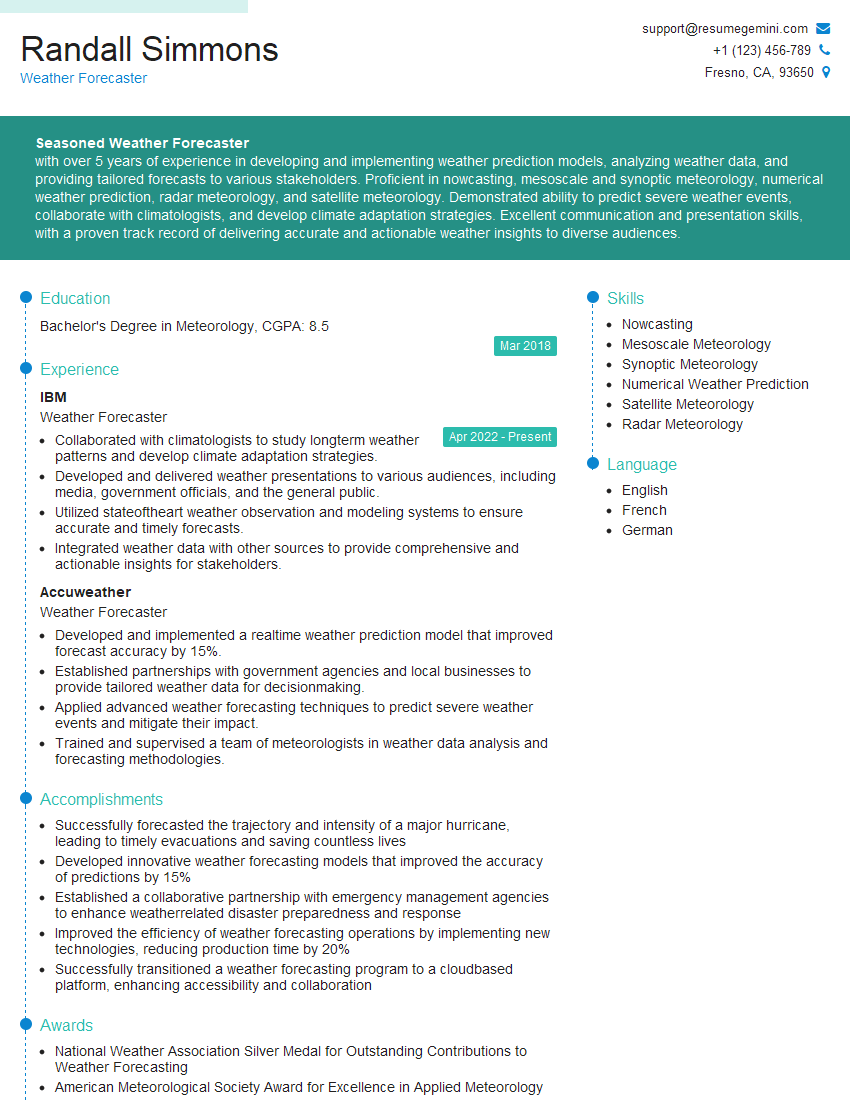
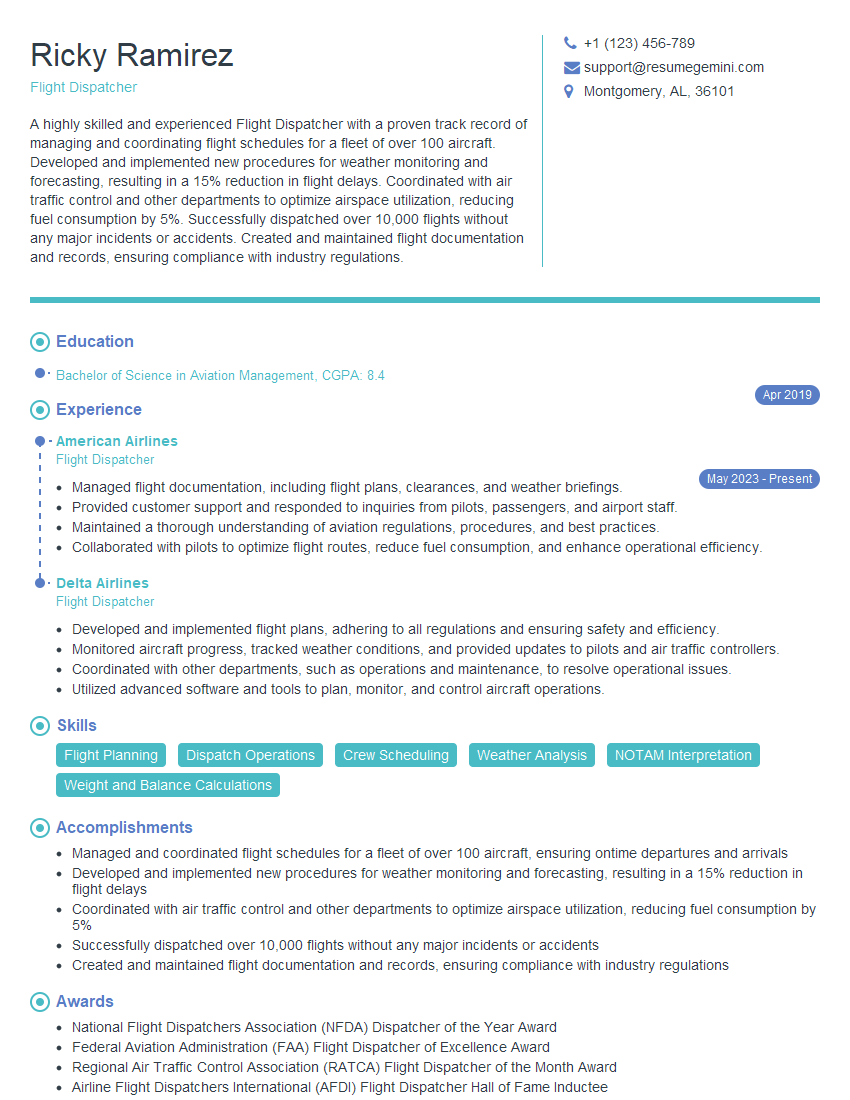
Mastering Weather Forecasting and Navigation is crucial for a successful and rewarding career in aviation, meteorology, or related fields. These skills are highly sought after, opening doors to diverse and challenging roles. To maximize your job prospects, creating an ATS-friendly resume is essential. This ensures your qualifications are effectively communicated to hiring managers and Applicant Tracking Systems. We strongly recommend using ResumeGemini, a trusted resource for building professional and impactful resumes. ResumeGemini provides examples of resumes tailored to Weather Forecasting and Navigation, offering invaluable guidance in showcasing your skills and experience.
Explore more articles
Users Rating of Our Blogs
Share Your Experience
We value your feedback! Please rate our content and share your thoughts (optional).
What Readers Say About Our Blog
Hello,
We found issues with your domain’s email setup that may be sending your messages to spam or blocking them completely. InboxShield Mini shows you how to fix it in minutes — no tech skills required.
Scan your domain now for details: https://inboxshield-mini.com/
— Adam @ InboxShield Mini
Reply STOP to unsubscribe
Hi, are you owner of interviewgemini.com? What if I told you I could help you find extra time in your schedule, reconnect with leads you didn’t even realize you missed, and bring in more “I want to work with you” conversations, without increasing your ad spend or hiring a full-time employee?
All with a flexible, budget-friendly service that could easily pay for itself. Sounds good?
Would it be nice to jump on a quick 10-minute call so I can show you exactly how we make this work?
Best,
Hapei
Marketing Director
Hey, I know you’re the owner of interviewgemini.com. I’ll be quick.
Fundraising for your business is tough and time-consuming. We make it easier by guaranteeing two private investor meetings each month, for six months. No demos, no pitch events – just direct introductions to active investors matched to your startup.
If youR17;re raising, this could help you build real momentum. Want me to send more info?
Hi, I represent an SEO company that specialises in getting you AI citations and higher rankings on Google. I’d like to offer you a 100% free SEO audit for your website. Would you be interested?
Hi, I represent an SEO company that specialises in getting you AI citations and higher rankings on Google. I’d like to offer you a 100% free SEO audit for your website. Would you be interested?
good
