Feeling uncertain about what to expect in your upcoming interview? We’ve got you covered! This blog highlights the most important Weather Forecasting Monitoring interview questions and provides actionable advice to help you stand out as the ideal candidate. Let’s pave the way for your success.
Questions Asked in Weather Forecasting Monitoring Interview
Q 1. Explain the difference between numerical weather prediction (NWP) and statistical forecasting.
Numerical Weather Prediction (NWP) and statistical forecasting are two distinct approaches to predicting weather. NWP uses complex mathematical equations based on the fundamental laws of physics to model the atmosphere’s behavior. It takes initial conditions (temperature, pressure, humidity, wind speed etc. at various points) and uses these to project the future state of the atmosphere. Think of it like solving a giant, incredibly complex puzzle where each piece represents atmospheric data.
Statistical forecasting, on the other hand, relies on historical weather data and statistical relationships to predict future weather. It identifies patterns and correlations between past weather events and uses statistical methods like regression to estimate future conditions. It’s like predicting the likelihood of rain based on how often it rained in the past under similar conditions.
The key difference lies in their methodology: NWP is physics-based, simulating atmospheric processes; statistical forecasting is data-driven, relying on correlations from past observations. In practice, many forecasting systems blend both approaches for improved accuracy.
Q 2. Describe the limitations of weather forecasting models.
Weather forecasting models, despite their sophistication, have inherent limitations. One major limitation is the imperfect knowledge of initial conditions. We can’t measure every single aspect of the atmosphere with perfect precision, and small errors in initial data can amplify over time, leading to significant forecast errors, particularly for longer-range predictions – this is known as the ‘butterfly effect’.
Another limitation is the complexity of atmospheric processes. Atmospheric dynamics are incredibly intricate, involving interactions between various scales, from microscopic to global. Models simplify these processes, inevitably introducing approximations and uncertainties. For example, cloud formation and precipitation are notoriously difficult to model accurately.
Furthermore, computing power and resolution are constraints. Even the most advanced models can’t resolve every tiny eddy or fluctuation in the atmosphere. Higher resolution models require significantly more computational resources, making very high-resolution global forecasts still challenging.
Finally, unpredictable events like volcanic eruptions or sudden shifts in ocean currents can drastically impact weather patterns, which are often difficult to incorporate into model predictions. So forecasting is always an exercise in uncertainty, and acknowledging that uncertainty is crucial for responsible forecasting.
Q 3. What are the key atmospheric variables used in weather forecasting?
Several key atmospheric variables are crucial for weather forecasting. These include:
- Temperature: Measured at various heights in the atmosphere, it determines atmospheric stability and drives air movement.
- Pressure: Atmospheric pressure gradients create wind, influencing the movement of weather systems. Changes in pressure often indicate approaching storms.
- Humidity: The amount of water vapor in the air affects cloud formation, precipitation, and temperature. High humidity can lead to oppressive heat and heavy rainfall.
- Wind speed and direction: Wind transports heat, moisture, and pollutants, significantly influencing weather patterns. Wind shear (changes in wind speed or direction with height) is crucial for understanding severe weather.
- Precipitation: Rainfall, snowfall, sleet, and hail are all important indicators of weather systems and their intensity.
- Cloud cover: Cloud type and extent influence temperature, precipitation, and solar radiation. Different cloud types have different impacts on the weather.
These variables, measured at different altitudes and locations, provide a comprehensive picture of the atmospheric state, enabling more accurate predictions.
Q 4. How do you interpret weather charts and maps (e.g., surface analysis, upper-air charts)?
Interpreting weather charts and maps is a fundamental skill for meteorologists. Surface analysis charts show current weather conditions at the Earth’s surface, including pressure systems (highs and lows), fronts, temperature, wind, precipitation, and cloud cover. The isobars (lines of equal pressure) help identify areas of high and low pressure and their associated weather patterns. Fronts, boundaries separating air masses with different temperatures and humidity, are crucial for understanding precipitation and temperature changes.
Upper-air charts show atmospheric conditions at various altitudes, usually using information from weather balloons (radiosondes). They display temperature, pressure, wind, and humidity at different levels, providing a three-dimensional view of the atmosphere. These charts reveal the structure of weather systems, showing things like jet streams (high-speed winds aloft) and the stability of the atmosphere. For example, a strong temperature gradient aloft might suggest the potential for severe thunderstorms.
By analyzing these charts in conjunction with other data (e.g., radar, satellite imagery), meteorologists can develop a comprehensive understanding of the current weather and anticipate how it will evolve.
Q 5. Explain the concept of atmospheric pressure and its role in weather systems.
Atmospheric pressure is the force exerted by the weight of the air above a given point. It’s typically measured in millibars (mb) or hectopascals (hPa). Air pressure decreases with altitude because there’s less air above you at higher elevations. Differences in atmospheric pressure drive the wind. Air moves from areas of high pressure to areas of low pressure, creating wind.
Pressure systems play a crucial role in weather systems. High-pressure systems (anticyclones) are typically associated with fair weather, clear skies, and light winds. The air in a high-pressure system sinks, suppressing cloud formation. In contrast, low-pressure systems (cyclones) are often associated with stormy weather, clouds, precipitation, and stronger winds. Air rises in a low-pressure system, leading to condensation and cloud development.
The interaction between high and low-pressure systems, along with fronts, governs the movement and evolution of weather systems.
Q 6. Describe the various types of precipitation and their formation processes.
Several types of precipitation exist, each with a distinct formation process:
- Rain: Forms when water vapor in the atmosphere condenses into liquid water droplets around cloud condensation nuclei (tiny particles in the air). When these droplets become large enough, they fall as rain.
- Snow: Forms when water vapor directly changes into ice crystals (deposition) within clouds at temperatures well below freezing. These ice crystals aggregate to form snowflakes.
- Sleet: Begins as snow but melts partially as it falls through a warmer layer of air and then refreezes into ice pellets before hitting the ground.
- Freezing rain: Similar to sleet, but the snowflakes melt completely before refreezing on contact with surfaces that are below freezing. This often produces a hazardous coating of ice.
- Hail: Forms in strong thunderstorms with intense updrafts. Ice pellets grow by colliding with supercooled water droplets (water that is below freezing but remains liquid) and layering ice repeatedly as they are carried up and down within the thunderstorm.
The type of precipitation that falls depends on atmospheric temperature profiles (temperature variations with height), humidity, and the intensity of the atmospheric uplift.
Q 7. How do you analyze weather radar data to predict severe weather events?
Weather radar provides crucial data for predicting severe weather events. It works by emitting pulses of radio waves and detecting the signals reflected back from precipitation and other atmospheric particles. The strength of the reflected signal (reflectivity) indicates the intensity of precipitation, while the Doppler effect (changes in frequency due to the movement of the reflecting particles) provides information about the wind speed within the storm.
To analyze radar data, meteorologists look for several key features indicative of severe weather:
- High reflectivity: Indicates heavy precipitation, possibly hail or intense rainfall.
- Hook echo: A hook-shaped radar signature often associated with tornadoes. It indicates a rotating updraft within a thunderstorm.
- Mesocyclone: A rotating column of air detected by Doppler radar, a precursor to tornadoes and severe thunderstorms.
- TVS (tornado vortex signature): A very small area of extremely high rotation detected by Doppler radar, a strong indicator of a tornado.
- Hail signatures: Areas of high reflectivity with strong vertical motion can indicate hail production.
By integrating radar data with other information (surface observations, satellite imagery, atmospheric models), meteorologists can issue timely warnings and alerts to protect life and property.
Q 8. Explain the concept of atmospheric stability and its impact on weather patterns.
Atmospheric stability refers to the atmosphere’s tendency to resist or enhance vertical motion. Imagine a stack of pancakes: if they’re neatly stacked, that’s stable; if they’re toppling over, that’s unstable. Similarly, a stable atmosphere resists upward movement of air parcels, leading to calm conditions or layered clouds. An unstable atmosphere, however, readily allows rising air, resulting in thunderstorms, cumulus clouds, and potentially severe weather.
Stability is determined by the temperature difference between rising air and its surroundings. If the rising air is cooler than its environment, it will sink back down (stable). If the rising air is warmer, it will continue rising (unstable). This temperature difference is often measured by calculating the environmental lapse rate (how temperature changes with altitude) and comparing it to the adiabatic lapse rate (the rate at which a rising air parcel cools).
Impact on Weather Patterns:
- Stable Atmosphere: Stratiform clouds (layered clouds), fog, drizzle, and calm conditions are typical.
- Unstable Atmosphere: Cumuliform clouds (puffy clouds), thunderstorms, showers, and potentially strong winds are likely. The greater the instability, the more intense the weather events can be.
For example, a stable air mass over a large body of water might produce fog in the morning, while an unstable air mass over a heated land surface might lead to afternoon thunderstorms.
Q 9. What are the different types of weather satellites and their applications in forecasting?
Weather satellites are crucial for global weather monitoring, providing a bird’s-eye view of atmospheric conditions. There are two main types:
- Geostationary Satellites (GEO): These orbit the Earth at the same rate as the Earth’s rotation, remaining stationary above a specific point on the equator. They provide continuous observation of a large area, ideal for tracking storm development and movement. Examples include GOES (US) and Meteosat (Europe). Their applications include monitoring cloud cover, temperature profiles, water vapor, and tracking severe weather like hurricanes.
- Polar-orbiting Satellites (PO): These satellites orbit the Earth in a north-south direction, passing over the poles. They cover the entire globe several times a day, offering high-resolution images and data. Examples include NOAA and Suomi NPP satellites. Their applications include gathering detailed atmospheric profiles, sea surface temperatures, and land surface data, which are particularly useful for generating high-resolution weather forecasts.
Both types complement each other; GEO satellites provide continuous monitoring of a region, while PO satellites offer comprehensive global coverage with finer details.
Q 10. How do you use weather models to forecast temperature, precipitation, and wind speed?
Weather models are complex computer programs that solve mathematical equations describing atmospheric physics. They use vast amounts of observational data (from satellites, surface stations, radar, etc.) as input to predict future weather conditions.
The process generally involves these steps:
- Data Assimilation: Observational data is combined with the model’s previous forecast to create the best possible initial state of the atmosphere.
- Model Integration: The model uses numerical techniques to solve the equations of atmospheric motion, predicting future changes in temperature, pressure, wind, and moisture.
- Post-processing: The model’s raw output (often in gridded form) is converted into user-friendly products like maps, charts, and textual forecasts.
For example, to forecast temperature, the model simulates the heating and cooling processes in the atmosphere, considering factors like solar radiation, cloud cover, and surface interactions. Similarly, for precipitation, it calculates the processes of condensation and rainfall. Wind speed is predicted by solving equations that govern atmospheric pressure gradients and the Coriolis effect.
Different models use varying levels of complexity and resolution, leading to differences in forecast accuracy. Meteorologists often use several models, comparing their outputs to arrive at the most probable forecast.
Q 11. Describe the process of verifying a weather forecast.
Verifying a weather forecast involves comparing the predicted weather elements (temperature, precipitation, wind, etc.) with observations made after the forecast period. This process is essential for evaluating forecast accuracy and identifying areas for improvement.
Several methods are used:
- Quantitative Verification: Uses statistical measures like root mean square error (RMSE) or bias to compare predicted values with observed values. For example, comparing the predicted rainfall amount to the actual amount recorded by rain gauges.
- Qualitative Verification: Assesses the forecast’s skill in capturing major weather events or patterns. For instance, did the forecast correctly predict the location and intensity of a hurricane? This often involves subjective evaluation.
- User Feedback: Feedback from users (the public, aviation, agriculture, etc.) about how useful the forecast was in their decision-making process can provide valuable insight into forecast performance.
Verification is not just about numerical scores; it’s also about understanding the reasons for any forecast errors. Was it due to limitations in the models, insufficient data, or unforeseen atmospheric events? This helps improve future forecasts.
Q 12. How do you communicate weather information effectively to different audiences?
Effective communication of weather information is crucial for public safety and informed decision-making. The approach depends on the target audience.
Strategies for Different Audiences:
- General Public: Simple language, clear visuals (maps, charts), and avoidance of technical jargon are essential. Focus on the impact of the weather on daily life (e.g., travel conditions, outdoor activities).
- Aviation: Precise and detailed information on wind, visibility, cloud cover, and icing conditions is paramount. Specialized terminology and formats are used.
- Agriculture: Forecasts focusing on temperature, rainfall, and potential impact on crops are critical. Information about frost, drought, or excessive rainfall is particularly important.
- Emergency Management: Timely and accurate alerts and warnings about severe weather events (hurricanes, floods, tornadoes) are life-saving. Clear communication channels and coordinated efforts are crucial.
Effective communication often involves multiple platforms: television, radio, internet, social media, and mobile apps. Choosing the most appropriate channels for each audience is crucial.
Q 13. Explain the role of ensemble forecasting in improving forecast accuracy.
Ensemble forecasting involves running a weather model multiple times with slightly different initial conditions and/or model parameters. This generates a range of possible future weather scenarios, rather than a single deterministic forecast. Think of it like asking several experts their opinion – the consensus provides a more robust and reliable forecast.
Improving Accuracy:
- Uncertainty Quantification: Ensemble forecasts provide a measure of the uncertainty associated with the forecast. A wider spread of predictions indicates higher uncertainty, warning users that the forecast may be less reliable.
- Improved Probability Forecasts: The frequency of different outcomes within the ensemble can be used to estimate probabilities of various weather events (e.g., the probability of exceeding a certain rainfall threshold).
- Better Handling of Chaos: Atmospheric systems are inherently chaotic; small initial differences can lead to large differences in the forecast. Ensembles help account for this chaos and improve long-range predictability.
For example, an ensemble might produce several forecasts for a potential hurricane’s track, showing a range of possible landfall locations. This allows better planning and mitigation efforts.
Q 14. What are some common sources of error in weather forecasting?
Weather forecasting is a complex task; several factors can introduce errors:
- Initial Condition Errors: Imperfect observations and incomplete data coverage lead to errors in the initial state of the atmosphere used by weather models.
- Model Errors: Weather models are simplifications of complex atmospheric processes; errors in model equations or parameterizations can lead to forecast errors.
- Data Assimilation Errors: The process of combining observations with model data can introduce errors if not done correctly.
- Subgrid-scale Processes: Weather models often cannot resolve small-scale processes (e.g., individual clouds or turbulent eddies), leading to errors in the representation of these effects.
- Computational Errors: Errors can arise from numerical approximations used in solving the model equations.
- Unforeseen Events: Sudden and unpredictable events, such as volcanic eruptions or significant changes in ocean currents, can disrupt forecasts.
Minimizing these errors involves improving data collection networks, refining model physics, developing advanced data assimilation techniques, and continuously evaluating and improving forecast verification procedures.
Q 15. How do you handle uncertainty in weather forecasts?
Uncertainty is inherent in weather forecasting because the atmosphere is a chaotic system. Small changes in initial conditions can lead to drastically different outcomes. We handle this through ensemble forecasting, probability forecasts, and communicating uncertainty effectively.
- Ensemble Forecasting: We run multiple weather models with slightly different starting conditions. The spread of the resulting forecasts shows the uncertainty range. For instance, if five ensemble members predict rain, but one predicts sunshine, we know there’s a higher probability of rain but acknowledge the possibility of sunshine.
- Probability Forecasts: Instead of stating a definite outcome (e.g., ‘It will rain tomorrow’), we use probabilities (e.g., ‘There is a 70% chance of rain tomorrow’). This directly quantifies the uncertainty.
- Effective Communication: Communicating uncertainty clearly to the public and stakeholders is crucial. We use plain language, visuals like probability maps, and avoid overly confident statements. We emphasize the range of possibilities and their associated likelihoods.
Career Expert Tips:
- Ace those interviews! Prepare effectively by reviewing the Top 50 Most Common Interview Questions on ResumeGemini.
- Navigate your job search with confidence! Explore a wide range of Career Tips on ResumeGemini. Learn about common challenges and recommendations to overcome them.
- Craft the perfect resume! Master the Art of Resume Writing with ResumeGemini’s guide. Showcase your unique qualifications and achievements effectively.
- Don’t miss out on holiday savings! Build your dream resume with ResumeGemini’s ATS optimized templates.
Q 16. Describe your experience with different weather forecasting software and tools.
Throughout my career, I’ve extensively used various weather forecasting software and tools. My experience encompasses both commercial and research-grade systems. I’m proficient in using numerical weather prediction (NWP) models like the Global Forecast System (GFS), the European Centre for Medium-Range Weather Forecasts (ECMWF) model, and the Canadian Meteorological Centre (CMC) model. I also have experience with data visualization tools such as GrADS, Panoply, and specialized Geographic Information Systems (GIS) software for mapping weather data. Additionally, I’m familiar with various data assimilation techniques used to integrate observational data into these models, ensuring the forecasts are as accurate as possible.
For example, in my previous role, we used the GFS model for large-scale forecasting and combined it with a higher-resolution regional model for more localized predictions. We then utilized GrADS to visualize the output, creating maps and graphs for our reports and presentations.
Q 17. Explain the impact of climate change on weather patterns.
Climate change significantly impacts weather patterns. The increased concentration of greenhouse gases in the atmosphere leads to a warming planet, altering several key weather elements.
- Increased Temperatures: More frequent and intense heatwaves are expected. This impacts human health, agriculture, and water resources.
- Changes in Precipitation Patterns: Some regions experience more intense rainfall and flooding, while others face prolonged droughts. This alters agricultural yields and water availability.
- More Extreme Weather Events: The frequency and intensity of hurricanes, typhoons, and other severe weather phenomena are projected to increase.
- Sea Level Rise: The melting of glaciers and ice sheets contributes to rising sea levels, increasing the risk of coastal flooding and erosion.
These changes are not uniform globally; some regions are experiencing more dramatic shifts than others. Understanding these impacts is crucial for adapting to the changing climate and mitigating its effects.
Q 18. How do you stay updated on the latest advancements in weather forecasting technology?
Staying current with advancements in weather forecasting is paramount. I achieve this through several methods:
- Peer-Reviewed Journals: I regularly read publications like the Monthly Weather Review and the Journal of the Atmospheric Sciences to stay abreast of research findings.
- Conferences and Workshops: Attending meteorological conferences allows me to network with other professionals and learn about the latest breakthroughs. For example, the American Meteorological Society annual meeting is an invaluable resource.
- Online Resources and Webinars: Numerous online resources, including those offered by national meteorological agencies and universities, provide access to cutting-edge information and training materials.
- Collaboration with Researchers: I actively collaborate with researchers in academia and government agencies, engaging in discussions and exchanging knowledge.
Q 19. Describe your experience working with different weather datasets.
My experience encompasses a wide range of weather datasets, from surface observations to satellite imagery and radar data. I’m proficient in working with data in various formats, including NetCDF, GRIB, and text files. I understand the intricacies of data quality control and the importance of proper data preprocessing before analysis. This involves handling missing data, identifying outliers, and applying appropriate quality control checks.
For instance, in one project, we integrated data from multiple sources – surface weather stations, radiosondes (weather balloons), and geostationary satellites – to analyze the formation and evolution of a severe thunderstorm. This involved careful calibration and interpolation of data to ensure accuracy and consistency across different sources.
Q 20. What are some challenges in forecasting specific weather phenomena (e.g., tornadoes, hurricanes)?
Forecasting specific weather phenomena like tornadoes and hurricanes presents unique challenges due to their small spatial scales and rapid evolution. Tornadoes, in particular, are notoriously difficult to predict due to their short lifespan and highly localized nature. The lack of sufficient data resolution in some areas poses another major challenge.
- Limited Observational Data: The smaller size of these phenomena requires high-resolution data, which is not always available. For example, radar data might not capture the fine details of a tornado’s formation.
- Complex Physical Processes: The processes that govern the formation and intensification of these events are highly complex and involve intricate interactions within the atmosphere. Numerical weather models struggle to accurately simulate these processes.
- Data Assimilation Challenges: Integrating various data sources (satellite, radar, surface observations) effectively into forecast models is challenging, particularly for smaller-scale events.
Despite these challenges, advances in radar technology, higher-resolution models, and data assimilation techniques continue to improve forecasting capabilities for these phenomena.
Q 21. Explain the concept of synoptic meteorology.
Synoptic meteorology is the study of weather patterns on a large scale, typically covering areas of hundreds or thousands of kilometers. It focuses on analyzing the spatial distribution of atmospheric variables like pressure, temperature, wind, and moisture to understand the evolution of weather systems. Think of it as looking at the ‘big picture’ of the atmosphere.
Synoptic meteorologists use weather maps, satellite imagery, and other data to identify and track weather systems like fronts, cyclones, and anticyclones. They analyze the interplay between these systems to forecast weather conditions over a region. The information obtained is then used to generate forecasts that help in various applications, from aviation safety to public weather warnings. For instance, by analyzing a surface weather map showing a cold front approaching, a synoptic meteorologist can anticipate changes in temperature, wind, and precipitation.
Q 22. How do you use meteorological data to assess the risk of severe weather events?
Assessing the risk of severe weather events involves analyzing various meteorological data points to identify patterns and thresholds indicative of hazardous conditions. Think of it like assembling a puzzle – each piece of data contributes to the overall picture. For example, we look at atmospheric pressure changes (falling pressure often precedes storms), wind shear (a change in wind speed or direction with altitude, crucial for tornado formation), temperature and humidity profiles (to understand atmospheric instability), and satellite imagery (revealing cloud formations, precipitation intensity, and storm structure).
Specifically, we use tools and models that integrate this data. For example, if we see a strong upper-level jet stream interacting with surface moisture and instability, as indicated by high CAPE (Convective Available Potential Energy) values, we would flag a high risk of severe thunderstorms, possibly with hail and tornadoes. Likewise, if we observe a rapid deepening of a low-pressure system and very high sustained winds, a hurricane or major storm surge becomes a significant concern. We use probabilistic forecasting techniques to quantify these risks, providing estimates of the likelihood and intensity of the event.
Q 23. Describe your experience with data analysis techniques used in meteorology.
My experience encompasses a wide range of data analysis techniques. I’m proficient in using statistical methods like regression analysis to model relationships between different meteorological variables, enabling improved forecast accuracy. For example, I’ve used multiple linear regression to predict rainfall amount based on factors such as humidity, temperature, and atmospheric pressure. I also utilize spatial statistical methods such as kriging to interpolate sparse weather data points, generating complete grids representing variables across a geographical region.
Furthermore, I am adept at using time series analysis techniques to identify trends, seasonality, and cyclical patterns in meteorological data. For instance, analyzing historical temperature data helps predict long-term trends and potential impacts of climate change. Machine learning techniques such as neural networks and support vector machines are crucial tools for pattern recognition and improved prediction accuracy, particularly when dealing with complex systems like weather forecasting. I have significant experience with Python libraries such as NumPy, Pandas, and Scikit-learn for processing, cleaning, and analyzing meteorological data. I also frequently visualize data using plotting libraries like Matplotlib and Seaborn to facilitate pattern recognition and informed decision-making.
Q 24. What is your approach to solving complex forecasting problems?
My approach to complex forecasting problems involves a systematic, multi-faceted strategy. First, I thoroughly analyze the available data, identifying potential sources of uncertainty and bias. Then, I develop and evaluate multiple forecast models, incorporating diverse perspectives and data sources. It’s crucial to consider ensemble forecasting – running multiple models with slightly different initial conditions and parameters. This allows us to obtain a range of potential outcomes and estimate their likelihood. This helps us to understand uncertainties inherent in complex forecasting tasks.
After running various models, I use model output statistics (MOS) and other post-processing techniques to refine the forecasts and calibrate them against historical observations. This iterative process of model refinement ensures that our forecasts are not only accurate but also well-calibrated, meaning the forecast probabilities accurately reflect the likelihood of the predicted event.
Communication is key. After arriving at a forecast, I thoroughly document my methods and communicate the findings clearly and effectively to stakeholders, acknowledging any uncertainties involved. This is particularly critical for potentially damaging weather events, where effective communication can save lives and minimize property damage.
Q 25. How do you integrate different data sources to improve forecast accuracy?
Improving forecast accuracy necessitates integrating diverse data sources. We leverage data from various sources, including surface weather stations, radar, satellites, weather balloons (radiosondes), and even aircraft observations. Each source provides a unique perspective on the atmospheric state. For instance, surface stations offer point measurements of temperature, humidity, and pressure, while radar provides information about precipitation type, intensity, and location. Satellites provide a broad view of cloud cover, atmospheric temperature and moisture profiles, and even lightning activity. We use data assimilation techniques, such as variational or Kalman filter methods, to combine these observations into a comprehensive picture of the atmosphere. These methods account for differences in observation accuracy, location and timing, and provide a more accurate and complete representation of the atmosphere. This approach is particularly useful for tracking storms and predicting their intensity and track.
Q 26. Explain the concept of lead time in forecasting.
Lead time refers to the period between the issuance of a forecast and the time the predicted event is expected to occur. For example, a 24-hour lead time forecast means the prediction is made 24 hours in advance of the event. Lead time is crucial because accuracy generally decreases as lead time increases. Short-range forecasts (a few hours to a couple of days) are generally more accurate than long-range forecasts (weeks or months). However, long-range forecasts are increasingly important for seasonal planning, especially in agriculture and disaster preparedness. Understanding the limitations of lead time guides the appropriate use of forecasts – a 7-day hurricane forecast will be less precise in specifying landfall location than a 24-hour forecast. The appropriate level of detail varies greatly depending on the lead time, the forecast horizon and the event.
Q 27. Describe your understanding of weather forecasting ethics and responsibility.
Weather forecasting ethics and responsibility are paramount. Accuracy and honesty are crucial; we must present our forecasts with transparency, acknowledging uncertainties and limitations. We must avoid sensationalism or overstating the certainty of predictions, especially when dealing with potentially hazardous events. Misleading or inaccurate forecasts can have severe consequences. Our responsibility extends to communicating our findings clearly and effectively to a broad audience, tailoring our communications to the needs and understanding of the target audience, and taking into consideration the potential impact of the forecast. Public safety must always be prioritized. I consider it a professional obligation to continuously improve my skills and knowledge, ensuring that our forecasts are based on the best available science and techniques.
Q 28. What are your career goals in the field of weather forecasting?
My career goals involve contributing to advancements in weather forecasting, specifically focusing on improving the accuracy and skill of severe weather prediction. This involves exploring and implementing cutting-edge technologies such as AI and machine learning, improving data assimilation techniques, and further refining our understanding of atmospheric processes. I am also interested in enhancing communication strategies to ensure that forecast information is effectively utilized by the public and emergency management agencies to improve preparedness and reduce the impacts of severe weather. Ultimately, I aim to become a leading expert in my field, contributing to a safer and more informed society through accurate and timely weather forecasting.
Key Topics to Learn for Weather Forecasting Monitoring Interview
- Atmospheric Dynamics: Understanding atmospheric pressure, temperature, humidity, and wind patterns; their interactions and influence on weather systems. Practical application: Interpreting weather maps and charts to predict short-term and long-term weather changes.
- Meteorological Data Analysis: Utilizing various data sources (satellites, radar, surface observations) for accurate weather forecasting. Practical application: Analyzing data to identify developing weather phenomena like thunderstorms or hurricanes.
- Weather Models and Numerical Prediction: Familiarity with different weather models and their strengths and limitations. Practical application: Evaluating model output and understanding the uncertainties associated with forecasts.
- Forecasting Techniques: Understanding various forecasting methods, including statistical methods, analog forecasting, and ensemble forecasting. Practical application: Applying appropriate forecasting techniques based on available data and forecast lead time.
- Weather Phenomena: In-depth knowledge of different weather phenomena, including cloud formation, precipitation processes, severe weather events, and climate patterns. Practical application: Identifying and interpreting the characteristics of different weather events.
- Data Visualization and Interpretation: Effectively communicating weather information through maps, charts, and graphs. Practical application: Presenting forecasts clearly and concisely to diverse audiences.
- Instrumentation and Observing Systems: Understanding the principles and operation of meteorological instruments and observing networks. Practical application: Assessing the quality and reliability of meteorological data.
Next Steps
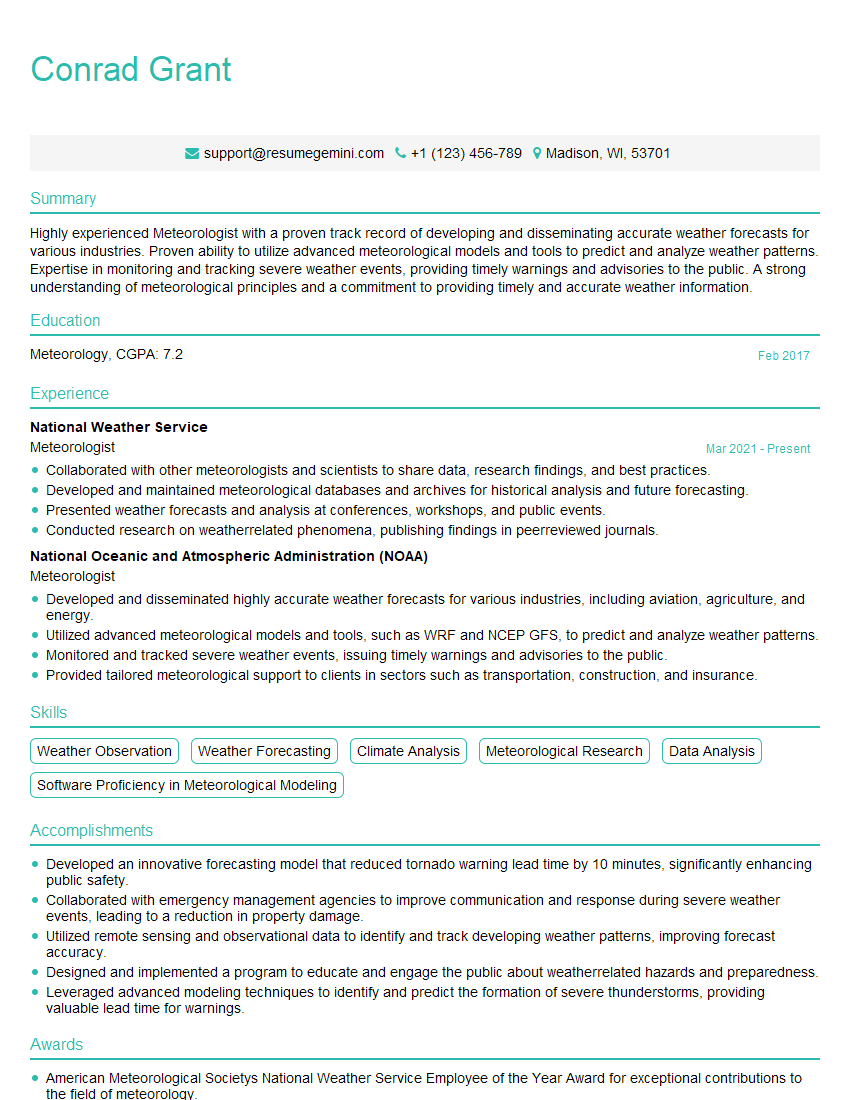
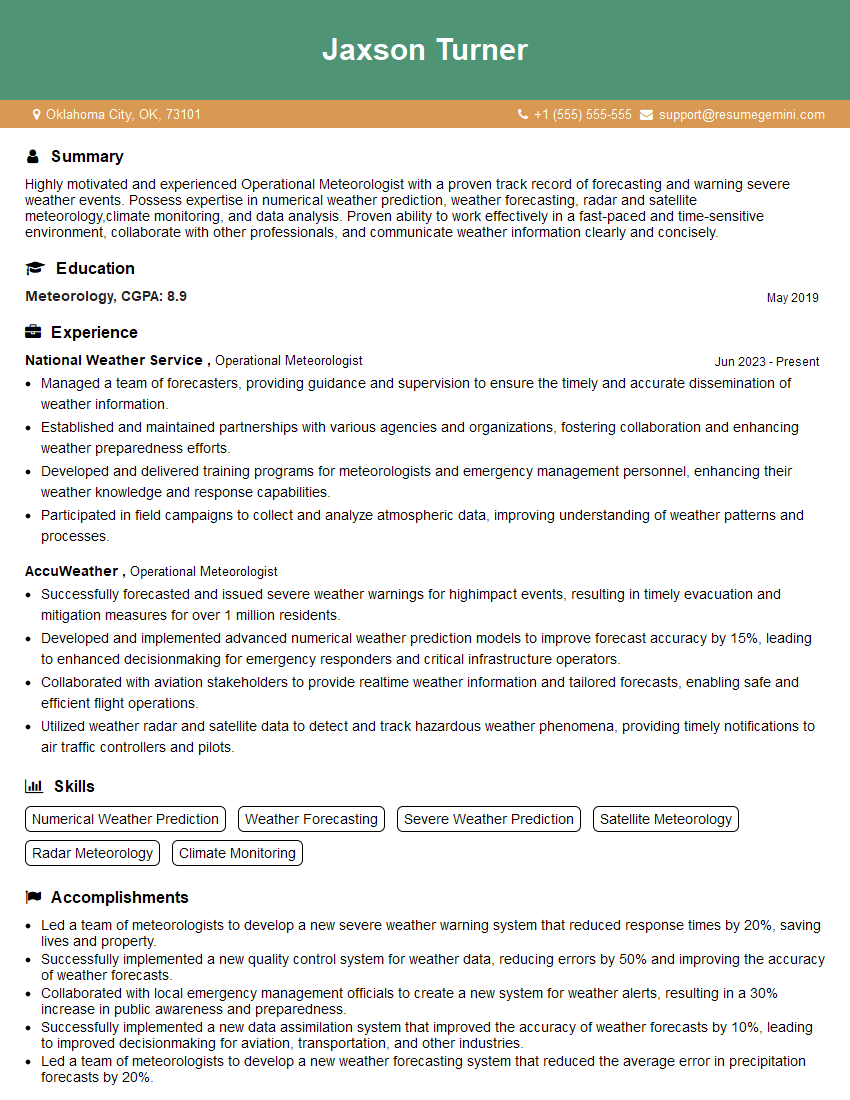
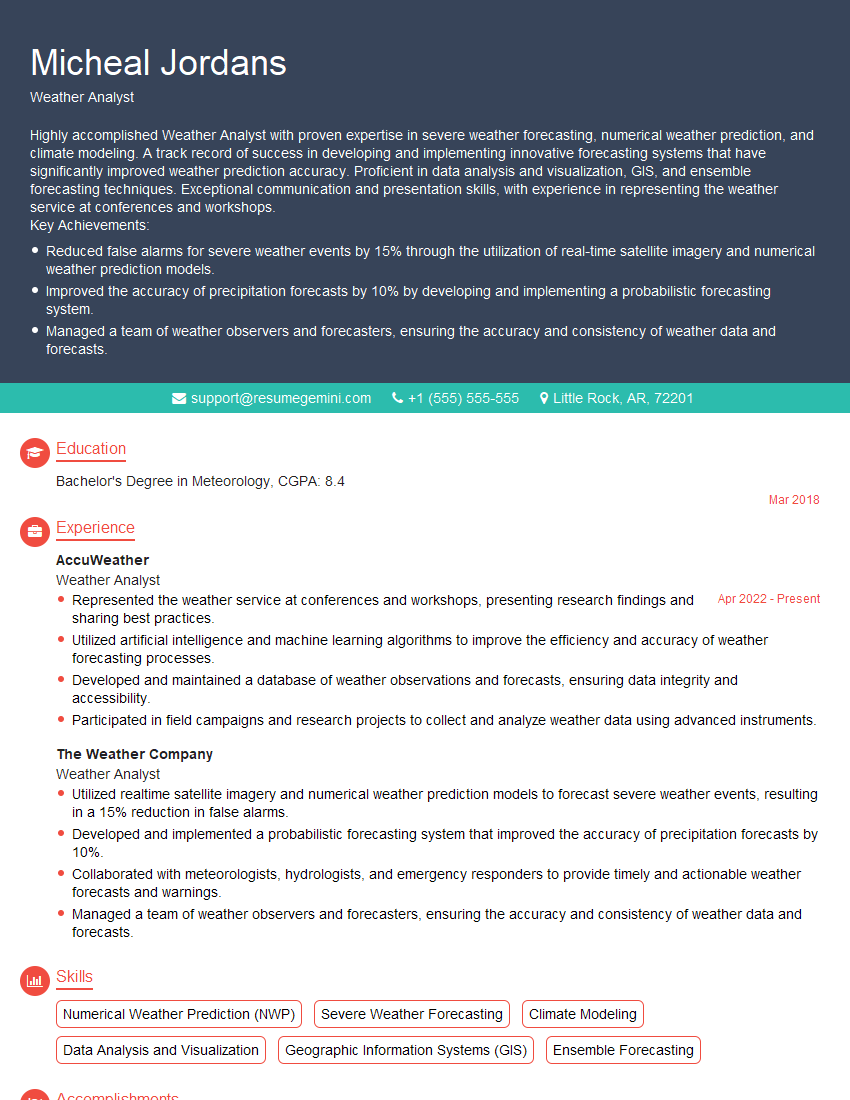
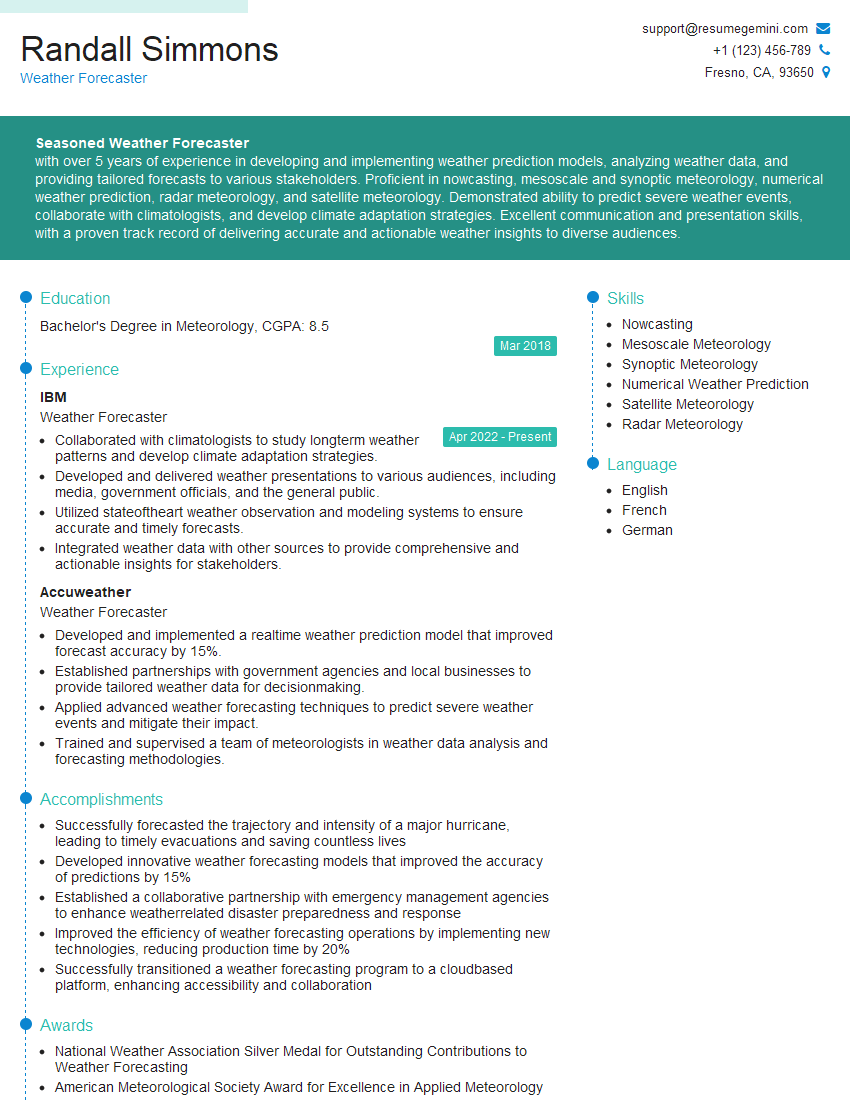
Mastering Weather Forecasting Monitoring opens doors to exciting careers in meteorology, environmental science, and related fields. Advancement opportunities abound, from research to operational forecasting and beyond. To maximize your job prospects, crafting an ATS-friendly resume is crucial. ResumeGemini can significantly help you build a powerful, professional resume that showcases your skills and experience effectively. ResumeGemini offers examples of resumes tailored specifically to Weather Forecasting Monitoring roles, providing you with templates and inspiration to create a winning application.
Explore more articles
Users Rating of Our Blogs
Share Your Experience
We value your feedback! Please rate our content and share your thoughts (optional).
What Readers Say About Our Blog
Hello,
we currently offer a complimentary backlink and URL indexing test for search engine optimization professionals.
You can get complimentary indexing credits to test how link discovery works in practice.
No credit card is required and there is no recurring fee.
You can find details here:
https://wikipedia-backlinks.com/indexing/
Regards
NICE RESPONSE TO Q & A
hi
The aim of this message is regarding an unclaimed deposit of a deceased nationale that bears the same name as you. You are not relate to him as there are millions of people answering the names across around the world. But i will use my position to influence the release of the deposit to you for our mutual benefit.
Respond for full details and how to claim the deposit. This is 100% risk free. Send hello to my email id: [email protected]
Luka Chachibaialuka
Hey interviewgemini.com, just wanted to follow up on my last email.
We just launched Call the Monster, an parenting app that lets you summon friendly ‘monsters’ kids actually listen to.
We’re also running a giveaway for everyone who downloads the app. Since it’s brand new, there aren’t many users yet, which means you’ve got a much better chance of winning some great prizes.
You can check it out here: https://bit.ly/callamonsterapp
Or follow us on Instagram: https://www.instagram.com/callamonsterapp
Thanks,
Ryan
CEO – Call the Monster App
Hey interviewgemini.com, I saw your website and love your approach.
I just want this to look like spam email, but want to share something important to you. We just launched Call the Monster, a parenting app that lets you summon friendly ‘monsters’ kids actually listen to.
Parents are loving it for calming chaos before bedtime. Thought you might want to try it: https://bit.ly/callamonsterapp or just follow our fun monster lore on Instagram: https://www.instagram.com/callamonsterapp
Thanks,
Ryan
CEO – Call A Monster APP
To the interviewgemini.com Owner.
Dear interviewgemini.com Webmaster!
Hi interviewgemini.com Webmaster!
Dear interviewgemini.com Webmaster!
excellent
Hello,
We found issues with your domain’s email setup that may be sending your messages to spam or blocking them completely. InboxShield Mini shows you how to fix it in minutes — no tech skills required.
Scan your domain now for details: https://inboxshield-mini.com/
— Adam @ InboxShield Mini
Reply STOP to unsubscribe
Hi, are you owner of interviewgemini.com? What if I told you I could help you find extra time in your schedule, reconnect with leads you didn’t even realize you missed, and bring in more “I want to work with you” conversations, without increasing your ad spend or hiring a full-time employee?
All with a flexible, budget-friendly service that could easily pay for itself. Sounds good?
Would it be nice to jump on a quick 10-minute call so I can show you exactly how we make this work?
Best,
Hapei
Marketing Director
Hey, I know you’re the owner of interviewgemini.com. I’ll be quick.
Fundraising for your business is tough and time-consuming. We make it easier by guaranteeing two private investor meetings each month, for six months. No demos, no pitch events – just direct introductions to active investors matched to your startup.
If youR17;re raising, this could help you build real momentum. Want me to send more info?
Hi, I represent an SEO company that specialises in getting you AI citations and higher rankings on Google. I’d like to offer you a 100% free SEO audit for your website. Would you be interested?
Hi, I represent an SEO company that specialises in getting you AI citations and higher rankings on Google. I’d like to offer you a 100% free SEO audit for your website. Would you be interested?
good
