Interviews are opportunities to demonstrate your expertise, and this guide is here to help you shine. Explore the essential Flagger Certification interview questions that employers frequently ask, paired with strategies for crafting responses that set you apart from the competition.
Questions Asked in Flagger Certification Interview
Q 1. Explain the core functionality of Flagger.
Flagger is a progressive delivery operator for Kubernetes. Its core functionality revolves around automating the process of deploying new application versions gradually and safely. Think of it as a sophisticated traffic controller for your application updates. Instead of abruptly switching to a new version, Flagger introduces it incrementally, monitoring its performance and health before fully promoting it. This minimizes the risk of widespread outages and allows for early detection of issues.
In essence, Flagger orchestrates canary deployments, A/B testing, and blue/green deployments, making it a powerful tool for managing application releases and ensuring a smooth user experience.
Q 2. Describe the different deployment strategies supported by Flagger.
Flagger supports several deployment strategies, each tailored to different risk tolerances and release goals:
- Canary Deployments: A small percentage of traffic is routed to the new version, allowing for close observation before wider rollout. This is the most common and cautious approach.
- A/B Testing: Multiple versions are released simultaneously, with traffic split between them. This allows for comparing performance and feature adoption rates.
- Blue/Green Deployments: Two identical environments (blue and green) exist. The new version is deployed to the green environment, and traffic is switched over once it’s validated. This offers rapid rollback capabilities.
- Progressive Rollouts: A gradual increase in traffic to the new version, based on pre-defined metrics or automated analysis. This provides fine-grained control over the release process.
The choice of strategy depends on the application’s criticality, the complexity of the changes, and the desired level of control.
Q 3. How does Flagger integrate with Kubernetes?
Flagger deeply integrates with Kubernetes through its custom resource definitions (CRDs). It utilizes Kubernetes resources like Deployments, Services, and Ingresses to manage the application lifecycle. It monitors the health and performance of deployments using Kubernetes metrics and events. Flagger doesn’t replace Kubernetes but extends its capabilities by providing advanced deployment strategies that are automated and controlled via the Kubernetes API.
You define your deployment strategy using a Flagger custom resource. Flagger then automatically manages the creation and update of Kubernetes resources based on this configuration and the observed metrics. This seamless integration makes it incredibly easy to manage complex deployments within the familiar Kubernetes ecosystem.
Q 4. What are the key metrics Flagger monitors during a canary deployment?
During a canary deployment, Flagger monitors various key metrics to assess the health and performance of the new version. These typically include:
- Request latency: How long it takes to process requests.
- Request success rate: Percentage of successful requests.
- Error rate: Percentage of failed requests.
- CPU and memory utilization: Resource consumption of the new version.
- Custom metrics: Application-specific metrics defined by the user (e.g., specific business KPIs).
Flagger leverages Prometheus for metric collection and analyzes these metrics to determine whether the new version is performing adequately and ready for full promotion.
Q 5. Explain the concept of canary analysis in Flagger.
Canary analysis in Flagger is the process of comparing the performance and health of the canary (new version) against the primary (stable version) deployment. Flagger uses the metrics collected from both versions to determine whether the canary is meeting predefined success criteria. This might involve comparing request latency, error rates, or other custom metrics.
If the canary performs better or equally to the primary version, it will be gradually promoted. If the canary underperforms, Flagger automatically rolls back to the previous version, minimizing downtime and ensuring service stability. This data-driven approach removes much of the guesswork from deployments.
Q 6. How does Flagger handle rollbacks?
Flagger handles rollbacks seamlessly by reverting the Kubernetes resources (Deployments, Services, Ingresses) back to the previous stable version. This ensures that the application quickly returns to a known working state. Rollbacks are typically triggered automatically if the canary analysis detects significant degradation in performance or health, or manually if necessary.
The rollback process is a crucial part of Flagger’s safety net, ensuring that a failed deployment doesn’t lead to a widespread service disruption.
Q 7. Describe Flagger’s relationship with Istio or other service meshes.
Flagger can integrate with service meshes like Istio or Linkerd to leverage their advanced traffic management capabilities. Service meshes provide fine-grained control over traffic routing, allowing Flagger to precisely route traffic to different versions of the application. This integration allows for more sophisticated canary deployments and A/B testing.
For example, with Istio, Flagger can use Istio’s virtual services and destination rules to control the traffic split between canary and primary deployments. This collaboration enables precise traffic routing and enhanced observability, providing Flagger with richer metrics to inform its decisions.
Q 8. What are the different analysis methods available in Flagger?
Flagger offers several analysis methods to assess the health and performance of your canary deployments. These methods ensure a smooth and safe transition to a new version of your application. The key is choosing the right method based on your application’s specific metrics and requirements.
- Canary Analysis: This is the most common method. Flagger monitors predefined metrics (like request latency, error rate, or successful requests) from both the primary and canary deployments. If the canary’s metrics meet or exceed predefined thresholds, it’s promoted. Think of it as a rigorous performance test before the new version goes fully live.
- Progressive Rollout Analysis: This method gradually increases traffic to the canary deployment based on successful analysis points. It’s less risky than an immediate full-scale rollout. You might start with 10% of traffic to the canary, then increase it to 20%, 50%, and so on, monitoring metrics at each step. This is like carefully testing the waters before jumping into a pool.
- Custom Analysis: For very specific scenarios, Flagger allows you to define custom analysis scripts using different metrics and complex logic. This is highly adaptable but requires more expertise and understanding of scripting and Flagger’s API. Imagine tailoring the deployment process for a unique application.
Q 9. How do you configure Flagger’s metrics provider?
Configuring Flagger’s metrics provider involves specifying which system Flagger will use to collect performance data from your deployments. This is done through the Flagger deployment’s configuration file (usually a Kubernetes YAML manifest).
You’ll typically need to specify the metrics provider’s type (e.g., Prometheus) and any necessary connection details such as the endpoint URL. For example, if using Prometheus, you’d specify the Prometheus server address.
apiVersion: flagger.app/v1beta1
kind: Canary
metadata:
  name: my-canary
spec:
  targetRef:
    apiVersion: apps/v1
    kind: Deployment
    name: my-deployment
  metrics:
    provider: prometheus
    prometheus:
      url: http://prometheus.default.svc:9090
The above snippet demonstrates a configuration using Prometheus. Other providers, like Datadog or custom ones, will require their respective configurations.
Q 10. Explain the importance of observability in Flagger deployments.
Observability is paramount in Flagger deployments because it ensures you can monitor and understand the behavior of your canary and primary deployments in real-time. Without effective observability, you’re essentially flying blind during deployments. This is especially crucial during canary releases because even a small regression can significantly impact your users.
Observability provides insights into several key areas: metrics, logs, and traces. Metrics give you numerical data points about your application’s health (e.g., request latency, error rates). Logs offer context into application events, while traces reveal the path of a request through your system. These allow for quick identification and resolution of issues arising during canary deployments.
For instance, if your canary deployment suddenly shows a spike in error rates, observability allows you to pinpoint the problem quickly, preventing its impact on production traffic.
Q 11. How does Flagger handle traffic splitting?
Flagger handles traffic splitting using a service mesh (like Istio or Linkerd) or a load balancer. This approach ensures that traffic is progressively diverted to the canary deployment while maintaining the ability to quickly roll back if problems occur.
For example, with Istio, Flagger creates a VirtualService that routes a percentage of traffic to the canary deployment’s service. This percentage is dynamically adjusted based on the canary analysis results. If the canary performs well, the percentage gradually increases until 100% of the traffic is directed to the canary. If the canary fails, the traffic is shifted back to the primary.
The key here is the gradual and controlled nature of the traffic shift. This minimizes disruption and risk.
Q 12. Describe how Flagger manages autoscaling during deployments.
Flagger doesn’t directly manage autoscaling but works in conjunction with Kubernetes’ Horizontal Pod Autoscaler (HPA). During a canary deployment, Flagger monitors the canary’s resource usage and performance. If the canary experiences higher traffic or resource demands, the HPA automatically scales the number of canary pods to handle the increased load. Similarly, if the canary performs poorly, and traffic is rolled back, the HPA might scale down the canary pods accordingly.
This integration ensures that your application scales effectively throughout the deployment process, handling both increased and decreased traffic demands seamlessly.
Q 13. How would you troubleshoot a failed Flagger deployment?
Troubleshooting a failed Flagger deployment requires a systematic approach, focusing on identifying the root cause through thorough observation and analysis. Here’s a step-by-step process:
- Check Flagger Logs: Examine the Flagger pod logs for any errors or warnings that provide clues about the failure.
- Examine Canary Analysis Results: Analyze the metrics collected by Flagger during the canary deployment. Are there any performance issues or anomalies that triggered the failure?
- Verify Metrics Provider Connectivity: Ensure Flagger can properly connect to your metrics provider (e.g., Prometheus). Verify the provider’s health and availability.
- Inspect Kubernetes Events: Check the Kubernetes events for any related errors or warnings that may point to issues with the deployment, service, or underlying infrastructure.
- Review Canary Configuration: Scrutinize the Flagger canary YAML configuration to ensure it is correctly specified and there are no typos or misconfigurations.
- Check Service Mesh (if applicable): If using a service mesh, examine its logs and configurations to verify that traffic routing is correctly set up.
By systematically investigating these areas, you can efficiently identify and resolve the underlying issue causing the failed Flagger deployment.
Q 14. What are the security considerations when using Flagger?
Security is crucial when using Flagger, as it manages the deployment of new versions of your application. Here are some important considerations:
- Authentication and Authorization: Ensure proper authentication and authorization mechanisms are in place for accessing Flagger and its associated Kubernetes resources. Use Role-Based Access Control (RBAC) to limit access to authorized personnel.
- Secrets Management: Store sensitive information, like database credentials or API keys, using Kubernetes secrets and ensure that Flagger is configured to access them securely.
- Network Policies: Implement network policies to restrict network access to Flagger and its associated components. This helps to prevent unauthorized access and mitigate potential attacks.
- Image Security: Use secure and well-maintained container images for your applications and Flagger itself. Scan images regularly for vulnerabilities.
- Input Validation and Sanitization: Sanitize all inputs to Flagger to prevent injection attacks such as command injection or SQL injection.
- Regular Security Audits: Conduct regular security audits and penetration testing to identify and address potential vulnerabilities.
By addressing these security considerations, you can ensure that the deployment process managed by Flagger remains secure and protects your applications from potential threats.
Q 15. Explain the concept of progressive delivery and how Flagger implements it.
Progressive delivery is a software release strategy that allows you to gradually roll out new features or updates to your application, minimizing risk and maximizing control. Instead of a big-bang deployment to all users at once, progressive delivery uses techniques like canary deployments, blue/green deployments, and A/B testing to deploy changes incrementally. Flagger automates this process by managing the rollout and rollback of releases based on pre-defined metrics and criteria.
Imagine releasing a new version of your e-commerce website. Instead of updating everyone at once (risking a site-wide outage if there’s a problem), Flagger can send the update to only 5% of users. Flagger then monitors key metrics like error rate and latency. If everything looks good, Flagger automatically increases the rollout percentage. If problems occur, Flagger automatically rolls back the deployment to prevent a wider impact. This controlled rollout ensures a smooth user experience and reduces the risk associated with software releases.
Career Expert Tips:
- Ace those interviews! Prepare effectively by reviewing the Top 50 Most Common Interview Questions on ResumeGemini.
- Navigate your job search with confidence! Explore a wide range of Career Tips on ResumeGemini. Learn about common challenges and recommendations to overcome them.
- Craft the perfect resume! Master the Art of Resume Writing with ResumeGemini’s guide. Showcase your unique qualifications and achievements effectively.
- Don’t miss out on holiday savings! Build your dream resume with ResumeGemini’s ATS optimized templates.
Q 16. How does Flagger manage different deployment environments?
Flagger manages different deployment environments by using Kubernetes namespaces or clusters. You define your environments (e.g., development, staging, production) in your Flagger configuration. Each environment will have its own Kubernetes namespace. Flagger then uses these namespaces to target specific deployments to each environment. This isolation is crucial for managing different versions of your application across various stages of the release process.
For example, your development environment might use a namespace called dev, staging might be staging, and production prod. Flagger knows where to deploy each version based on your configuration. This allows you to test in isolated environments without impacting users in production.
Q 17. How do you configure alerts and notifications in Flagger?
Flagger integrates with various monitoring and alerting systems to provide notifications when certain conditions are met during a deployment. This configuration typically involves specifying the monitoring system (e.g., Prometheus, Datadog) and defining the alert rules. You might set alerts for high error rates, latency spikes, or resource exhaustion. When these thresholds are exceeded, Flagger can trigger notifications via email, Slack, PagerDuty, or other tools.
A common configuration involves setting up Prometheus to monitor application metrics and Grafana for visualization. Flagger can be configured to use Prometheus’s alerting capabilities. For instance, you could configure an alert to trigger if the error rate exceeds 0.1% for 5 minutes. This ensures that you’re promptly notified of any issues during a rollout, allowing for rapid intervention.
apiVersion: flagger.app/v1beta1 kind: Canary metadata: name: my-canary spec: targetRef: apiVersion: apps/v1 kind: Deployment name: my-app metrics: - name: error-rate threshold: 0.001 selector: matchLabels: app: my-app source: prometheus weight: 50 analysis: interval: 5m # ... other configuration ... Q 18. Describe the process of setting up and configuring Flagger.
Setting up Flagger involves several steps. First, you need a Kubernetes cluster. Then, you install Flagger using Helm, a package manager for Kubernetes. After installation, you configure Flagger by creating custom resource definitions (CRDs) that describe your deployment strategies (e.g., canary, blue/green). These CRDs specify the application you want to deploy, the deployment strategy, and the metrics used for analysis. Finally, you need to configure your monitoring and alerting systems to integrate with Flagger.
Think of it like building a house. Kubernetes is the land, Helm is the construction company, the CRDs are the blueprints, and your monitoring systems are the utilities. Flagger orchestrates the entire process to ensure a smooth and automated deployment.
Q 19. What are some common challenges encountered when using Flagger?
Some common challenges include integrating with legacy systems that lack appropriate metrics or automation. Another common hurdle is understanding the nuances of different deployment strategies and selecting the appropriate strategy for your specific application. Insufficient monitoring or incorrect configuration of thresholds can lead to false positives or missed issues. Finally, ensuring that your alerting system is properly configured and tested to prevent alert fatigue is crucial.
For example, a poorly designed canary deployment could lead to a bad user experience if the new version has unexpected issues, highlighting the importance of thorough testing and monitoring.
Q 20. How do you integrate Flagger with your CI/CD pipeline?
Integrating Flagger with your CI/CD pipeline typically involves using GitOps principles or other automation tools. Your CI/CD pipeline would build and push your application image to a container registry. Then, Flagger would be triggered (e.g., using a webhook) to deploy the new image based on your predefined deployment strategy. This integration ensures automated deployments and seamless transitions between environments. This integration helps to automate deployments, reduce manual errors, and accelerate the release cycle.
Think of your CI/CD pipeline as the assembly line. Flagger is the quality control and final shipping department, ensuring only the highest quality software reaches your users.
Q 21. How would you monitor the health and performance of a Flagger deployment?
Monitoring a Flagger deployment involves observing the health and performance of the Flagger itself, as well as the applications it’s deploying. You can use standard Kubernetes monitoring tools like metrics-server, and integrate them with Prometheus and Grafana for visualization and alerting. For application monitoring, it’s essential to track relevant metrics such as CPU usage, memory consumption, request latency, and error rates. These metrics will help you understand if your deployments are healthy and performing as expected. Additionally, monitoring the Flagger deployment itself ensures it’s operating correctly and isn’t encountering any issues that might disrupt your deployments. Using appropriate dashboards to visualize metrics and alerts will allow you to rapidly detect and address problems.
Q 22. Compare and contrast Flagger with other progressive delivery tools.
Flagger is a progressive delivery operator for Kubernetes that automates canary deployments and rollouts. Unlike simpler tools that only manage deployments, Flagger leverages metrics to assess the health and performance of new versions before promoting them to full production. This differs significantly from tools like Spinnaker, which offer a broader range of deployment strategies but might require more manual configuration for sophisticated canary analysis. Argo Rollouts, while similar in its progressive delivery focus, often necessitates more intricate YAML configuration, whereas Flagger provides a more streamlined experience with its intuitive API and declarative approach. For instance, imagine deploying a new version of your e-commerce website. While Spinnaker could manage the deployment, Flagger ensures only healthy, high-performing versions reach all users by actively monitoring key metrics such as request latency and error rates. In contrast, a simpler deployment tool might simply deploy the new version without actively verifying its stability and performance.
- Flagger: Automated canary analysis, metrics-driven promotion, Kubernetes-native.
- Spinnaker: Broader CI/CD capabilities, manual canary configuration often required.
- Argo Rollouts: Advanced progressive delivery features, steeper learning curve with YAML configuration.
Q 23. Explain the different ways to configure Flagger’s Canary analysis thresholds.
Flagger’s canary analysis hinges on metrics. You define thresholds for these metrics to determine the success or failure of a canary deployment. This configuration is flexible and can be tailored to your application’s specifics. You can configure thresholds in several ways:
- Percentage-based thresholds: You can set thresholds as percentages of the primary deployment’s metric values. For example, if the primary deployment has an average latency of 200ms, you might set a threshold allowing a maximum of 210ms (a 5% increase) for the canary.
- Absolute thresholds: These set a fixed value for the metric. If your application’s error rate shouldn’t exceed 1%, you’d set an absolute threshold of 0.01.
- Metric selectors: This allows specifying the exact Prometheus metrics to observe, providing granular control. For instance, you might only consider metrics from specific pods or namespaces.
- Weight-based thresholds: These control the traffic weighting during canary deployments. You could configure a gradual increase in traffic to the canary version based on success against a specific threshold.
These thresholds are defined within Flagger’s custom resource definitions (CRDs), usually as part of the Canary analysis configuration. A typical example could involve setting a maximum error rate of 0.01 and a latency increase limit of 10% using Prometheus metrics.
apiVersion: flagger.app/v1beta1kind: Canarymetadata: name: my-canaryspec: targetRef: name: my-deployment kind: Deployment analysis: metrics: - name: error-rate threshold: 0.01 - name: latency threshold: 1.10Q 24. How does Flagger handle scaling during a canary deployment?
Flagger handles scaling during a canary deployment automatically, leveraging Kubernetes’ built-in autoscaling mechanisms. It does this by creating separate deployments for the primary and canary versions. Kubernetes handles the independent scaling of each deployment based on its resource requirements and defined scaling policies (like Horizontal Pod Autoscaler – HPA). As more traffic is routed to the canary, Kubernetes dynamically scales the canary deployment to handle the increased load. Think of it like having two independent restaurant kitchens; as more customers request food from the new menu (canary), the kitchen preparing the new dishes scales to handle the increased demand, ensuring smooth service without impacting the original kitchen’s operations.
This dynamic scaling prevents resource contention and guarantees both the primary and canary versions have sufficient resources, minimizing performance degradation and ensuring a smooth transition.
Q 25. Describe how Flagger integrates with Prometheus and Grafana.
Flagger integrates seamlessly with Prometheus for metrics collection and Grafana for visualization. Prometheus acts as the source of truth for application metrics, providing data on key performance indicators like request latency, error rates, and throughput. Flagger polls Prometheus to get the latest metrics and uses them to evaluate the canary deployment’s health. Grafana, on the other hand, provides a user-friendly dashboard to monitor the canary deployment’s progress and visualize the collected metrics. You can create dashboards showing the metric values over time, aiding in identifying potential issues or successful performance improvements. The combination provides a complete picture of the deployment’s health and performance.
In essence, Prometheus supplies the data, Flagger interprets it to decide on promotion, and Grafana offers an interactive dashboard to understand the health and performance of your deployment. For example, a Grafana dashboard might show graphs comparing the error rates of the primary and canary versions in real-time, assisting in identifying a potential issue in the new version.
Q 26. What are the different ways to configure Flagger’s authentication and authorization?
Flagger’s authentication and authorization are flexible, allowing integration with various security mechanisms. The primary approach utilizes Kubernetes’ Role-Based Access Control (RBAC). You define Kubernetes roles and role bindings to grant specific permissions to Flagger and its associated components. This ensures only authorized users and services can access and manage Flagger resources. Furthermore, if your Kubernetes cluster uses authentication mechanisms like OpenID Connect (OIDC) or others, Flagger will inherit this security setup without any further configuration needed.
In simpler terms, imagine a security guard (RBAC) at the entrance of your data center. Only people with the right access cards (roles and bindings) can access Flagger’s controls. This ensures only authorized personnel manage your deployments.
Q 27. How would you optimize Flagger’s performance for large-scale deployments?
Optimizing Flagger’s performance for large-scale deployments involves several key strategies:
- Efficient Metric Collection: Carefully select the metrics to monitor, avoiding unnecessary data collection that might overload Prometheus. Focus on the most critical metrics relevant to the canary analysis.
- Horizontal Pod Autoscaling (HPA): Implement HPA for both the primary and canary deployments to automatically scale resources based on demand, preventing performance bottlenecks.
- Prometheus Optimization: Ensure your Prometheus instance is properly configured and scaled to handle the influx of metrics from your large-scale deployment. Consider using techniques like query filtering and data aggregation to reduce load.
- Resource Limits and Requests: Set appropriate resource limits and requests for Flagger’s pods to prevent resource exhaustion. This is crucial for stability and preventing slowdowns.
- Efficient Canary Analysis Strategy: Carefully plan the traffic routing strategy and analysis parameters to minimize the duration of the canary analysis phase, improving overall deployment speed.
By carefully optimizing these factors, you can avoid performance issues and maintain the efficiency of your deployments, even at scale. It’s essential to regularly monitor system metrics to ensure no performance regressions occur over time.
Q 28. Explain how you would debug and troubleshoot issues in a Flagger deployment.
Debugging and troubleshooting Flagger deployments begins with understanding where the issue lies. Common issues include:
- Canary deployment failures: Examine the Kubernetes logs for the canary deployment to identify the root cause. Tools like
kubectl logscan help. - Metric collection problems: Verify that Prometheus is correctly collecting the desired metrics and that Flagger’s configuration correctly points to them. Inspect Prometheus’s status and query the relevant metrics directly.
- Flagger pod issues: Check the status of Flagger’s pods using
kubectl get pods -n. Examine logs for errors and resource constraints. - Incorrect configuration: Carefully review the Flagger custom resource definitions (CRDs) and ensure the parameters are correctly specified. Cross-check values against documentation and examples.
- Network connectivity problems: Ensure Flagger can communicate with Prometheus and Kubernetes. Check network policies and firewall rules.
A systematic approach involves checking the logs, investigating resource usage, and verifying configurations. Using kubectl describe on relevant resources provides detailed information. The Flagger community forum and GitHub issues can also be valuable resources for troubleshooting common problems.
Key Topics to Learn for Flagger Certification Interview
- Understanding Flagger’s Architecture: Grasp the core components and how they interact to manage canary deployments and A/B testing.
- Deployment Strategies with Flagger: Explore practical applications like canary rollouts, blue/green deployments, and A/B testing using Flagger. Be prepared to discuss the advantages and disadvantages of each.
- Metrics and Monitoring: Understand how to configure and interpret metrics crucial for successful deployments. Discuss the role of Prometheus and Grafana in monitoring Flagger deployments.
- Advanced Configuration and Customization: Familiarize yourself with advanced Flagger features, such as custom metrics, analysis of deployment progress, and integration with different CI/CD pipelines.
- Troubleshooting and Problem-solving: Prepare for scenarios requiring troubleshooting deployment issues. Consider common problems and their solutions related to Flagger’s functionality and integration.
- Security Considerations: Discuss security best practices when using Flagger, including authentication and authorization mechanisms and securing your deployment pipeline.
- Integration with Kubernetes: Demonstrate a thorough understanding of Flagger’s integration with Kubernetes, including custom resource definitions (CRDs) and operator concepts.
Next Steps
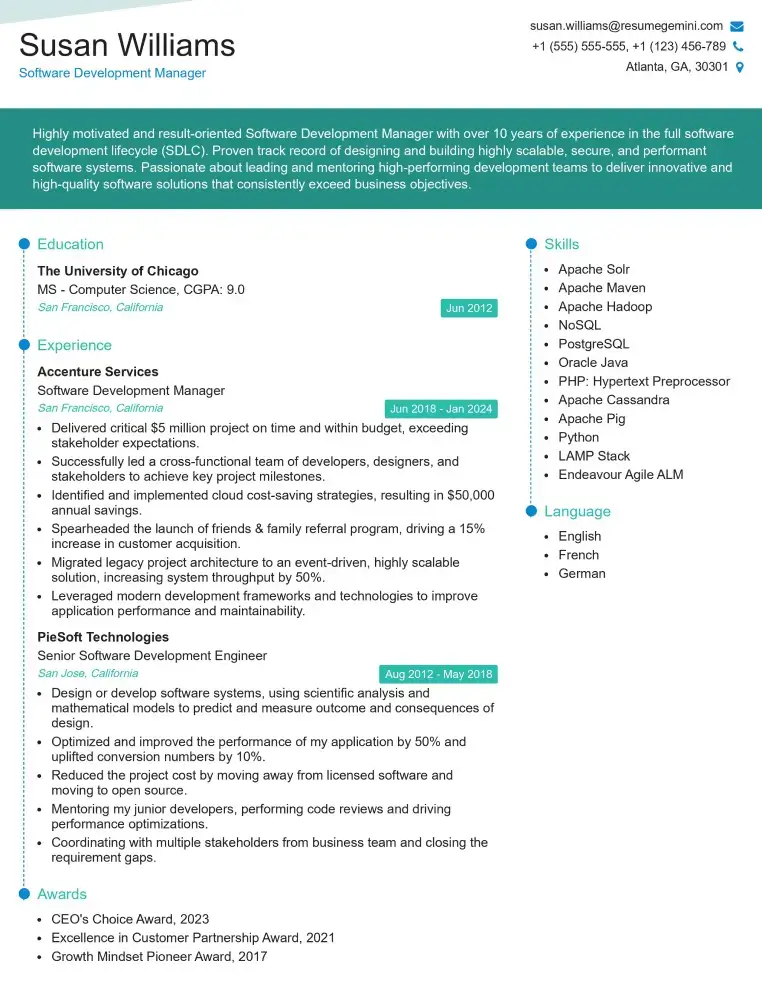
Mastering Flagger Certification significantly enhances your skills in progressive delivery and microservices management, making you a highly sought-after candidate in the DevOps and cloud engineering fields. To maximize your job prospects, crafting an ATS-friendly resume is crucial. ResumeGemini is a trusted resource that can help you build a professional and impactful resume, ensuring your qualifications stand out. We provide examples of resumes tailored to Flagger Certification to guide you in creating a compelling application.
Check Out Resume Samples at ResumeGemini

Check Out Resume Samples at ResumeGemini
Check Out Resume Samples at ResumeGemini

Check Out Resume Samples at ResumeGemini
Check Out Resume Samples at ResumeGemini
Check Out Resume Samples at ResumeGemini
Check Out Resume Samples at ResumeGemini
Explore more articles
Users Rating of Our Blogs
Share Your Experience
We value your feedback! Please rate our content and share your thoughts (optional).
What Readers Say About Our Blog
Very informative content, great job.
good