The right preparation can turn an interview into an opportunity to showcase your expertise. This guide to Gage Calibration and Verification interview questions is your ultimate resource, providing key insights and tips to help you ace your responses and stand out as a top candidate.
Questions Asked in Gage Calibration and Verification Interview
Q 1. Explain the difference between calibration and verification.
Calibration and verification are both crucial for ensuring the accuracy of measurement instruments, but they differ in their scope and purpose. Think of it like this: calibration is like a complete tune-up for your car, while verification is a quick check-up to make sure everything’s still running smoothly.
Calibration is the process of comparing a measurement instrument to a known standard of higher accuracy. It involves adjusting the instrument to meet pre-defined specifications. If the instrument is outside of acceptable tolerances, adjustments are made to bring it back within those tolerances, and a calibration certificate is issued documenting the results. For example, calibrating a pressure gauge involves comparing its readings against a known accurate pressure source. Any discrepancies are then addressed, and a report stating the device’s accuracy is generated.
Verification, on the other hand, is a simpler process that checks if an instrument still meets its specifications without adjusting it. It confirms whether the instrument is operating within acceptable limits. If it fails verification, it typically needs calibration. For instance, verifying a thermometer might involve comparing its reading to a known temperature source, but no adjustments are made to the thermometer itself. A simple pass/fail result is recorded.
Q 2. Describe the process of calibrating a micrometer.
Calibrating a micrometer involves comparing its measurements to a set of calibrated gauge blocks (standards of known dimensions). The process typically looks like this:
- Prepare the Equipment: Gather the micrometer, a set of calibrated gauge blocks, a clean, stable surface, and a magnifying glass (optional, for improved precision).
- Clean the Micrometer: Thoroughly clean the micrometer anvils and spindle to remove any debris that might affect measurements.
- Check the Zero Setting: Close the micrometer anvils completely. The reading should be zero. If not, you might need to adjust the zero setting (this is usually possible through a small adjustment mechanism on the micrometer). This is crucial to all further readings.
- Compare to Gauge Blocks: Using the appropriate gauge blocks, measure a known dimension, comparing the micrometer reading to the known value of the gauge block. Repeat this process using multiple gauge blocks, covering the full measurement range of the micrometer.
- Record Data: Meticulously record all measurements in a calibration log, including date, time, gauge block values, micrometer readings, and any discrepancies.
- Analyze Data: Calculate the difference between the micrometer reading and the known value for each gauge block. If these differences fall outside the acceptable tolerance (specified by the micrometer’s manufacturer or relevant standards), adjustments may be needed. However, adjustments to a micrometer are often only performed by a qualified technician.
- Generate Report: If the micrometer passes calibration within tolerance, a calibration certificate or report is issued, specifying the accuracy and uncertainties of the device.
Remember, safety is paramount! Always handle the gauge blocks and micrometer with care to prevent damage.
Q 3. What is a Measurement Uncertainty and how is it determined?
Measurement uncertainty quantifies the doubt associated with a measurement result. It represents the range of values within which the true value of the measurement is likely to lie. Think of it as a margin of error. A smaller uncertainty indicates a more precise and reliable measurement.
Determining measurement uncertainty is not simply finding the difference between two repeated measurements, it involves a more rigorous process, often using a combination of methods, including:
- Type A Uncertainty: Determined statistically from repeated measurements. It accounts for random errors.
- Type B Uncertainty: Determined by other means than statistical analysis, like using manufacturer’s specifications, calibration certificates, or reference materials. It accounts for systematic errors and other potential sources of uncertainty.
The combined uncertainty is usually calculated using the square root of the sum of the squares (RSS) of Type A and Type B uncertainties. The result is then usually expressed with a coverage factor (e.g., k=2 for 95% confidence) to give the expanded uncertainty. For instance, a measurement of 10 mm ± 0.1 mm (k=2) means we’re 95% confident the true value lies between 9.9 mm and 10.1 mm.
Q 4. What are the different types of calibration standards?
Calibration standards are artifacts or systems used to calibrate measurement instruments. They are essential for traceability and accurate measurements. Different types exist, depending on the measured parameter:
- International Standards: The most accurate, usually maintained by national metrology institutes (e.g., NIST in the US). These are often the top of the calibration hierarchy, used to calibrate primary standards.
- Primary Standards: These are highly accurate standards that are directly traceable to international standards. They’re used to calibrate secondary standards.
- Secondary Standards: Used for routine calibration of working standards and measurement instruments.
- Working Standards: These are the standards used in everyday calibration of measurement equipment. They are frequently recalibrated against secondary or primary standards.
Examples include gauge blocks for length, weight sets for mass, and calibrated thermometers for temperature. The choice of standard depends on the instrument being calibrated and the required accuracy level.
Q 5. Explain the concept of traceability in calibration.
Traceability in calibration establishes an unbroken chain of comparisons between a measurement result and a national or international standard. Imagine a family tree for your measurement: each generation is connected to the previous one, ultimately leading back to the most accurate source. This ensures that the accuracy of your measurements can be reliably verified.
Traceability is vital for ensuring confidence in measurement results. It allows comparison of results across different labs and organizations. For instance, if a company uses a calibrated pressure gauge, traceability means that the accuracy of the gauge can be linked back to the national standard for pressure, providing assurance that the measurements are reliable and consistent.
A calibration certificate plays a crucial role in demonstrating traceability. It should explicitly state the traceability chain, including the calibration standards used and their certification details.
Q 6. How do you identify and manage calibration discrepancies?
Calibration discrepancies arise when a measuring instrument’s readings deviate from its specified accuracy limits. Identifying them requires a structured approach:
- Regular Calibration: Implement a robust calibration schedule to detect discrepancies early. The frequency depends on the instrument’s criticality and usage.
- Calibration Records: Maintain detailed calibration records, documenting measurements, deviations, and corrective actions. This provides historical data to identify trends or patterns.
- Control Charts: Monitoring data through control charts allows for visual identification of systematic deviations or out-of-control situations.
- Investigation: If a discrepancy is found, investigate the cause. Possible reasons include instrument damage, improper usage, environmental factors, or degradation of the standard.
- Corrective Action: Depending on the cause, implement corrective actions such as recalibration, repair, or replacement of the instrument.
- Document Everything: Keep detailed records of all investigations and corrective actions taken. This allows for continuous improvement and prevents similar issues from recurring.
Managing discrepancies requires a proactive, systematic approach that emphasizes thorough record-keeping, investigation, and corrective actions. Ignoring discrepancies can lead to inaccurate measurements, which can have significant consequences in various industries.
Q 7. What is a Gage R&R study and why is it important?
A Gage Repeatability and Reproducibility (Gage R&R) study is a statistical method used to assess the variability of a measurement system. It determines how much of the overall variation in measurements is due to the gauge itself (repeatability) and how much is due to different operators using the gauge (reproducibility). Think of it like this: if multiple people measure the same thing with the same instrument, how consistent are the readings?
The importance of a Gage R&R study lies in its ability to evaluate the measurement system’s capability before using it for critical measurements. A Gage R&R study helps answer several questions:
- Is the gauge precise enough? Does it provide consistent measurements when the same person uses it repeatedly?
- Is the gauge reliable? Do different operators get consistent results when using the same gauge?
- Is the gauge suitable for the application? Is the variation introduced by the gauge acceptable compared to the total variation in the measured characteristic?
If the Gage R&R study shows excessive variability, it indicates that the measurement system is unreliable, necessitating improvements such as operator training, gauge replacement, or improved measurement techniques.
Q 8. Explain the components of a Gage R&R study report.
A Gage R&R (Repeatability and Reproducibility) study report provides a comprehensive assessment of measurement system variability. It details how much variation is introduced by the measurement system itself, as opposed to true variation in the parts being measured. Key components typically include:
- Summary Statistics: This section presents key metrics like %Contribution to Total Variation for repeatability (EV), reproducibility (AV), and operator variation. It also shows the overall Gage R&R, often expressed as a percentage. This immediately tells you how much of the total variation is attributable to measurement error.
- ANOVA (Analysis of Variance) Table: This table provides a statistical breakdown of the variation sources, showing the contribution of repeatability (variation from repeated measurements by a single operator on the same part), reproducibility (variation between different operators measuring the same part), and part-to-part variation (the actual variation in the parts being measured). This allows you to pinpoint the major sources of measurement error.
- Graphs: Visual aids, such as box plots, histograms, and control charts, are essential for understanding the data. Box plots readily display the spread and central tendency of measurements for different operators and parts, highlighting outliers or inconsistencies. Histograms show the distribution of measurements. Control charts help assess the stability and capability of the measurement system.
- Study Details: This section describes the study parameters, including the number of parts, operators, and measurements per part; the measurement instrument used; and the study methodology. This ensures reproducibility and transparency.
- Conclusions and Recommendations: This section summarizes the findings and provides actionable recommendations for improvement. If the Gage R&R is unacceptable, it would suggest actions like operator training, instrument calibration, or a different measurement system.
Q 9. How do you interpret a Gage R&R study?
Interpreting a Gage R&R study involves assessing the percentage of total variation attributable to the measurement system. A common benchmark is the rule of thumb: Gage R&R should be less than 10% of the total variation. If it exceeds this, it indicates significant measurement error which can lead to inaccurate conclusions about the process.
For instance, if the Gage R&R is 30%, it means 30% of the observed variation is due to the measurement system itself, not the actual variation in the parts. This high level of measurement error obscures the true process capability and makes it difficult to make informed decisions. You should look for patterns in the data. Are certain operators consistently producing more variation than others? Does the variation appear to be more related to repeatability or reproducibility? Identifying these patterns will highlight areas for improvement.
The ANOVA table provides critical information about the sources of variation, allowing for a targeted approach to problem-solving. For example, high reproducibility might indicate a need for better training or standardization of measurement procedures. High repeatability could suggest instrument issues or a need for better measurement practices.
Q 10. What are the different types of Gage R&R studies?
There are primarily two types of Gage R&R studies:
- Cross (or Between-Operators and Within-Operator) Gage R&R: This is the most common type, involving multiple operators measuring the same set of parts multiple times. It assesses both repeatability (within-operator variation) and reproducibility (between-operator variation). This approach gives a comprehensive picture of the measurement system’s variability.
- Nested (or Within-Operator Only) Gage R&R: In this type, a single operator measures the same set of parts multiple times. This focuses solely on repeatability, assessing the consistency of the measurement system itself without considering operator-to-operator variation. This is useful when operator variation is not a primary concern (e.g., automated measurement systems).
The choice depends on the specific context. If consistency across multiple operators is critical, a Cross Gage R&R is essential. If you are evaluating a highly automated or standardized system where operator variation is minimal, a Nested Gage R&R might suffice.
Q 11. Describe the process of performing a Gage R&R study.
Performing a Gage R&R study involves a systematic process:
- Define Objectives and Scope: Clearly specify the purpose of the study, the measurement system to be evaluated, and the parts to be measured. This sets the stage for a focused and effective study.
- Select Parts: Choose a representative sample of parts that reflect the range of variation expected in the actual process. This selection is crucial for ensuring that the results are representative of the real-world scenario.
- Select Operators: Include operators who typically use the measurement system. This provides realistic data that reflects the everyday usage of the instrument.
- Measure the Parts: Each selected operator measures each part multiple times according to a pre-defined procedure. Consistent measurement technique is paramount for accurate results.
- Analyze the Data: Use statistical software (like Minitab, JMP, or specialized Gage R&R software) to perform the ANOVA analysis and generate the report. The software calculates key metrics and produces visual aids.
- Interpret the Results: Assess the percentage of total variation attributable to the measurement system. Determine whether the measurement system is acceptable based on pre-defined criteria or industry standards.
- Report Findings and Recommendations: Document the study methodology, results, and conclusions. Provide clear and actionable recommendations for improvement, if necessary.
Q 12. How do you select appropriate sampling methods for a Gage R&R study?
Sampling methods for a Gage R&R study must ensure that the selected parts are representative of the population of parts being measured. The goal is to avoid bias and obtain results that can be generalized to the entire population. Common approaches include:
- Stratified Random Sampling: Divide the population of parts into strata (e.g., based on size or other relevant characteristics) and then randomly sample from each stratum. This ensures representation from various segments.
- Random Sampling: Select parts randomly from the entire population. This is a simple method, but it might not adequately represent subgroups within the population if significant variation exists between them. It’s important to check the variation of the sample and repeat sampling if necessary.
- Systematic Sampling: Select parts at regular intervals from the population. This method is simple and can be efficient, but it might not be suitable if there is a pattern or cycle in the population of parts.
The choice depends on the population’s structure and the level of detail required. For instance, if the process produces parts with different key characteristics (e.g., length), stratified sampling ensures the inclusion of parts from across this range. The sample size (number of parts) should also be carefully considered, balancing the desire for statistical power with the resources available. Usually, 5 to 10 parts is sufficient, but statistical software can help determine the ideal sample size based on desired precision.
Q 13. What is the meaning of repeatability and reproducibility in Gage R&R?
In Gage R&R, repeatability and reproducibility are crucial components of measurement system variability:
- Repeatability (EV): This refers to the variation observed when the same operator measures the same part multiple times using the same instrument. It represents the inherent variability of the measurement instrument and the operator’s technique in repeating the measurement. High repeatability suggests that the instrument or operator is consistently providing different measurements even under identical conditions. Think of it as the consistency of the instrument and the operator’s technique in conducting multiple measurements.
- Reproducibility (AV): This refers to the variation observed when different operators measure the same part using the same instrument. It reflects the differences in measurement techniques or biases among operators. High reproducibility indicates that the same part is being measured differently by different operators. Imagine each operator using the measuring instrument with their own slightly different technique.
Both repeatability and reproducibility contribute to the overall Gage R&R. Understanding their individual contributions helps pinpoint the specific sources of measurement error and enables targeted improvement actions.
Q 14. How do you determine the acceptable level of variability in a Gage R&R study?
Determining the acceptable level of variability in a Gage R&R study often involves considering both statistical benchmarks and process requirements. The commonly used guideline is that the Gage R&R should be less than 10% of the total variation. However, the specific acceptable level might vary depending on the application and the level of precision required. For instance, a very precise manufacturing process will have a far lower tolerance for measurement error compared to a less critical manufacturing process. For critical applications, you might only want 5% or even lower.
Beyond the 10% guideline, it’s essential to consider the process capability. If the process variation itself is already high, a higher Gage R&R might still be acceptable; conversely, a very tight process capability would require a much lower Gage R&R. A thorough understanding of the process tolerance is crucial for setting realistic expectations. Often, acceptable values are determined based on historical data and understanding the process’s natural variation.
In practice, it’s important to compare the Gage R&R to the process tolerance. If the Gage R&R is a significant fraction of the process tolerance, it could mask process variation, impacting the accuracy of any conclusions about the process.
Q 15. What is a control chart and how is it used in calibration?
A control chart is a graph used to study how a process changes over time. In calibration, it visually displays the results of repeated measurements of a gage (measuring instrument) over time. This allows us to monitor the stability and performance of the gage, detecting any trends or shifts that might indicate a problem. Think of it like a check-up for your measuring tools. Instead of just looking at individual measurements, we see the bigger picture of how the gage is performing consistently.
For instance, if we’re calibrating a pressure gage, we might take multiple readings of a known standard pressure. Each reading is plotted on the control chart. By observing the pattern of the plotted points, we can assess if the gage is functioning within acceptable limits.
Career Expert Tips:
- Ace those interviews! Prepare effectively by reviewing the Top 50 Most Common Interview Questions on ResumeGemini.
- Navigate your job search with confidence! Explore a wide range of Career Tips on ResumeGemini. Learn about common challenges and recommendations to overcome them.
- Craft the perfect resume! Master the Art of Resume Writing with ResumeGemini’s guide. Showcase your unique qualifications and achievements effectively.
- Don’t miss out on holiday savings! Build your dream resume with ResumeGemini’s ATS optimized templates.
Q 16. Explain the different types of control charts used in calibration.
Several types of control charts are used in calibration, each designed for a specific purpose. The most common are:
- Shewhart Charts (X-bar and R charts): These charts are used to monitor the average (X-bar) and the range (R) of measurements. The X-bar chart shows the central tendency of the data, while the R chart shows the variability. They are excellent for detecting shifts in the mean or increases in variability. Imagine a scenario where a micrometer starts consistently reading 0.02mm too low; a Shewhart chart would easily highlight this drift.
- Individuals and Moving Range (I-MR) charts: Used when only individual measurements are available, not subgroups. The I chart displays the individual measurements, while the MR chart tracks the range between consecutive measurements. This is useful when calibrating single-item gages or when subgroups aren’t feasible.
- CUSUM (Cumulative Sum) charts: These charts are more sensitive to small, gradual shifts in the process mean. They accumulate the deviations from a target value, making them ideal for detecting subtle drifts that might be missed by Shewhart charts.
The choice of chart depends on the specific calibration process and the data being collected.
Q 17. How do you interpret control chart data?
Interpreting control chart data involves looking for patterns and signals that indicate whether the gage is performing within acceptable limits. Points consistently falling outside the control limits (upper and lower control limits) suggest the gage is out of control and may require repair or recalibration. Similarly, trends (consecutive points increasing or decreasing) or non-random patterns (e.g., runs, cycles) signal potential problems. For instance, a consistently increasing trend might indicate wear and tear in the gage mechanism.
In contrast, points randomly distributed within the control limits suggest a stable and consistent gage. It’s crucial to understand that occasional points outside the control limits (due to random variation) don’t necessarily indicate a problem, but a pattern of such occurrences warrants attention. A thorough understanding of statistical process control principles is vital for accurate interpretation.
Q 18. What is the purpose of a calibration certificate?
A calibration certificate is a formal document that provides evidence that a gage has been calibrated against a traceable standard and is performing within specified tolerances. It serves as proof of the gage’s accuracy and reliability, essential for quality control and regulatory compliance. Think of it as a passport for your measuring tool, verifying its trustworthiness. Without this certification, your measurements lack the confidence needed in many industrial processes and regulatory contexts.
Q 19. What information should be included in a calibration certificate?
A calibration certificate should include the following information:
- Identification of the Gage: Unique serial number, model, and manufacturer.
- Calibration Date: The date the calibration was performed.
- Calibration Method: Details of the procedures and standards used.
- Calibration Results: Measured values for each point calibrated, including uncertainties.
- Standards Used: Identification and traceability of the reference standards.
- Uncertainty of Measurement: The level of uncertainty associated with the calibration results.
- Calibration Interval: The recommended time between subsequent calibrations.
- Signature and Accreditation: Signature of the calibrator and accreditation details of the calibration laboratory.
Q 20. What are the different types of calibration intervals?
Calibration intervals are the recommended time periods between successive calibrations. These intervals are determined based on various factors and can vary widely. Some common types of calibration intervals include:
- Fixed Intervals: A predetermined period (e.g., annually, biannually) regardless of use or conditions.
- Time-Based Intervals: Calibration is performed after a certain amount of time has elapsed since the last calibration, regardless of use.
- Usage-Based Intervals: Calibration is scheduled based on the number of measurements taken or the duration of use.
- Condition-Based Intervals: Calibration is triggered by events such as exceeding a certain number of measurements or detection of significant drift.
Q 21. How do you determine the appropriate calibration interval?
Determining the appropriate calibration interval requires careful consideration of several factors:
- Gage Type and Stability: More stable gages may have longer intervals.
- Usage Frequency: Frequent use may necessitate more frequent calibration.
- Environmental Conditions: Harsh environments may require shorter intervals.
- Calibration History: Data from previous calibrations (control charts) can help identify trends and predict future performance.
- Regulatory Requirements: Certain industries have specific requirements for calibration frequency.
- Risk Assessment: A higher risk associated with inaccurate measurements warrants shorter intervals.
Often, a combination of factors is considered, leading to a tailored calibration schedule. This involves a risk-based approach balancing the cost of calibration with the potential consequences of inaccurate measurements.
Q 22. Explain the concept of equipment qualification.
Equipment Qualification is a critical process in ensuring that the tools and instruments used in a manufacturing or testing environment consistently deliver accurate and reliable results. It’s not just about ensuring equipment *works*; it’s about formally verifying that it works correctly for its intended purpose.
This process typically involves three stages:
- Installation Qualification (IQ): This stage verifies that the equipment has been installed correctly according to the manufacturer’s specifications. Think of it like assembling furniture – you need to make sure all the parts are present and assembled correctly before using it.
- Operational Qualification (OQ): Here, we verify that the equipment performs as expected under defined operating parameters. For example, for an autoclave (a device that uses steam to sterilize equipment), OQ might involve testing its ability to reach and maintain specific temperature and pressure settings.
- Performance Qualification (PQ): This is the final stage, demonstrating that the equipment consistently produces reliable results under real-world operating conditions. For example, for a weighing scale, PQ might involve repeated weighings of calibrated weights to confirm accuracy and precision.
Failing to properly qualify equipment can lead to inaccurate measurements, flawed products, and potential safety hazards. A well-defined equipment qualification plan is crucial for maintaining compliance with regulatory requirements and ensuring data integrity.
Q 23. How do you maintain the integrity of calibration standards?
Maintaining the integrity of calibration standards is paramount; they are the foundation upon which all other measurements are built. Think of them as the ‘gold standard’ against which all our instruments are compared.
Several key strategies ensure this integrity:
- Proper Storage and Handling: Calibration standards should be stored in a controlled environment, protected from factors like temperature fluctuations, humidity, and physical damage. This might involve specialized storage cases or vaults.
- Regular Calibration and Traceability: Standards themselves need to be regularly calibrated against higher-order standards, often traceable back to national or international standards organizations. This creates an unbroken chain of traceability, ensuring accuracy.
- Documentation and Record Keeping: Meticulous records of calibration dates, results, and any handling or maintenance are essential. This documentation provides a history of the standard’s performance and ensures its continued validity.
- Preventive Maintenance: Some standards might require specific cleaning or handling procedures to prevent degradation. For example, optical standards might require careful cleaning to prevent scratches that would affect measurements.
- Damage Assessment: Regularly inspect standards for any signs of damage. Any damage, even minor, could compromise their accuracy and requires prompt action.
Neglecting these practices can lead to cascading errors throughout the measurement process, resulting in inaccurate results, wasted materials, and potential product failures.
Q 24. Describe your experience with different calibration software.
I have extensive experience with various calibration software packages, including Fluke Calibration, MET/CAL, and EasyCal. Each has its own strengths and weaknesses, and the best choice often depends on the specific needs of the organization and the types of instruments being calibrated.
For example, Fluke Calibration offers comprehensive software for managing a wide range of instruments, while MET/CAL provides robust features for data analysis and reporting. EasyCal is often preferred for its user-friendly interface and suitability for smaller-scale operations.
My expertise encompasses not only the use of these software packages but also the management of calibration data, the generation of reports compliant with industry standards (like ISO 17025), and the integration of calibration software with other enterprise resource planning (ERP) systems. This ensures a seamless workflow from instrument calibration to data analysis and reporting.
Q 25. What are some common challenges in Gage Calibration and Verification?
Gage Calibration and Verification faces several recurring challenges. One significant issue is maintaining traceability to national or international standards. Ensuring the accuracy of standards themselves can be complex and costly.
Other common challenges include:
- Managing large numbers of instruments: In large organizations, tracking and scheduling calibration for hundreds or even thousands of instruments can be a logistical nightmare.
- Maintaining accurate records: Accurate and complete calibration records are vital for compliance and quality assurance, but maintaining these records can be time-consuming and prone to errors.
- Staff training and expertise: Proper training is needed to ensure technicians have the skills and knowledge to accurately calibrate and verify instruments.
- Cost optimization: Finding a balance between cost-effective calibration practices and the need for accuracy and reliability is a constant challenge.
- Dealing with outdated equipment: Obsolete instruments may lack proper calibration procedures or certified standards, making calibration more difficult.
Addressing these challenges requires a combination of robust software solutions, well-defined processes, and appropriately trained personnel.
Q 26. How do you troubleshoot common calibration issues?
Troubleshooting calibration issues involves a systematic approach. I typically start by reviewing the calibration procedure and checking for any obvious errors in technique or equipment setup. For instance, a simple oversight like incorrect zeroing or an improperly connected cable can significantly affect results.
Next, I’ll examine the calibration data itself, looking for patterns or anomalies that might point to underlying problems. If a particular instrument consistently shows errors within a specific range, it might suggest a problem with the instrument itself or a systematic error in the calibration process.
If the issue persists, I’ll investigate potential environmental factors, such as temperature, humidity, or vibrations. These can subtly influence measurement accuracy. If needed, more in-depth diagnostic procedures, or even contacting the manufacturer for support, might be necessary. My approach emphasizes careful documentation of every step, including troubleshooting measures and conclusions. A detailed record helps prevent recurrence of the issue.
Q 27. What quality management systems are you familiar with (e.g., ISO 9001, ISO 17025)?
I am thoroughly familiar with ISO 9001 and ISO 17025. ISO 9001 is a broad quality management standard, which establishes a framework for ensuring consistent quality in products and services. In the context of calibration, it emphasizes the importance of properly controlled procedures, documented processes, and ongoing monitoring of the calibration system’s effectiveness.
ISO 17025 is specifically focused on the competence of testing and calibration laboratories. It sets stringent requirements for the technical competence of personnel, traceability of measurements, and the quality of calibration results. Compliance with ISO 17025 is often a prerequisite for participation in interlaboratory comparison programs and for being recognized as a reliable calibration provider.
My experience encompasses not just understanding these standards but also actively implementing them in day-to-day calibration operations. This includes developing and maintaining calibration procedures, managing non-conformances, and ensuring compliance with all relevant requirements.
Q 28. Describe your experience with different types of measuring instruments.
My experience extends across a broad spectrum of measuring instruments. This includes:
- Dimensional Measurement Instruments: Micrometers, calipers, height gauges, optical comparators, and coordinate measuring machines (CMMs).
- Electrical Measurement Instruments: Multimeters, oscilloscopes, power meters, and LCR meters.
- Mass Measurement Instruments: Analytical balances, precision balances, and weight sets.
- Temperature Measurement Instruments: Thermocouples, RTDs, and infrared thermometers.
- Pressure Measurement Instruments: Pressure gauges, transducers, and manometers.
Beyond the instrument types, I am also skilled in using various calibration methods, including comparison calibration, substitution calibration, and in-situ calibration, ensuring the most appropriate method is selected for each instrument.
My practical experience allows me to select the appropriate calibration method and understand the limitations of each instrument, ensuring accurate measurements within the required tolerance.
Key Topics to Learn for Gage Calibration and Verification Interview
- Measurement Uncertainty: Understanding and calculating uncertainty in measurement results, including sources of error and their propagation.
- Calibration Standards and Traceability: Knowing the importance of traceable calibration standards to national or international standards and how this ensures accuracy.
- Calibration Methods and Techniques: Familiarity with various calibration methods (e.g., comparison, substitution) and their application to different types of gages.
- Gage R&R Studies (Repeatability and Reproducibility): Understanding how to perform and interpret Gage R&R studies to assess the variability in measurement systems.
- Calibration Intervals and Schedules: Determining appropriate calibration frequencies based on gage type, usage, and industry standards.
- Calibration Documentation and Reporting: Understanding the importance of accurate and complete calibration records and reports, including data analysis and interpretation.
- Statistical Process Control (SPC) Techniques: Applying SPC methods to monitor gage performance and identify potential issues.
- Common Gage Types and Applications: Demonstrating knowledge of various gage types (e.g., micrometers, calipers, dial indicators) and their specific applications.
- Troubleshooting Calibration Issues: Ability to identify and resolve common problems encountered during calibration processes.
- Regulatory Compliance: Awareness of relevant industry regulations and standards related to calibration and verification.
Next Steps
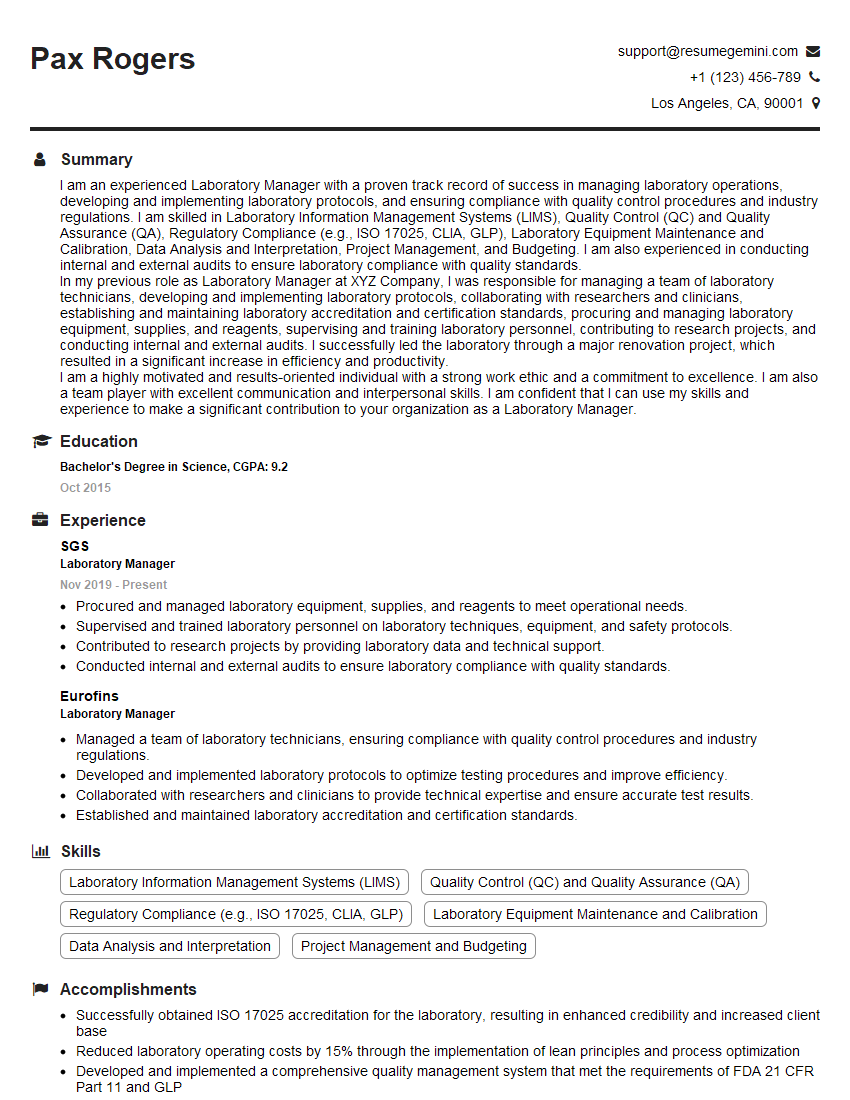
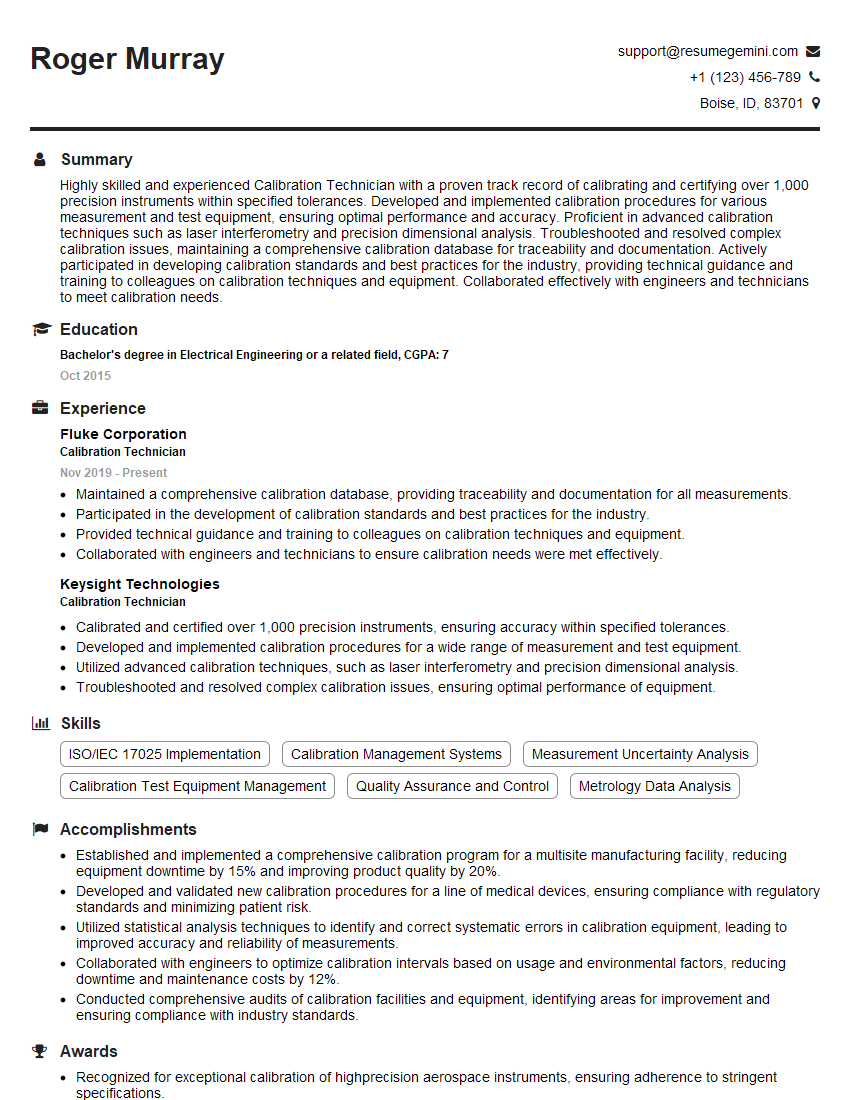
Mastering Gage Calibration and Verification opens doors to exciting career opportunities in quality control, manufacturing, and metrology, leading to increased responsibility and earning potential. To maximize your job prospects, creating a strong, ATS-friendly resume is crucial. ResumeGemini is a trusted resource to help you build a professional and impactful resume that highlights your skills and experience effectively. Examples of resumes tailored to Gage Calibration and Verification are available to guide you in crafting your perfect application. Invest the time to create a compelling resume – it’s your first impression with potential employers.
Explore more articles
Users Rating of Our Blogs
Share Your Experience
We value your feedback! Please rate our content and share your thoughts (optional).
What Readers Say About Our Blog
good
