The right preparation can turn an interview into an opportunity to showcase your expertise. This guide to Prototyping and Debugging interview questions is your ultimate resource, providing key insights and tips to help you ace your responses and stand out as a top candidate.
Questions Asked in Prototyping and Debugging Interview
Q 1. Explain the difference between rapid prototyping and iterative prototyping.
Rapid prototyping and iterative prototyping are both crucial in the design process, but they differ significantly in their approach and goals. Rapid prototyping focuses on quickly creating a basic representation of the final product to gather initial feedback and validate core concepts. Think of it as a first draft – speed and early feedback are paramount. Iterative prototyping, on the other hand, involves creating multiple prototypes, each refining the previous iteration based on user feedback and testing. It’s more like writing multiple drafts, continuously improving the product through a series of cycles.
Example: Imagine designing a mobile app. Rapid prototyping might involve creating a low-fidelity wireframe to test the overall user flow. Iterative prototyping would involve building several versions, starting with a simple wireframe, then moving to a higher-fidelity prototype with mockups, and finally to a functional prototype with limited features, each version improving based on user testing and feedback.
Q 2. Describe your experience with different prototyping methodologies (e.g., Agile, Waterfall).
My experience spans both Agile and Waterfall methodologies in prototyping. In Agile projects, prototyping is deeply integrated into the iterative development cycle. We use short sprints to build and test prototypes, allowing for continuous feedback and adaptation. This approach is particularly useful for complex projects where requirements might evolve over time. For instance, I’ve worked on a project where we used Agile, building a series of functional prototypes of a web application, incorporating user feedback after each sprint to ensure the final product met user needs. In contrast, Waterfall methodologies often involve a more upfront, detailed design phase before prototyping. This means a more comprehensive prototype is built early on, with less flexibility for changes later in the development process. I was involved in a project using this approach, where we meticulously planned and designed a prototype of a large-scale database system before starting development. The success of both approaches hinges on effective communication and collaboration.
Q 3. What are some common prototyping tools you have used?
I’m proficient in a variety of prototyping tools, catering to different needs and fidelity levels. For low-fidelity prototypes, I often use tools like Balsamiq, which allows for quick and easy wireframing. For higher-fidelity prototypes, I utilize Figma and Adobe XD, enabling the creation of interactive mockups that closely resemble the final product. For interactive prototypes involving code, I use tools like InVision and Axure RP. In cases where I need to test specific functionalities, I might also work directly with development code to build functional prototypes. The choice of tool depends heavily on the project’s specific requirements, the level of fidelity needed, and the overall team expertise.
Q 4. How do you choose the right prototyping method for a given project?
Selecting the appropriate prototyping method is crucial for project success. My decision-making process considers several key factors: the project’s complexity, the available time and resources, the level of fidelity required, and the target audience. For complex projects with uncertain requirements, iterative prototyping is preferred because it allows for flexibility and adaptation. If time is limited and a quick validation of core concepts is needed, rapid prototyping is a better choice. For projects aimed at gathering feedback from non-technical stakeholders, low-fidelity prototypes might suffice; however, high-fidelity prototypes might be necessary for testing complex interactions with technically proficient users. Essentially, it’s about finding the sweet spot between the required detail and the available time and resources.
Q 5. Explain your process for debugging a complex software issue.
Debugging a complex software issue is a systematic process. It begins with a clear understanding of the problem. I start by replicating the error consistently to rule out intermittent issues. Then, I carefully examine error logs and messages to pinpoint the source of the problem. This might involve using debugging tools to step through the code line by line, examining variable values and execution flow. I frequently utilize techniques like binary search to narrow down the area of the problem, breaking down the code into smaller, testable units to isolate the faulty component. Once the faulty code section is identified, I analyze the logic, searching for potential errors in algorithms, data structures, or interactions with external systems. The solution often involves refactoring the code, improving error handling, or enhancing logging for future debugging. The process is iterative and might involve numerous steps, but it’s crucial to maintain a systematic approach.
Q 6. What debugging tools and techniques are you familiar with?
My debugging toolkit is extensive and varies depending on the programming language and environment. I’m highly proficient in using debuggers like GDB (GNU Debugger) for C/C++ and the built-in debuggers in IDEs such as Visual Studio and IntelliJ IDEA for other languages. I utilize logging extensively, strategically placing logging statements to monitor variable values and program flow. I leverage various testing frameworks such as JUnit (Java) and pytest (Python) to perform unit and integration tests, often employing techniques such as Test-Driven Development (TDD) to prevent bugs in the first place. Furthermore, I’m adept at using profiling tools to identify performance bottlenecks and memory leaks.
Q 7. How do you approach debugging in a team environment?
Debugging in a team environment requires clear communication and collaboration. We typically use a version control system like Git to track changes and facilitate collaborative debugging. Effective communication is key. I use tools like shared debugging sessions and online collaborative coding environments. We often employ pair programming, where two developers work together on the same code, which can lead to quick identification and resolution of bugs. We meticulously document the debugging process, including steps taken, solutions implemented, and lessons learned. This approach ensures knowledge sharing and avoids repeating past mistakes. We strive to create a supportive environment where team members feel comfortable sharing insights and raising concerns. A culture of mutual respect and trust ensures efficient collaboration and successful bug resolution.
Q 8. Describe a time you had to debug a particularly challenging issue. What was your approach?
One particularly challenging debugging experience involved a seemingly random crash in a high-throughput data processing pipeline. The error manifested intermittently, making it difficult to reproduce consistently. My approach was systematic and involved several key steps:
Reproduce the issue: Although intermittent, I meticulously documented the conditions under which the crash seemed to occur (e.g., specific data volume, time of day). This helped isolate potential triggers.
Isolate the problem: I employed binary search techniques, progressively commenting out sections of code to pinpoint the source of the failure. This involved strategically using breakpoints in the debugger.
Examine logs and metrics: The application had comprehensive logging, and analyzing the logs around the crash time revealed a subtle pattern – a memory leak growing steadily until exceeding available resources. This pointed to a crucial piece of information.
Utilize debugging tools: Memory profiling tools revealed that a specific data structure was not properly deallocating memory after its usage. This was the root cause.
Implement solution and regression testing: I corrected the memory leak by explicitly releasing the memory resources. Extensive testing, including simulating high-throughput scenarios, verified the fix.
This process highlighted the importance of systematic debugging, careful log analysis, and effective utilization of debugging tools. The key was to break down the problem into smaller, manageable parts and to leverage available tools and data to pinpoint the root cause.
Q 9. What are some common sources of errors in software development?
Common sources of errors in software development are numerous, but some frequently encountered ones include:
Logical errors: These are flaws in the program’s logic, leading to incorrect results. For instance, an incorrectly implemented algorithm or a flawed conditional statement.
Syntax errors: These errors violate the programming language’s rules, preventing compilation or interpretation. A missing semicolon or an incorrect keyword is a classic example.
Runtime errors: These errors occur during program execution. Examples include attempting to access an invalid memory location (segmentation fault), division by zero, or an unexpected input leading to exception.
Resource leaks: Failure to properly release allocated resources (memory, file handles, network connections) can lead to instability or crashes. These are often harder to find due to their gradual build-up.
Concurrency issues: In multi-threaded or multi-process applications, race conditions, deadlocks, or other concurrency problems can create unpredictable behavior.
Integration problems: Problems can occur when different modules or components don’t interact correctly due to incompatible interfaces or assumptions about input/output.
Often, a single error can trigger a cascade of other issues, making comprehensive testing and careful code review paramount.
Q 10. How do you prioritize debugging tasks?
Prioritizing debugging tasks involves a combination of factors, including:
Impact: How severely does the bug affect the system or user experience? A critical bug crashing the application takes precedence over a minor visual glitch.
Frequency: How often does the bug occur? A bug affecting many users needs addressing faster than a rare, isolated one.
Ease of fix: Some bugs are easily resolved while others require significant effort. Balancing impact and effort is essential. Sometimes it’s better to address several small issues that can be solved quickly before tackling a larger, more complex one.
Dependencies: Does fixing this bug impact other areas of the system or block other development tasks? Prioritize bugs that unblock other work.
I often use a triage process, categorizing bugs based on these factors, and use a bug tracking system to manage and track the progress of bug resolution. This ensures a focused and efficient debugging process.
Q 11. How do you use logging and tracing effectively for debugging?
Logging and tracing are invaluable debugging tools. Effective usage involves:
Strategic placement: Logs should be placed at critical points in the code, such as function entry/exit, before/after key operations, and around potential error points.
Informative messages: Log messages should contain relevant information, including timestamps, function names, input values, and output values. Avoid overly generic messages.
Different log levels: Use different log levels (e.g., DEBUG, INFO, WARNING, ERROR) to filter log output based on severity and debugging needs. During development, DEBUG level logging can provide very detailed information; in production, you’ll primarily rely on WARNING and ERROR levels.
Structured logging: Log data in a structured format (e.g., JSON) for easier parsing and analysis with tools. This allows for effective automated search and filtering.
Tracing: For complex scenarios, tracing provides a chronological record of execution flow, including function calls and parameters. This is exceptionally useful for identifying the sequence of events that led to a problem.
For example, if a function fails to process an incoming request, logging the request details (e.g., INFO: Processing request with ID: 123, data: { ... }), the function’s input variables, and the exact point of failure (e.g., ERROR: Failed to parse data: Invalid format) is much more helpful than simply logging ‘Processing failed’.
Q 12. What is the difference between unit testing, integration testing and system testing and how do they aid debugging?
These three testing types play crucial roles in debugging:
Unit testing: Tests individual components or modules in isolation. This helps identify bugs early in the development cycle, making them easier to fix. Unit tests isolate a piece of code and verify its behavior against expected outputs. Example: testing a single function that calculates the area of a rectangle.
Integration testing: Tests how multiple modules or components work together. It focuses on identifying issues at the interfaces between modules, such as communication protocols or data formats. Example: Testing the interaction of the rectangle area calculation function with a function that retrieves rectangle dimensions from a database.
System testing: Tests the entire system as a whole. This is a high-level test that checks if the system meets its requirements and performs as expected under realistic conditions. Example: testing the complete application, which uses many modules, including the rectangle area calculation function, to verify if the final output is correct and meets all functional requirements.
By systematically applying these levels of testing, you can quickly isolate the source of errors, whether it’s a flaw in a single module (unit testing), an interaction problem (integration testing), or a larger system-level issue (system testing). A robust testing strategy significantly reduces debugging time and effort.
Q 13. Explain the concept of ‘rubber duck debugging’.
Rubber duck debugging is a simple yet effective debugging technique. It involves explaining your code line by line to an inanimate object, such as a rubber duck. The act of verbalizing your thought process while meticulously walking through the code often reveals errors or inconsistencies in your logic.
The reason it works is that the process forces you to slow down, articulate your assumptions, and carefully examine every step. This can uncover subtle mistakes that might be missed when simply staring at the code.
It’s not about the duck understanding the code, but about the mental discipline involved in explaining the problem to someone (or something).
Q 14. How do you handle debugging in a real-time system?
Debugging in real-time systems presents unique challenges because downtime is often unacceptable, and debugging tools can’t always be easily applied. Effective strategies include:
Non-intrusive monitoring: Implement comprehensive monitoring tools that capture system performance and error logs without interfering with real-time operations. This might involve metrics dashboards or specialized monitoring systems. This enables you to understand system health without disrupting the flow.
Remote logging and analysis: Collect logs remotely for analysis, enabling diagnosis of issues without interrupting the system. Tools enabling remote debugging are very useful here.
Minimal impact debugging: Use debugging techniques that minimize the impact on the running system. This might involve selectively enabling logging or tracing only when necessary, or using sampling techniques to monitor system behavior without overheads.
Fail-safe mechanisms: Design fail-safe mechanisms to prevent catastrophic failures and to gracefully degrade service in case of errors. These enable the system to continue operating even if a component fails.
Canary deployments and A/B testing: Introduce changes incrementally to minimize risk. Deploy the changes to a subset of the user base, monitor the impact, and roll back quickly if a problem is identified.
Real-time systems often benefit from proactive debugging strategies, such as rigorous testing and simulation before deploying to production. Careful design choices focused on fault tolerance are also very important.
Q 15. Describe your experience with memory leaks and how you’ve addressed them.
Memory leaks occur when a program allocates memory but fails to release it when it’s no longer needed. Over time, this leads to increasing memory consumption, potentially crashing the application or slowing it down significantly. Imagine a restaurant where plates are constantly brought out but never washed and returned – eventually, you run out of clean plates!
I’ve addressed memory leaks using a variety of techniques. One common method is using memory debuggers like Valgrind (for C/C++) or similar tools for other languages. These tools help pinpoint the exact location in the code where memory is being improperly allocated or deallocated. For example, Valgrind will identify memory blocks that are allocated but never freed. Another strategy involves careful code review, paying close attention to allocation and deallocation functions (like malloc and free in C, or new and delete in C++). Implementing robust exception handling is also crucial to ensure that resources are properly cleaned up even when unexpected errors occur. For instance, using RAII (Resource Acquisition Is Initialization) in C++ ensures automatic resource deallocation when objects go out of scope. Finally, the use of smart pointers in C++ (unique_ptr, shared_ptr) automatically manages memory, drastically reducing the chance of leaks.
In one project, I found a memory leak in a server application using Valgrind. It revealed that a dynamically allocated buffer wasn’t being freed after processing each client request. By modifying the code to explicitly free the buffer using free() after its use, I completely resolved the memory leak and improved application stability.
Career Expert Tips:
- Ace those interviews! Prepare effectively by reviewing the Top 50 Most Common Interview Questions on ResumeGemini.
- Navigate your job search with confidence! Explore a wide range of Career Tips on ResumeGemini. Learn about common challenges and recommendations to overcome them.
- Craft the perfect resume! Master the Art of Resume Writing with ResumeGemini’s guide. Showcase your unique qualifications and achievements effectively.
- Don’t miss out on holiday savings! Build your dream resume with ResumeGemini’s ATS optimized templates.
Q 16. How do you identify and resolve race conditions?
Race conditions happen when multiple threads or processes access and manipulate shared resources concurrently, leading to unpredictable and often incorrect results. Think of two people trying to write in the same notebook simultaneously – the final result will be a confusing mess!
Identifying race conditions requires careful examination of concurrent code sections. I typically employ several strategies. First, I use debugging tools that can help visualize thread execution and identify potential conflicts. Second, I employ logging mechanisms to carefully track the sequence of events. Third, I often use techniques like thread synchronization primitives, such as mutexes (mutual exclusion locks) or semaphores, to control access to shared resources. Mutexes ensure that only one thread can access a shared resource at a time, while semaphores provide a more general mechanism for managing access to resources with a limited number of permits.
For example, if a race condition occurs in updating a shared counter, implementing a mutex around the increment/decrement operation will prevent concurrent modifications and ensure data integrity. The code might look like this (pseudocode):
mutex counterMutex;

function incrementCounter() {
  acquire(counterMutex);
  counter++;
  release(counterMutex);
}
In a past project, a race condition was causing inconsistent data in a database due to concurrent updates from multiple threads. By introducing mutexes to protect the database access sections, I eliminated the race condition and restored data consistency.
Q 17. What is your experience with code profiling and performance analysis?
Code profiling and performance analysis are essential for identifying bottlenecks and optimizing code efficiency. It’s like having a performance report card for your code, revealing what areas need improvement.
My experience involves using various profiling tools such as gprof (for C/C++), or built-in profilers provided by IDEs like Visual Studio or profiling tools for languages like Java or Python. These tools help identify functions or code sections that consume the most time or resources. I also frequently analyze memory usage patterns to find excessive memory allocations or inefficient data structures. The output of these tools often reveals performance hotspots – functions or code blocks where the execution time is disproportionately high. Once identified, you can focus your optimization efforts there, leading to the most significant performance gains.
For example, I used gprof to analyze a slow-running algorithm. The profiler pointed out a specific nested loop as the primary culprit. By optimizing this loop through algorithm modifications and data structure improvements, I achieved a significant performance boost.
Q 18. What strategies do you use to prevent bugs from occurring in the first place?
Preventing bugs is far more efficient than fixing them later! My approach relies on several key strategies. First, I strongly advocate for writing clean, well-documented, and modular code. This improves readability and maintainability, making it easier to spot potential problems early on. Second, I use static analysis tools to identify potential issues like coding style violations or potential bugs before they even get compiled. These tools act as a second pair of eyes, checking for things that might easily be missed during manual code review. Third, thorough unit testing is non-negotiable. Comprehensive test suites ensure that each component works as expected under different conditions. Finally, code reviews are invaluable for catching bugs and improving code quality. A fresh set of eyes can often identify flaws missed by the original author.
For example, consistent use of static analysis tools in a past project significantly reduced the number of runtime errors encountered during testing. The early detection of potential issues saved considerable time and effort compared to resolving them later in the development cycle.
Q 19. How do you determine the root cause of a bug?
Finding the root cause of a bug can be like detective work! My approach is systematic and follows a few key steps. I start by carefully reproducing the bug. Once I can consistently reproduce it, I can start narrowing down the cause. This usually involves inspecting the program’s state at the point of failure using debuggers, logging, or other diagnostic tools. I then examine the code surrounding the failure point, looking for clues. This process might involve tracing execution flow, checking variable values, inspecting memory, and examining stack traces to understand the sequence of events leading to the bug. This often leads to a deeper understanding of the issue.
In one instance, a seemingly random crash turned out to be caused by an off-by-one error in an array index. By systematically stepping through the code using a debugger, inspecting array bounds, and examining memory contents, I quickly pinpointed the location of the error.
Q 20. Explain your understanding of version control and how it aids in debugging.
Version control systems like Git are invaluable for debugging and managing code evolution. They’re like a history book for your code, keeping track of all changes made over time. This allows you to easily revert to previous versions if you accidentally introduce bugs. It also simplifies collaborative development because different developers can work on the same codebase simultaneously without overwriting each other’s changes. Moreover, comparing different versions helps pinpoint when a bug was introduced.
If I encounter a bug in the current version of the code, I can use version control to compare it to earlier versions and trace the bug back to its origin. Once the problematic commit is identified, it’s much easier to understand the change that introduced the bug and fix it.
Q 21. How do you manage multiple debugging efforts concurrently?
Managing multiple debugging efforts concurrently requires organization and prioritization. I typically employ a ticketing system or project management tool to track each bug separately. This provides a central location for storing details such as the bug report, reproduction steps, current status, assigned developer, and priority level. Furthermore, I prioritize bugs based on their severity and impact. Critical bugs that affect system stability or core functionality are tackled first, while less severe bugs might be addressed later. It’s also important to avoid context switching excessively, as this can reduce overall productivity and increase the risk of introducing new errors.
In a previous project, we had several simultaneous debugging efforts. We used Jira to manage the different bug reports, which allowed us to track progress, assign tasks, and prioritize work effectively. This helped to prevent confusion and ensured that we focused our efforts on resolving the most critical issues first.
Q 22. How familiar are you with different debugging environments (e.g., IDE debuggers, command-line debuggers)?
I’m highly proficient with various debugging environments. My experience spans from powerful Integrated Development Environments (IDEs) like Visual Studio, IntelliJ IDEA, and Eclipse, which offer sophisticated debugging features such as breakpoints, stepping through code, variable inspection, and call stack analysis, to command-line debuggers like GDB (GNU Debugger) which are indispensable when working with lower-level languages or embedded systems. Each environment has its strengths. IDE debuggers offer a user-friendly graphical interface, making them ideal for rapid debugging and complex projects. Command-line debuggers, on the other hand, offer more granular control and are essential in situations where a graphical interface isn’t available or desirable. I can seamlessly adapt my debugging approach based on the project’s needs and the available tools.
For example, during a recent project involving a C++ application for a resource-constrained embedded system, I relied heavily on GDB for its ability to precisely control execution and memory inspection. Conversely, when developing a large Java application, I utilized IntelliJ IDEA’s debugger to efficiently navigate and troubleshoot issues across multiple classes and threads.
Q 23. Describe your experience with using a debugger to step through code.
Stepping through code using a debugger is a fundamental skill in my workflow. I use it to trace program execution line by line, inspect variable values at each step, and identify the precise location of errors. I regularly employ techniques like setting breakpoints (pause execution at specific lines), stepping over (execute the next line without entering functions), stepping into (execute the next line, entering functions), and stepping out (return from the current function). I also make extensive use of watchpoints, which halt execution when a specific variable changes value. This allows me to pinpoint the exact moment a problem arises, rather than just observing the final result.
For instance, if I suspect a problem with a calculation within a loop, I’d set a breakpoint at the beginning of the loop, then use ‘step into’ to observe each iteration and check the intermediate values of variables involved in the calculation. The ability to meticulously analyze program flow allows me to quickly identify the source of the error.
// Example: A simple loop with a potential error int sum = 0; for (int i = 0; i <= 10; i++){ sum += i; // Potential error here - should be i + 1 //Breakpoint here! }Q 24. How do you handle debugging legacy code?
Debugging legacy code presents unique challenges, often requiring a combination of techniques and patience. A systematic approach is key. I start by thoroughly reviewing the existing documentation (if any!), understanding the code's structure and intended functionality. Then, I carefully add logging statements to strategically monitor variables and program flow, gaining insight into the code's behavior without the need for intrusive breakpoints. Furthermore, I leverage the debugger's ability to analyze the call stack to trace execution paths and identify problematic functions. Unit testing, where feasible, is crucial to isolate sections of the codebase, identify issues, and subsequently develop fixes.
Refactoring is an essential part of handling legacy code. While potentially time-consuming, refactoring in small, manageable steps, paired with comprehensive testing, can significantly improve code readability and maintainability, making future debugging efforts far less painful. In cases of deeply intertwined, poorly documented code, I'll often prioritize creating test cases and then incrementally updating the code whilst ensuring test coverage is maintained.
Q 25. What is your preferred method for documenting bugs and fixes?
My preferred method for documenting bugs and fixes utilizes a clear and concise bug tracking system. Each bug report includes a detailed description of the issue, including steps to reproduce, expected behavior, and actual behavior. I also include screenshots or screen recordings when helpful. Crucially, the bug report documents the fix applied, including the specific code changes, and notes any related changes to testing or documentation. The system I use tracks progress and provides a clear audit trail for every bug reported and resolved. This methodical documentation is crucial for future maintenance and troubleshooting.
For example, in a ticket system, I'd use a template to create a consistent format. Fields include summary (brief description), description (detailed steps to reproduce), severity, priority, assigned developer, status, resolution steps and testing result. This allows for efficient tracking and communication across teams.
Q 26. Describe your experience with automated debugging tools.
I have extensive experience using automated debugging tools, such as static code analyzers (e.g., SonarQube, FindBugs) and dynamic analysis tools (e.g., Valgrind, AddressSanitizer). Static analyzers examine the code without executing it, identifying potential issues like null pointer dereferences, memory leaks, and style violations. Dynamic analyzers, on the other hand, observe the program during execution, detecting runtime errors such as memory corruption and race conditions. These tools are invaluable for identifying potential issues early in the development process, saving considerable time and effort later on.
For instance, using a static analyzer before a code review can highlight potential pitfalls that might have been missed during manual inspection. I have found dynamic analysis tools especially useful when debugging complex memory-related errors in C/C++ applications, where even experienced developers can sometimes struggle to identify the root cause.
Q 27. How do you balance the speed of prototyping with the need for robust code?
Balancing prototyping speed with robust code is a crucial aspect of software development. It's a delicate balance that requires strategic planning and efficient techniques. The key is to understand that the initial prototype does not need to be perfectly polished. Instead, it should focus on validating core concepts and functionality. I prioritize a 'Minimum Viable Product' (MVP) approach, implementing only essential features initially. This allows for rapid iteration and feedback gathering. Once the core functionality is validated, I can then refactor the codebase to improve its structure, robustness, and maintainability.
For instance, in a recent mobile app prototype, I initially used placeholder UI elements and simplified backend logic to quickly demonstrate the core user flow. After receiving feedback and validating the app's concept, I proceeded to refine the UI/UX and implement more robust error handling and security measures.
Q 28. Explain your approach to testing prototypes.
My approach to testing prototypes is iterative and focused on providing quick feedback. I employ a combination of techniques. Unit testing is used for testing individual components to verify their correctness in isolation. Integration testing ensures different parts of the prototype work together seamlessly. User acceptance testing (UAT) involves actual users testing the prototype to gauge usability and identify functional issues. I use automated testing where possible, which significantly reduces testing time and increases efficiency. Automated tests are particularly important when dealing with frequent code changes in the iterative development of prototypes.
For example, during a website prototype development, I'd write unit tests for individual modules (e.g., form validation), then integration tests to ensure the forms interact correctly with the backend, followed by UAT sessions with potential users to ensure that the website is both intuitive and functional from their perspective. This iterative testing approach helps identify and address problems early in the development cycle.
Key Topics to Learn for Prototyping and Debugging Interviews
- Prototyping Methodologies: Understanding various prototyping approaches (low-fidelity, high-fidelity, iterative prototyping), their strengths, weaknesses, and appropriate contexts. Consider exploring different tools and techniques used in each methodology.
- Debugging Techniques: Mastering debugging strategies like print statements, debuggers (e.g., gdb, pdb), logging frameworks, and understanding common debugging tools within your chosen programming language(s).
- Software Development Lifecycle (SDLC): Knowing how prototyping and debugging fit within the broader context of the SDLC (e.g., Agile, Waterfall) will demonstrate a holistic understanding of the development process.
- Version Control (Git): Demonstrate proficiency in using Git for managing code changes, collaborating with teams, and resolving merge conflicts. This is crucial for effective prototyping and debugging in team environments.
- Testing Strategies: Understanding different testing methodologies (unit testing, integration testing, system testing) and their importance in identifying and resolving bugs early in the development process.
- Problem-Solving & Analytical Skills: Highlight your ability to approach complex problems systematically, break them down into smaller manageable parts, and use logical reasoning to identify and solve issues efficiently. Practice articulating your thought process clearly.
- Common Errors and their Solutions: Familiarize yourself with common errors encountered during prototyping and debugging in your chosen programming language(s) and how to effectively troubleshoot and solve them.
- Code Optimization and Performance: Demonstrate your knowledge of optimizing code for performance, memory usage, and efficiency. This is highly valued in practical software development.
Next Steps
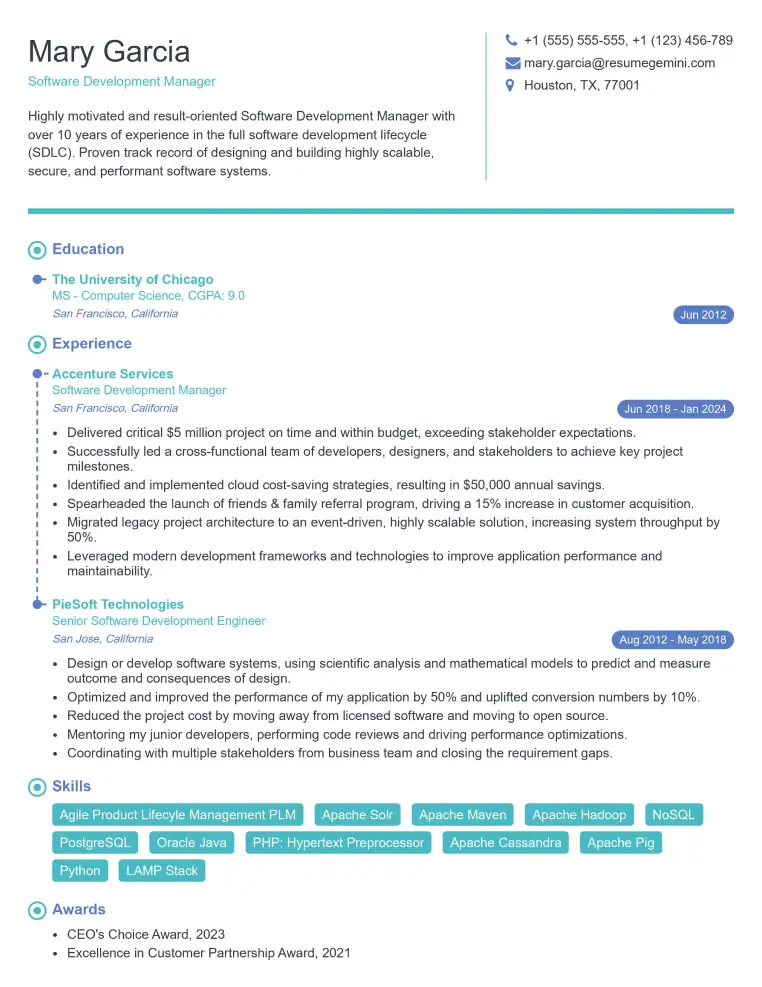
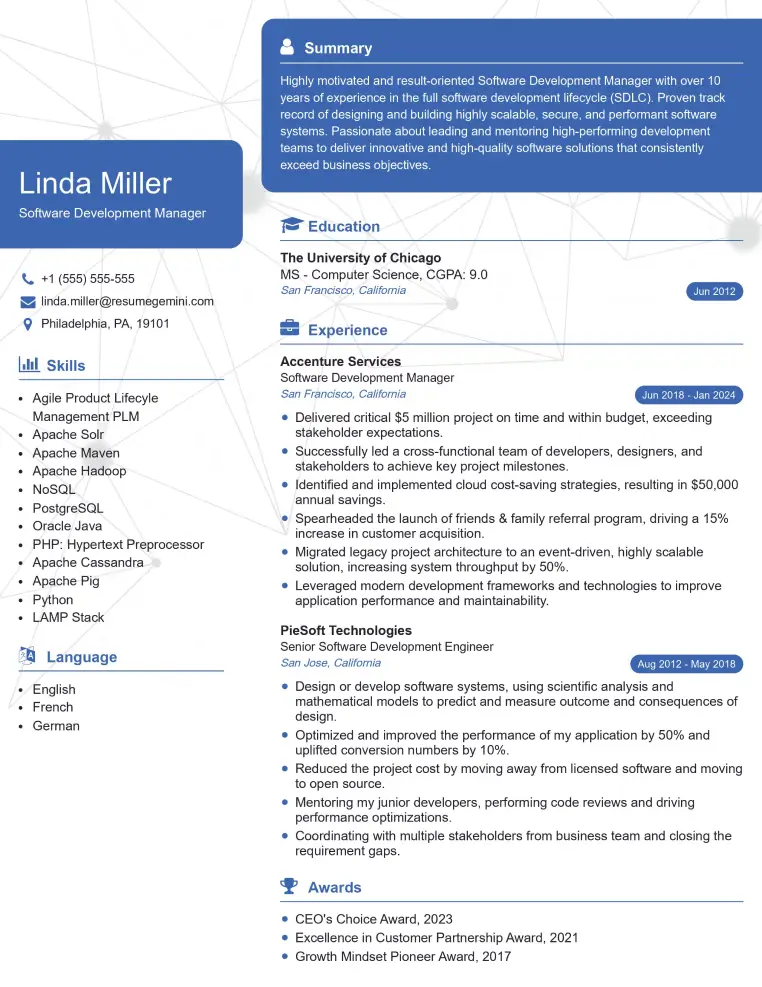
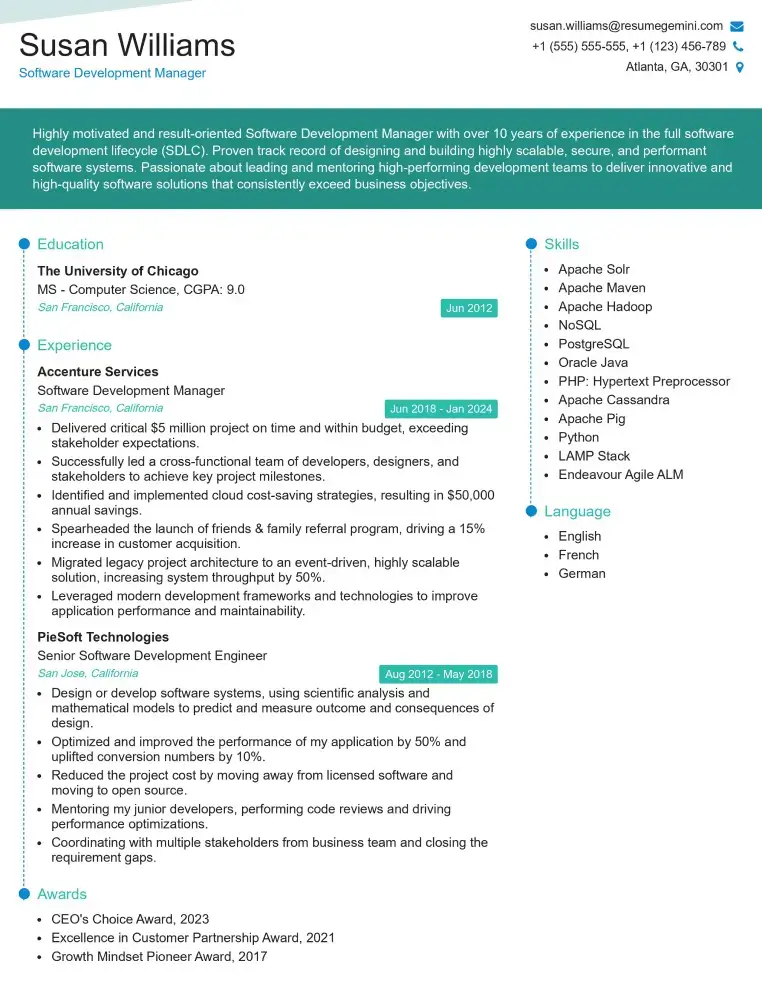
Mastering prototyping and debugging skills significantly enhances your value as a developer, opening doors to more challenging and rewarding roles. A strong foundation in these areas demonstrates a crucial blend of theoretical knowledge and practical application. To significantly boost your job prospects, invest time in crafting an ATS-friendly resume that effectively showcases your abilities. ResumeGemini is a trusted resource that can help you build a professional and impactful resume tailored to the specific requirements of the job market. Examples of resumes tailored to Prototyping and Debugging roles are available to guide you.
Explore more articles
Users Rating of Our Blogs
Share Your Experience
We value your feedback! Please rate our content and share your thoughts (optional).
What Readers Say About Our Blog
Hello,
we currently offer a complimentary backlink and URL indexing test for search engine optimization professionals.
You can get complimentary indexing credits to test how link discovery works in practice.
No credit card is required and there is no recurring fee.
You can find details here:
https://wikipedia-backlinks.com/indexing/
Regards
NICE RESPONSE TO Q & A
hi
The aim of this message is regarding an unclaimed deposit of a deceased nationale that bears the same name as you. You are not relate to him as there are millions of people answering the names across around the world. But i will use my position to influence the release of the deposit to you for our mutual benefit.
Respond for full details and how to claim the deposit. This is 100% risk free. Send hello to my email id: [email protected]
Luka Chachibaialuka
Hey interviewgemini.com, just wanted to follow up on my last email.
We just launched Call the Monster, an parenting app that lets you summon friendly ‘monsters’ kids actually listen to.
We’re also running a giveaway for everyone who downloads the app. Since it’s brand new, there aren’t many users yet, which means you’ve got a much better chance of winning some great prizes.
You can check it out here: https://bit.ly/callamonsterapp
Or follow us on Instagram: https://www.instagram.com/callamonsterapp
Thanks,
Ryan
CEO – Call the Monster App
Hey interviewgemini.com, I saw your website and love your approach.
I just want this to look like spam email, but want to share something important to you. We just launched Call the Monster, a parenting app that lets you summon friendly ‘monsters’ kids actually listen to.
Parents are loving it for calming chaos before bedtime. Thought you might want to try it: https://bit.ly/callamonsterapp or just follow our fun monster lore on Instagram: https://www.instagram.com/callamonsterapp
Thanks,
Ryan
CEO – Call A Monster APP
To the interviewgemini.com Owner.
Dear interviewgemini.com Webmaster!
Hi interviewgemini.com Webmaster!
Dear interviewgemini.com Webmaster!
excellent
Hello,
We found issues with your domain’s email setup that may be sending your messages to spam or blocking them completely. InboxShield Mini shows you how to fix it in minutes — no tech skills required.
Scan your domain now for details: https://inboxshield-mini.com/
— Adam @ InboxShield Mini
Reply STOP to unsubscribe
Hi, are you owner of interviewgemini.com? What if I told you I could help you find extra time in your schedule, reconnect with leads you didn’t even realize you missed, and bring in more “I want to work with you” conversations, without increasing your ad spend or hiring a full-time employee?
All with a flexible, budget-friendly service that could easily pay for itself. Sounds good?
Would it be nice to jump on a quick 10-minute call so I can show you exactly how we make this work?
Best,
Hapei
Marketing Director
Hey, I know you’re the owner of interviewgemini.com. I’ll be quick.
Fundraising for your business is tough and time-consuming. We make it easier by guaranteeing two private investor meetings each month, for six months. No demos, no pitch events – just direct introductions to active investors matched to your startup.
If youR17;re raising, this could help you build real momentum. Want me to send more info?
Hi, I represent an SEO company that specialises in getting you AI citations and higher rankings on Google. I’d like to offer you a 100% free SEO audit for your website. Would you be interested?
Hi, I represent an SEO company that specialises in getting you AI citations and higher rankings on Google. I’d like to offer you a 100% free SEO audit for your website. Would you be interested?
good
