Feeling uncertain about what to expect in your upcoming interview? We’ve got you covered! This blog highlights the most important Value Stream Mapping Software (e.g., Minitab, SigmaXL) interview questions and provides actionable advice to help you stand out as the ideal candidate. Let’s pave the way for your success.
Questions Asked in Value Stream Mapping Software (e.g., Minitab, SigmaXL) Interview
Q 1. Describe your experience using Minitab or SigmaXL for Value Stream Mapping.
My experience with Minitab and SigmaXL for Value Stream Mapping (VSM) is extensive. I’ve utilized both software packages across diverse industries, from automotive manufacturing to healthcare services, to create, analyze, and simulate VSMs. Minitab excels in its statistical capabilities, particularly helpful in analyzing cycle times and identifying bottlenecks. Its charting tools are also invaluable for visually representing data within the map. SigmaXL, while perhaps less feature-rich in VSM-specific functions, offers a strong integration with other statistical analysis tools, proving beneficial when examining data related to defects and process variation. For example, I used Minitab’s capability analysis tools to analyze process variation in a bottling plant, feeding that data directly into the VSM to better understand the impact of that variation on lead times. In another project, I used SigmaXL’s control charts to monitor the post-implementation performance of improvements suggested by the VSM, ensuring the changes were sustainable.
Q 2. How do you identify waste in a value stream map?
Identifying waste in a VSM involves a systematic approach, combining visual inspection with data analysis. I typically begin by carefully reviewing each step in the process, looking for visual cues and then validating them with data. For instance, excessively large inventories might signal waste in the form of excess inventory (Muda). Long processing times at a particular step may indicate wasted time or inefficient processes. We also look for transportation delays, waiting periods, unnecessary movement of materials, overproduction beyond demand, over-processing (unnecessary steps), defects leading to rework, and underutilized talent (employees waiting for work). The key is to not just identify the waste visually, but to back it up with data – cycle times, defect rates, inventory levels, etc. This provides a more objective and data-driven understanding of the extent of the waste.
Q 3. Explain the different types of waste (Muda) in Lean manufacturing.
The seven types of waste (Muda) in Lean manufacturing, often remembered with the acronym TIMWOOD, are:
- Transportation (muda): Unnecessary movement of materials or products.
- Inventory (muda): Excess stock tying up capital and space.
- Motion (muda): Unnecessary movements of people.
- Waiting (muda): Idle time due to delays or bottlenecks.
- Overproduction (muda): Producing more than needed.
- Over-processing (muda): Performing more work than necessary.
- Defects (muda): Errors requiring rework or scrap.
Often, an eighth type of waste, Non-Utilized Talent (muda), is included, referring to the underutilization of employees’ skills and knowledge. Identifying these types of waste is crucial for improving efficiency and reducing costs. For example, in a bakery, waiting time for ovens could be reduced by better scheduling, reducing ‘Waiting’ waste. Overproduction of bread leading to spoilage represents ‘Overproduction’ waste.
Q 4. What are the key metrics you track during a Value Stream Mapping exercise?
Key metrics tracked during a VSM exercise vary based on the specific process being mapped, but generally include:
- Lead Time: Total time from order placement to delivery.
- Cycle Time: Time it takes to complete one unit of work.
- Value-Added Time: Portion of lead time spent directly adding value to the product/service.
- Non-Value-Added Time: Time spent on activities that don’t add value.
- Inventory Levels: Amount of work-in-progress and finished goods.
- Defect Rate: Percentage of defective units.
- Throughput: Rate of production or output.
- Utilization: Percentage of time a resource is actively working.
These metrics provide a quantitative understanding of the process’s efficiency and help to pinpoint areas for improvement. For example, a high lead time with low value-added time indicates significant waste.
Q 5. How do you prioritize improvement opportunities identified in a VSM?
Prioritizing improvement opportunities identified in a VSM often involves a multi-faceted approach. I typically use a combination of methods:
- Impact/Effort Matrix: Plotting improvements based on their potential impact on lead time or cost reduction against the effort required to implement them. High-impact, low-effort opportunities are prioritized.
- Pareto Analysis: Focusing on the ‘vital few’ improvements that address the majority of the waste. This involves identifying the top 20% of opportunities responsible for 80% of the waste.
- Value Stream Mapping software features: Several VSM software packages offer built-in tools to assess the impact of different improvement options on key metrics (e.g., simulation tools in Minitab). This allows for a quantitative comparison.
For example, if reducing waiting time at a bottleneck has high impact and low effort, that becomes a top priority. If resolving a small number of defects yields significant improvements, that is addressed before tackling less impactful, more labor intensive improvements.
Q 6. Explain the difference between a current state and future state Value Stream Map.
The current state VSM depicts the process as it currently exists, providing a snapshot of the existing workflow, including all wastes and inefficiencies. It’s a factual representation based on observed data and measurements. In contrast, the future state VSM illustrates the ideal or improved state of the process, showcasing proposed changes and their anticipated effects. This map is based on ‘what-if’ scenarios and incorporates potential solutions to improve flow and reduce waste. The difference between the two maps is critical as it visually demonstrates the planned improvements and their predicted impact on lead time, inventory, and other key metrics. For instance, a current state map of an order fulfillment process might show a significant inventory build-up, while the future state map would demonstrate how implementing Kanban might reduce the inventory while improving flow.
Q 7. How do you handle data inconsistencies during VSM creation?
Data inconsistencies during VSM creation are a common challenge. My approach involves:
- Data Triangulation: Gathering data from multiple sources (e.g., interviews, observations, historical records) to cross-validate the information and identify discrepancies.
- Root Cause Analysis: Investigating the underlying reasons for inconsistencies. This could involve exploring differences in data collection methods, reporting practices, or potential biases.
- Data Cleaning and Reconciliation: Identifying and correcting errors, outliers, and inconsistencies to ensure data accuracy. This might involve using statistical techniques to smooth out noisy data or identifying and addressing data entry errors.
- Assumptions and Caveats: Clearly documenting assumptions made during data collection and analysis, as well as highlighting any remaining uncertainties or limitations in the data.
For example, if data from different departments show conflicting cycle times for the same process, I’d investigate the reasons, possibly finding different methods of measuring or data reporting leading to the discrepancies, and adjust the data accordingly.
Q 8. Describe your experience with different VSM symbols and notations.
Value Stream Mapping (VSM) utilizes a standard set of symbols to visually represent the flow of materials and information within a process. Understanding these symbols is crucial for creating effective and easily interpretable maps. Common symbols include:
- Process Boxes: Represent a specific step or process in the value stream. These are usually rectangular shapes and contain a brief description of the process.
- Data Boxes: Provide key metrics associated with a process step, such as lead time, cycle time, and inventory levels. These are often square or rectangular shapes.
- Inventory Symbols: Depict the storage of materials or work-in-progress (WIP). Triangles or other shapes are used to represent different types of inventory.
- Transportation Symbols: Show the movement of materials between process steps, often represented by arrows. Different arrow types might indicate different transportation methods (e.g., conveyor belt vs. forklift).
- Customer/Supplier Symbols: Represent the beginning and end of the value stream, often indicated by a cloud or oval shape.
In my experience, mastering these symbols allows for creating clear, concise VSMs that effectively communicate the flow of value (and lack thereof) within a process. For instance, I once used a combination of process boxes and data boxes to clearly highlight a bottleneck in a manufacturing process that resulted in significant lead time increases. The visual representation, employing standardized symbols, helped stakeholders understand the issue instantly.
Q 9. How do you present VSM findings to stakeholders?
Presenting VSM findings effectively requires a clear understanding of the audience. For executive stakeholders, the focus should be on high-level findings – key bottlenecks, overall lead time, and potential areas for significant improvement. A summary slide with key metrics and a high-level VSM is ideal. For operational stakeholders, a more detailed walkthrough of the VSM is necessary, highlighting specific areas for improvement and potential solutions.
My approach generally involves:
- Interactive Presentation: I don’t just present a static VSM; I walk the stakeholders through the map, explaining each step and highlighting key metrics.
- Data Visualization: Using charts and graphs, I showcase data that supports the findings within the VSM, such as lead time reduction opportunities.
- Storytelling: I frame the VSM as a story, highlighting the flow of materials and information, and using this to pinpoint areas of improvement and inefficiency.
- Actionable Recommendations: The presentation isn’t just about identifying problems; it’s about providing actionable solutions. I present a prioritized list of improvement initiatives with potential ROI.
For example, in a recent project, I used a before-and-after VSM to demonstrate the impact of implementing a Kaizen event. The visual comparison was incredibly compelling and helped secure buy-in for future improvement initiatives.
Q 10. Explain the concept of takt time and its role in VSM.
Takt time is the pace at which a company must produce to meet customer demand. It’s calculated by dividing the available production time by the customer demand. For example:
Available production time (e.g., 8 hours/day * 60 minutes/hour = 480 minutes) / Customer demand (e.g., 120 units/day) = 4 minutes/unit
This means the company needs to produce one unit every 4 minutes to meet customer demand. In VSM, takt time is a crucial benchmark. It establishes the rhythm for the entire value stream. If individual processes within the value stream are slower than the takt time, it leads to bottlenecks and excess inventory. Conversely, if processes are faster, resources are underutilized. During a recent project mapping an assembly line, using the calculated takt time as a standard quickly identified process steps that needed optimization to prevent bottlenecks and improve overall efficiency. Aligning the process flow to the takt time ensures smooth production and prevents overproduction or shortages.
Q 11. How do you use VSM to calculate lead time and cycle time?
Lead time and cycle time are critical metrics within a VSM. Lead time is the total time it takes for a product to move through the entire value stream, from order placement to delivery. Cycle time, on the other hand, refers to the time it takes to complete a single process step. VSM helps calculate these metrics by summing up the individual process times within the value stream map.
Calculating Lead Time: The lead time is simply the sum of all process times, transportation times, queue times, and wait times along the value stream. Visualizing these times on the VSM clearly identifies the major contributors to overall lead time.
Calculating Cycle Time: For each process step, you assess the time it takes to complete one unit. This includes the actual processing time and any wait time during the step. By analyzing each step’s cycle time, potential bottlenecks become obvious.
For instance, in a recent project involving a software development process, the VSM clearly showed that long lead times were primarily due to significant waiting times between development phases. By visualizing these delays, we identified specific areas for process improvement leading to a significant reduction in the overall lead time.
Q 12. What are the limitations of Value Stream Mapping?
While VSM is a powerful tool, it has limitations.
- Data Accuracy: VSM relies heavily on accurate data collection. Inaccurate or incomplete data leads to an unreliable map and flawed conclusions. This requires careful planning and execution of the data collection process.
- Simplification: VSM simplifies complex processes, which might overlook intricate details or hidden variability. For instance, a simple process box may hide underlying complexities within a process step.
- Time and Resource Intensive: Developing a detailed and accurate VSM can be time-consuming and require significant resources. This involves coordinating with multiple stakeholders and conducting thorough data collection.
- Limited Predictive Capability: While VSM reveals current-state processes, it does not inherently predict future performance or the impact of proposed improvements without additional analysis.
Despite these limitations, the value of VSM in identifying major process inefficiencies far outweighs the challenges.
Q 13. How do you ensure the accuracy of data used in VSM?
Ensuring data accuracy is paramount in VSM. My approach involves:
- Multiple Data Sources: I collect data from multiple sources to cross-validate information and reduce the impact of individual biases or inaccuracies.
- Direct Observation: I spend time observing the processes firsthand to understand the workflow and identify any inconsistencies or overlooked aspects in data.
- Data Verification: I meticulously verify the collected data with the relevant process owners to ensure accuracy and consistency.
- Statistical Analysis: Where appropriate, I use basic statistical tools to analyze data and identify trends or patterns that may point towards potential inaccuracies.
In a recent project, I discovered that initially collected data on processing times were significantly inaccurate due to inconsistent measurement techniques. By implementing a standardized data collection method and verification process, we were able to identify and correct the issue, resulting in a far more accurate and effective VSM.
Q 14. Describe your experience using simulation tools within Minitab or SigmaXL.
I have extensive experience leveraging simulation tools within Minitab and SigmaXL to enhance the value stream mapping process. These tools allow for a more robust analysis of the “what-if” scenarios and potential impact of process improvements.
In Minitab, I’ve used the simulation capabilities to model different process improvements (e.g., reducing processing time, improving machine uptime) and to predict their impact on metrics like lead time and inventory. This allows for a data-driven approach to selecting the most effective improvement strategies. Similarly, SigmaXL’s simulation tools have enabled me to model the effects of variability within the process, providing a more comprehensive view of potential risks and opportunities.
For example, in a recent project, we used Minitab simulation to test the impact of implementing a new buffer inventory strategy. The simulation showed that while the buffer would indeed reduce the frequency of stockouts, it would also increase overall inventory costs. This allowed us to make an informed decision on the optimal buffer size. Simulation adds a powerful layer of analysis to VSM, providing quantitative evidence to support proposed improvements.
Q 15. How do you facilitate workshops for creating Value Stream Maps?
Facilitating a Value Stream Mapping (VSM) workshop requires a structured approach. I begin by setting clear objectives and ensuring all key stakeholders – from shop floor workers to management – are present. We start with a high-level overview of the process, using sticky notes and whiteboards to brainstorm the current state. Then, I guide the team through each step of the process, using a combination of brainstorming, data collection, and visualization techniques. We identify each step, measure its lead time, and determine whether it adds value from the customer’s perspective. Crucially, I emphasize active participation, encouraging everyone to share their insights and challenges. We use visual aids and tools provided by software like Minitab or SigmaXL to create a clear and concise map. The workshop culminates in a finalized current state map and the initiation of planning for future state improvements.
Throughout the workshop, I actively manage time, keep the discussion focused, and resolve conflicts constructively. I also ensure that the final VSM is readily understood and agreed upon by all participants. A post-workshop follow-up is key to maintain momentum and address any outstanding questions or concerns. For example, in a recent workshop for a manufacturing company, the team identified a significant bottleneck in the packaging process, leading to immediate improvements after the workshop.
Career Expert Tips:
- Ace those interviews! Prepare effectively by reviewing the Top 50 Most Common Interview Questions on ResumeGemini.
- Navigate your job search with confidence! Explore a wide range of Career Tips on ResumeGemini. Learn about common challenges and recommendations to overcome them.
- Craft the perfect resume! Master the Art of Resume Writing with ResumeGemini’s guide. Showcase your unique qualifications and achievements effectively.
- Don’t miss out on holiday savings! Build your dream resume with ResumeGemini’s ATS optimized templates.
Q 16. How do you incorporate customer feedback into your VSM analysis?
Incorporating customer feedback is crucial for creating a truly valuable VSM. This involves actively soliciting feedback at various points in the process. We can achieve this through customer surveys, focus groups, interviews, and analysis of customer complaints and returns. This feedback directly informs the identification of value-added activities from the customer’s perspective. For instance, if customer surveys reveal long delivery times are a major concern, the VSM will highlight delivery-related processes and their associated lead times for prioritization in improvement efforts. By directly connecting customer needs and expectations to our VSM, we ensure that our improvement efforts are truly focused on what matters most to the customer.
Furthermore, software like SigmaXL can help quantify customer feedback by analyzing data from surveys or complaint logs. This quantitative data can then be incorporated into the VSM, allowing for a data-driven approach to identifying areas for improvement. This helps us prioritize improvement initiatives based on their impact on customer satisfaction.
Q 17. Explain the role of 5S in improving a value stream.
5S (Sort, Set in Order, Shine, Standardize, Sustain) is a foundational methodology for workplace organization and efficiency. Its implementation significantly enhances a value stream by eliminating waste and improving workflow. In a VSM context, 5S directly contributes to reducing lead times and improving quality. Let’s look at how each aspect helps:
- Sort: Removing unnecessary items from the workspace reduces clutter and streamlines the process.
- Set in Order: Organizing tools and materials logically improves efficiency and reduces search time.
- Shine: Maintaining a clean and organized workspace prevents equipment failures and improves safety.
- Standardize: Implementing standardized processes for 5S ensures long-term maintenance and consistency.
- Sustain: Continuously monitoring and improving the 5S system ensures its ongoing effectiveness.
For example, in a warehouse, implementing 5S can significantly reduce search time for inventory, leading to faster order fulfillment and reduced lead times – all of which are clearly reflected in the VSM through reduced cycle times. A well-implemented 5S program translates directly into a leaner, more efficient value stream.
Q 18. How do you measure the success of VSM implementation?
Measuring the success of VSM implementation goes beyond simply creating a map. We need to track key performance indicators (KPIs) that reflect the impact of improvements. These metrics should be aligned with the goals defined during the workshop. Key metrics include:
- Lead Time Reduction: Did the implemented improvements shorten the overall process time?
- Inventory Reduction: Did the changes minimize work-in-progress (WIP) inventory?
- Defect Rate Reduction: Did improvements lead to fewer errors or defects?
- Cycle Time Reduction: Did the process speed up for individual steps?
- Customer Satisfaction: Did the changes improve customer experience (e.g., shorter lead times, improved quality)?
Software like Minitab can be used to track these metrics over time, allowing for data-driven evaluation of the impact of VSM improvements. By setting baselines before implementation and monitoring these KPIs after improvements, we can quantitatively assess the success of our efforts. Regular review of these metrics ensures continuous improvement and helps identify areas where further optimization is needed.
Q 19. Describe a situation where you used VSM to solve a process problem.
I once worked with a food processing company experiencing significant delays in their packaging line. Using VSM, we mapped the entire process from production to shipping. The map revealed a bottleneck at the labeling station. Labels were being manually applied, causing significant delays and errors. By analyzing the VSM, we identified several improvement opportunities. We implemented an automated labeling system and redesigned the workstation layout to improve workflow. The revised VSM showed a significant reduction in lead time and an improvement in overall efficiency, resulting in a substantial cost savings and increased customer satisfaction.
The success was measured by tracking lead time reduction (30%), defect rate reduction (20%), and increased throughput (15%). This case study highlights how VSM can identify hidden bottlenecks and lead to significant process improvements using a data-driven approach.
Q 20. What are the key differences between VSM and other process mapping techniques?
While both VSM and other process mapping techniques (like flowcharts or swimlane diagrams) aim to visualize processes, VSM distinguishes itself through its focus on value from the customer’s perspective and its inclusion of key metrics. Other techniques often lack this customer-centric approach and quantitative data integration. Specifically:
- Customer Focus: VSM explicitly identifies value-added and non-value-added activities from the customer’s viewpoint, enabling prioritization of improvement efforts on what truly matters.
- Quantitative Data: VSM incorporates key metrics like lead times, inventory levels, and cycle times, providing a data-driven understanding of process performance.
- Waste Identification: VSM is explicitly designed to identify and quantify various types of waste (TIMWOOD), enabling targeted improvement actions.
- Future State Mapping: VSM extends beyond current state mapping, facilitating the planning and visualization of future state improvements.
Flowcharts, for example, primarily focus on the sequence of activities without explicitly considering customer value or quantitative data. VSM provides a more comprehensive and actionable approach to process improvement.
Q 21. Explain your understanding of Little’s Law and its application to VSM.
Little’s Law states that the average number of items in a system (inventory) is equal to the average arrival rate (throughput) multiplied by the average time an item spends in the system (lead time). In the context of VSM, this is expressed as: Inventory = Throughput x Lead Time.
Inventory = Throughput x Lead Time
This law is fundamental to VSM because it helps understand the relationship between inventory, throughput, and lead time. For example, if we aim to reduce inventory, we can either reduce lead time by improving process efficiency or reduce throughput by adjusting production rates to match demand. Analyzing these relationships using Little’s Law within the VSM allows for data-driven decision-making regarding process improvement strategies. Understanding this relationship is crucial for optimizing inventory levels, reducing waste, and improving overall efficiency.
Q 22. How do you handle resistance to change during VSM implementation?
Resistance to change is a common hurdle in VSM implementation. It often stems from fear of the unknown, workload concerns, or perceived threats to established roles. My approach involves a multi-pronged strategy focusing on communication, collaboration, and demonstrating value.
- Transparency and Education: I begin by clearly explaining the purpose of the VSM, highlighting its benefits – such as improved efficiency and reduced waste – and involving the team in the process from the start. This ensures everyone understands the ‘why’ behind the changes.
- Addressing Concerns: I actively listen to and address individual concerns. This might involve demonstrating how the proposed changes won’t increase workload but rather redistribute it more efficiently. Sometimes, this requires showing concrete data and projections based on process improvements identified in the VSM.
- Pilot Projects and Incremental Change: Instead of overwhelming the team with a massive overhaul, I advocate for pilot projects focusing on a smaller, manageable section of the process. Successful implementation of these pilot projects builds confidence and demonstrates the positive impacts of the VSM approach, making future changes more readily accepted.
- Celebrate Successes: Recognizing and celebrating milestones achieved during implementation strengthens team morale and reinforces the positive changes.
For example, in a previous project with a manufacturing team hesitant to embrace VSM, we started with a pilot project focusing on optimizing a single assembly line. The success of this pilot, which reduced cycle time by 15%, convinced the rest of the team to participate fully in the larger VSM implementation.
Q 23. How do you choose the appropriate scale for your Value Stream Map?
Choosing the right scale for your Value Stream Map is crucial for clarity and effectiveness. The scale should be appropriate for the complexity of the process and the level of detail needed. Generally, it’s recommended to maintain a balance between providing enough detail to identify issues and keeping the map concise enough to be easily understood and used.
- Time Scale: The horizontal axis typically represents time, either in minutes, hours, days, or weeks, depending on the process duration. For a process taking several weeks, a weekly scale might be best. For a process completed within a day, a hourly or even a minute scale might be necessary.
- Quantity Scale: The vertical axis often represents the quantity of units produced or processed. The scale chosen here needs to be appropriate for the output rate of the process.
- Consideration of Physical Space: The physical size of the Value Stream Map should be considered. A too-large map can be hard to manage and comprehend, while a too-small map can lack crucial details.
For instance, in mapping a high-volume manufacturing process, a daily or even weekly time scale might be suitable, while mapping a customer service process involving individual case handling could require a hourly or per-case scale.
Q 24. Describe your experience with different software for VSM (beyond Minitab/SigmaXL).
My experience extends beyond Minitab and SigmaXL. I’ve worked with several other VSM software tools, each with its own strengths and weaknesses.
- Lucidchart: A user-friendly, cloud-based tool offering excellent collaboration features. It’s great for creating visually appealing maps, but its advanced analytics capabilities are limited compared to dedicated process improvement software.
- Creately: Similar to Lucidchart in its ease of use and visual appeal. It provides a wider range of templates and symbols compared to some other platforms.
- Draw.io: Another versatile, free tool suitable for collaborative map creation and sharing. Similar to Lucidchart and Creately, its analytics features are relatively basic.
- ProcessSimulate: Offers discrete event simulation capabilities integrated with VSM, providing insights into process behavior and potential improvements. This is particularly useful for complex processes where simple visual mapping is insufficient.
The choice of software often depends on the project’s specific needs and the team’s technical skills. For instance, if the focus is on rapid prototyping and visual communication, a tool like Lucidchart or Creately might be ideal. If detailed simulation and analysis are required, a tool like ProcessSimulate would be more suitable.
Q 25. How do you ensure the VSM remains relevant and up-to-date over time?
Maintaining the relevance of a VSM requires a proactive approach. It’s not a one-time project but a living document that evolves with the process.
- Regular Reviews: I recommend conducting regular reviews, at least quarterly, to assess the accuracy of the map and identify any changes in the process. These reviews should involve the team members directly working in the process.
- Feedback Mechanisms: Establishing a system for feedback from team members working within the process is crucial. This allows for early identification of emerging issues and allows for timely updates to the VSM.
- Kaizen Events: Integrating the VSM into Kaizen events provides a structured way to identify and implement improvements. The VSM becomes a key tool for tracking progress and visualizing the impact of changes.
- Version Control: Maintaining different versions of the VSM allows for tracking the changes over time, making it easy to revert to previous versions if necessary.
Imagine a manufacturing process: A new machine is introduced; the VSM needs to be updated to reflect this change and its impact on the workflow. If this is not done, the VSM becomes outdated and loses its value. A system of version control and regular reviews prevents this.
Q 26. What are some common mistakes to avoid when creating a VSM?
Several common mistakes can hinder the effectiveness of a VSM. Avoiding these pitfalls is key to creating a useful and actionable tool.
- Lack of Team Involvement: Creating a VSM in isolation leads to an inaccurate and unusable map. The team members involved in the daily process are the key source of accurate information.
- Insufficient Detail: A VSM that lacks sufficient detail regarding process steps, lead times, and inventory levels is unlikely to reveal valuable insights.
- Ignoring Non-Value-Added Activities: Failing to identify and highlight non-value-added activities (waste) prevents the VSM from being used to improve efficiency.
- Overly Complex Maps: Complex and cluttered maps are difficult to understand and use. Simplicity and clarity are key.
- Not Using Data: Relying on assumptions rather than actual data leads to inaccurate representation of the process.
For example, failing to include inventory levels in a VSM of a warehouse operation prevents identification of potential storage space and handling inefficiencies. A detailed and accurate map based on actual data will expose such issues.
Q 27. How do you use VSM to identify bottlenecks in a process?
A VSM reveals bottlenecks by visually representing the flow of materials and information. Bottlenecks are identified as points in the process where the flow is significantly slowed or interrupted.
- Lead Time Analysis: By analyzing lead times (the time it takes for a product to move through a process step), you can identify steps with unusually long lead times, indicating potential bottlenecks.
- Inventory Levels: High inventory levels at a specific point suggest a bottleneck downstream preventing efficient processing of the accumulated inventory.
- Capacity Analysis: Comparing the capacity of each process step with the overall demand reveals steps with insufficient capacity, forming potential bottlenecks.
- Visual Inspection of the Map: A visual inspection of the map itself often reveals pinch points where materials or information pile up, immediately pointing to bottlenecks.
In a manufacturing setting, a bottleneck might be a machine operating slower than others, or a process step with limited manpower compared to the workflow. The VSM visualizes this clearly.
Q 28. Explain how you would use VSM to support Kaizen events.
VSMs are integral to supporting Kaizen events. They provide a visual foundation for identifying improvement opportunities and tracking progress.
- Pre-Kaizen Analysis: Before a Kaizen event, the VSM is used to clearly define the current state of the process, highlighting areas with potential for improvement.
- Targeting Improvements: The VSM helps the team focus on specific areas identified as bottlenecks or sources of waste, making the Kaizen event more focused and efficient.
- Visualizing Improvements: During the Kaizen event, proposed improvements are documented on the VSM, allowing the team to visually assess the impact of those changes.
- Post-Kaizen Assessment: After the Kaizen event, the updated VSM shows the improved process flow, highlighting the achievements and quantifying the benefits.
In a previous Kaizen event focused on reducing lead times in an order fulfillment process, the initial VSM clearly showed a bottleneck in the picking stage. The Kaizen team used this information to brainstorm and implement solutions, which were then documented on an updated VSM, illustrating the improved process flow and reduced lead times.
Key Topics to Learn for Value Stream Mapping Software (e.g., Minitab, SigmaXL) Interview
- Understanding Value Stream Mapping Principles: Grasp the core concepts of value stream mapping, including identifying value-added and non-value-added activities, and the flow of materials and information.
- Software Proficiency: Demonstrate hands-on experience with the chosen software (Minitab or SigmaXL). Practice creating and interpreting value stream maps, including data input, analysis, and visualization.
- Data Analysis Techniques: Familiarize yourself with relevant statistical tools and techniques used within the software, such as process capability analysis, cycle time analysis, and bottleneck identification.
- Process Improvement Methodologies: Understand how value stream mapping integrates with lean methodologies like Kaizen and Six Sigma. Be prepared to discuss practical applications and improvement strategies.
- Interpreting Results and Reporting: Practice presenting your findings clearly and concisely through visual representations (charts, graphs) and written reports. Be able to explain your analyses and recommendations effectively.
- Practical Application Scenarios: Prepare examples from your experience (or hypothetical scenarios) demonstrating how you have used value stream mapping software to identify and solve problems, leading to process improvements.
- Advanced Features (Software Specific): Explore advanced features within your chosen software (Minitab or SigmaXL) to showcase a deeper understanding and capability.
Next Steps
Mastering Value Stream Mapping software like Minitab or SigmaXL is crucial for career advancement in process improvement and operations management. It demonstrates a valuable skillset highly sought after by many employers. To significantly boost your job prospects, create an ATS-friendly resume that highlights your expertise. We strongly recommend using ResumeGemini to craft a compelling and effective resume that showcases your skills and experience. ResumeGemini provides tools and examples to help you build a professional resume tailored to roles requiring Value Stream Mapping Software proficiency. Examples of resumes specifically highlighting Minitab and SigmaXL skills are available to guide you.
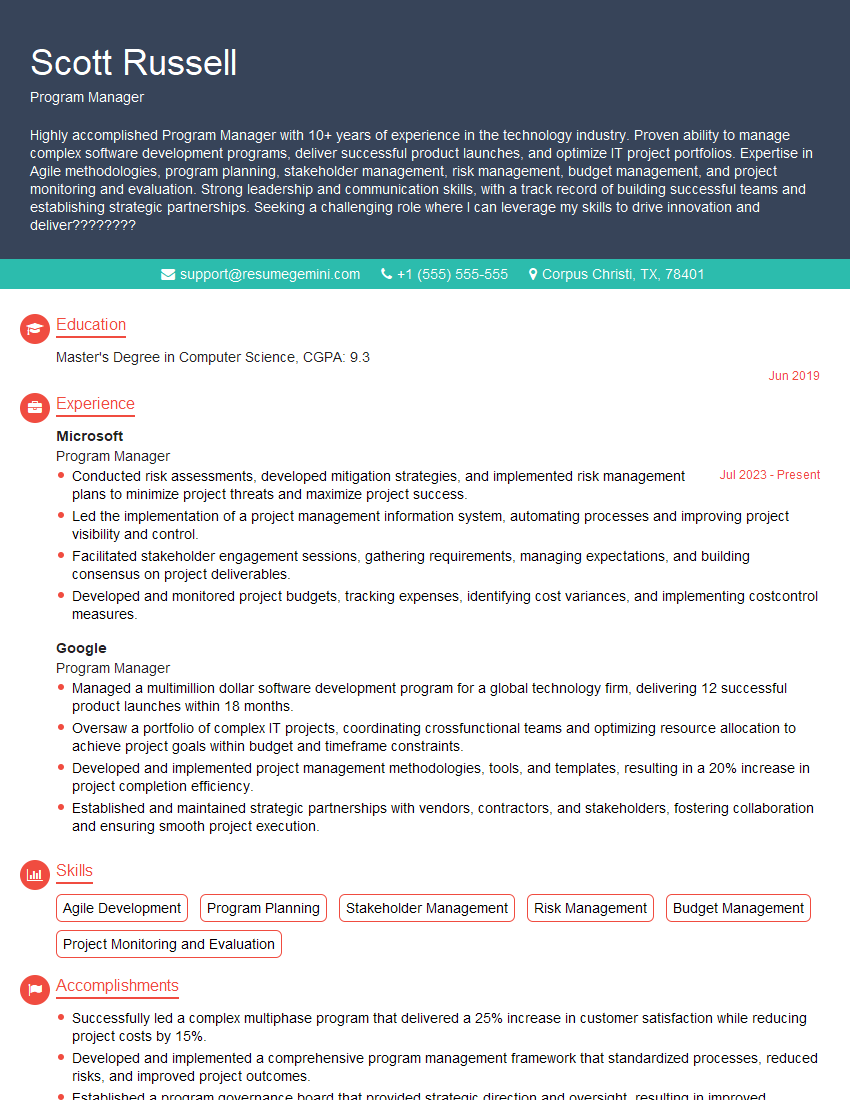
Program Manager Resume Sample
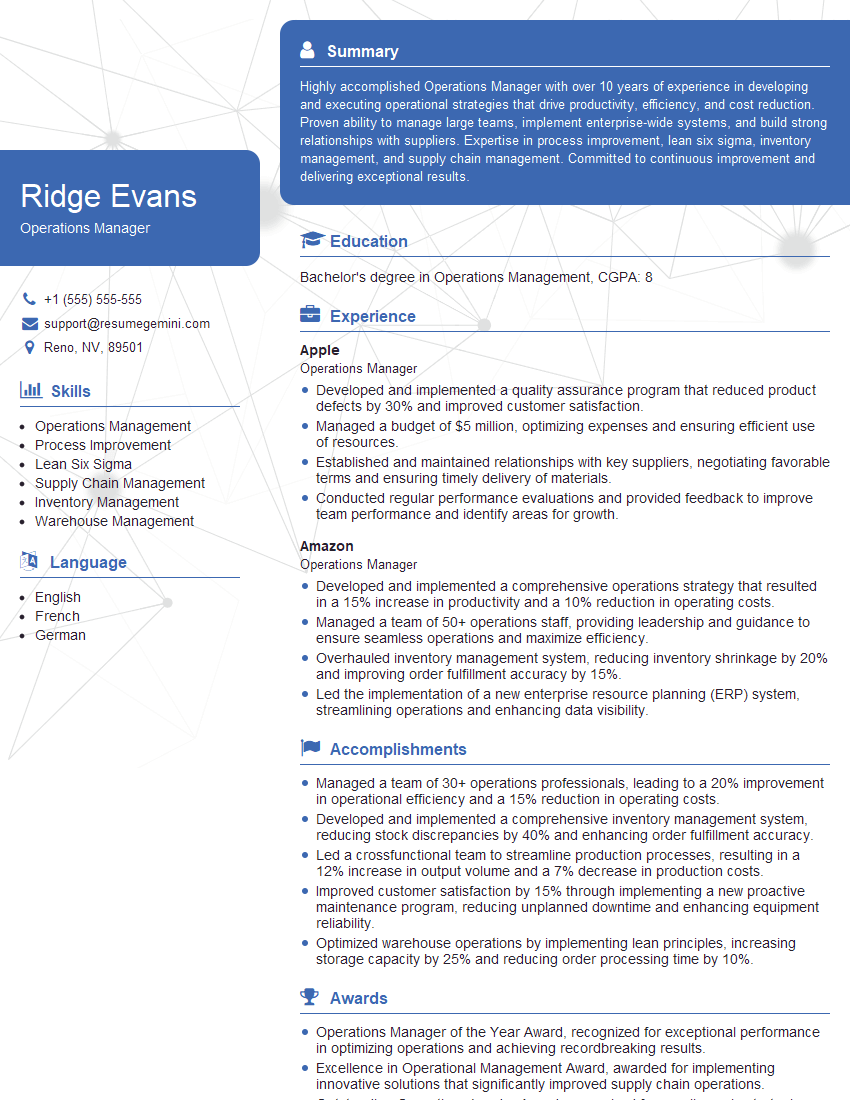
Operations Manager Resume Sample
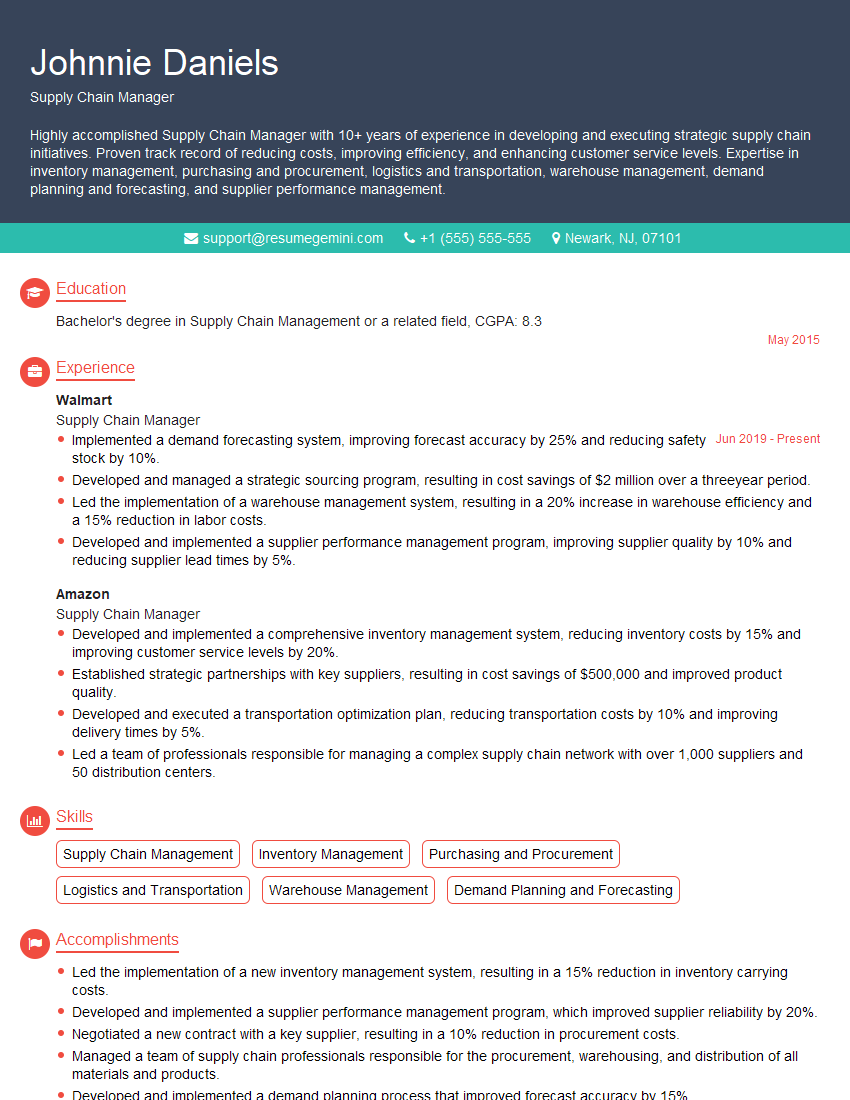
Supply Chain Manager Resume Sample
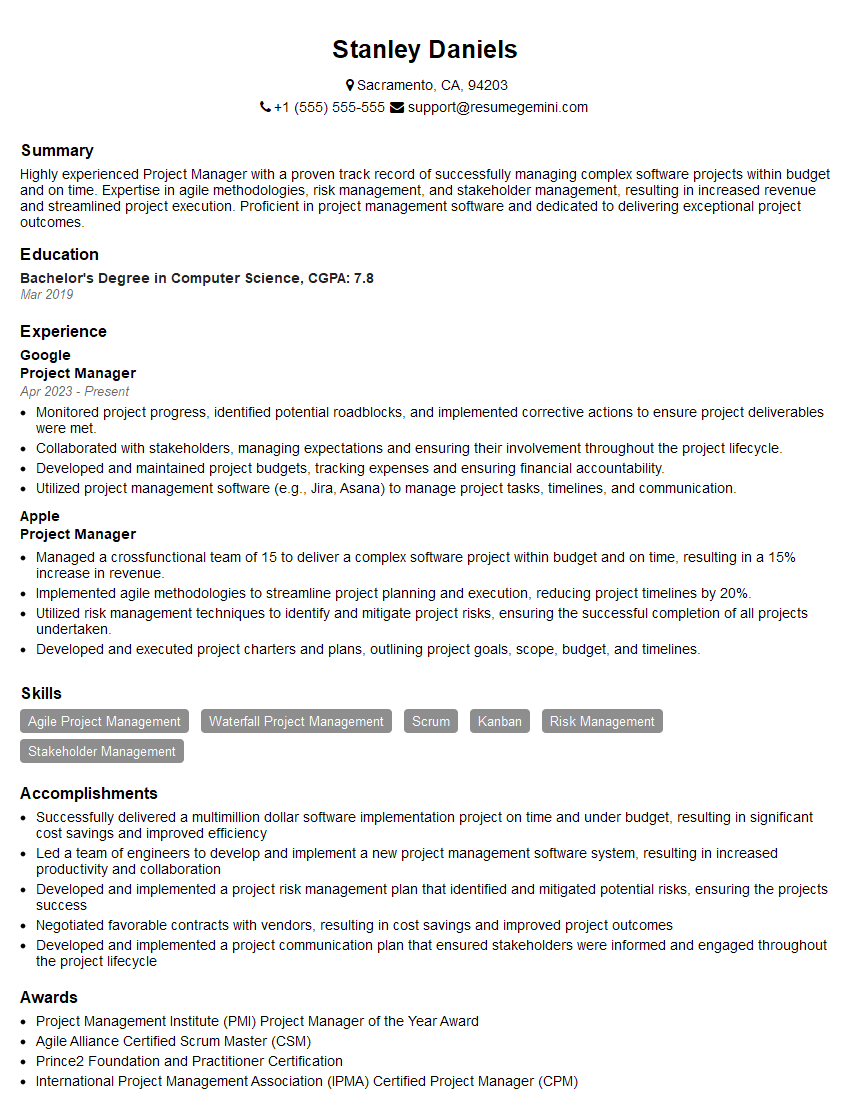
Project Manager Resume Sample
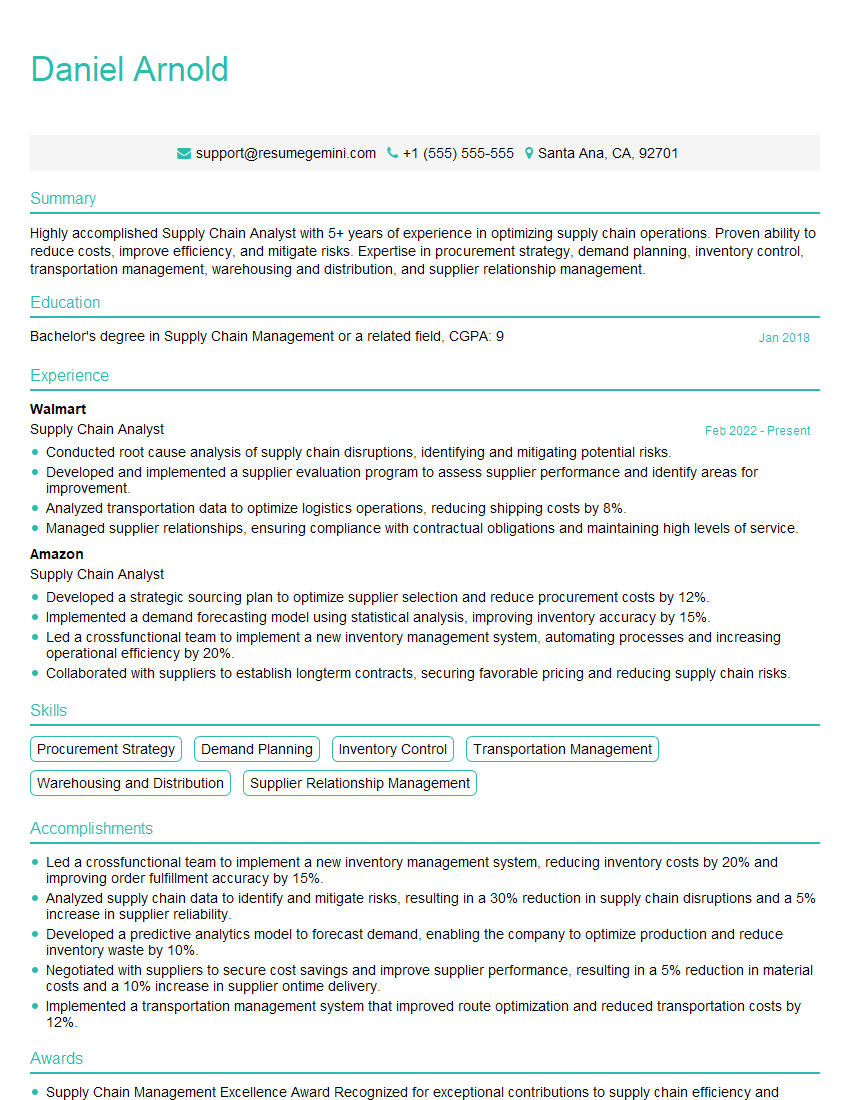
Supply Chain Analyst Resume Sample
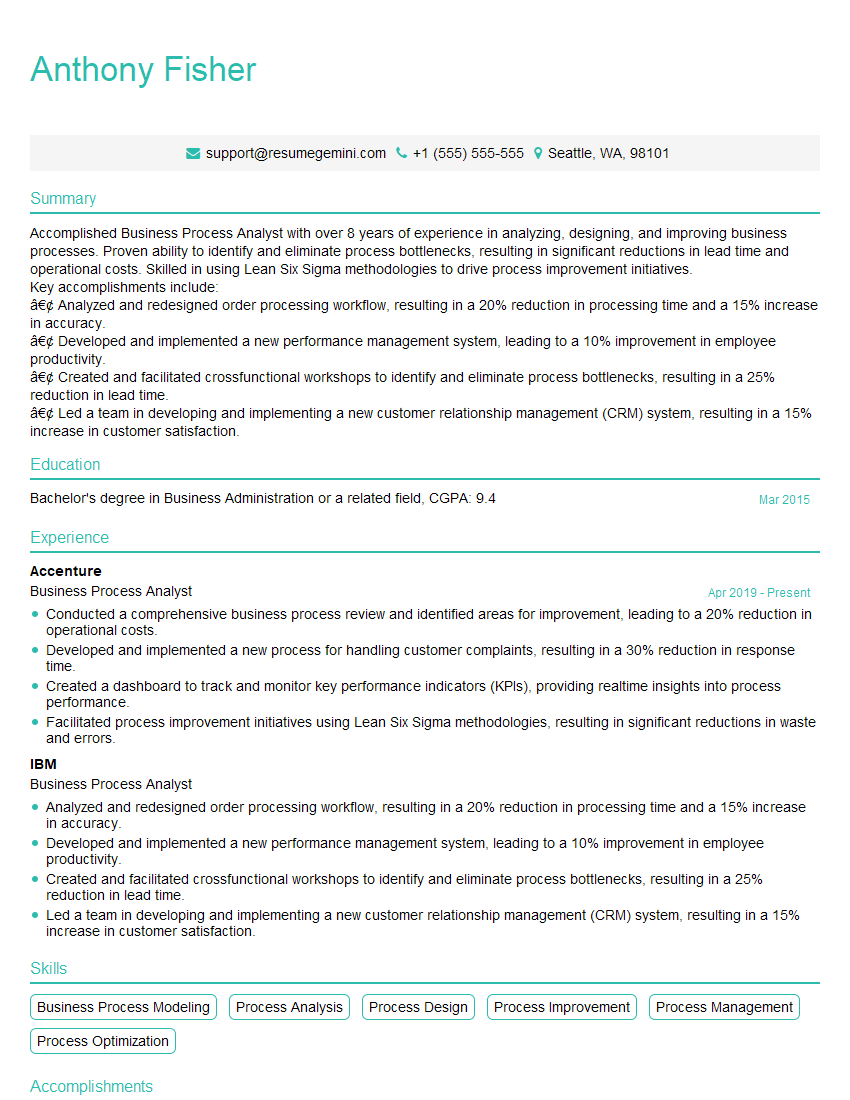
Business Process Analyst Resume Sample
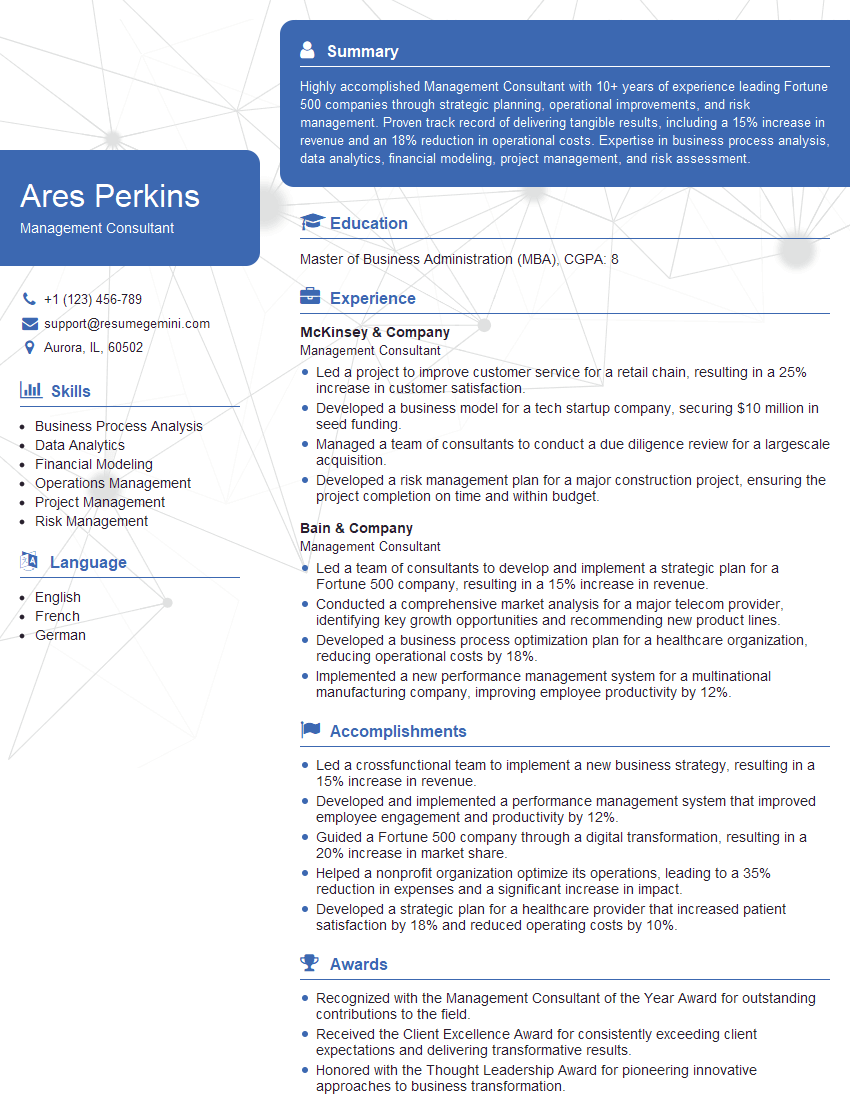
Management Consultant Resume Sample
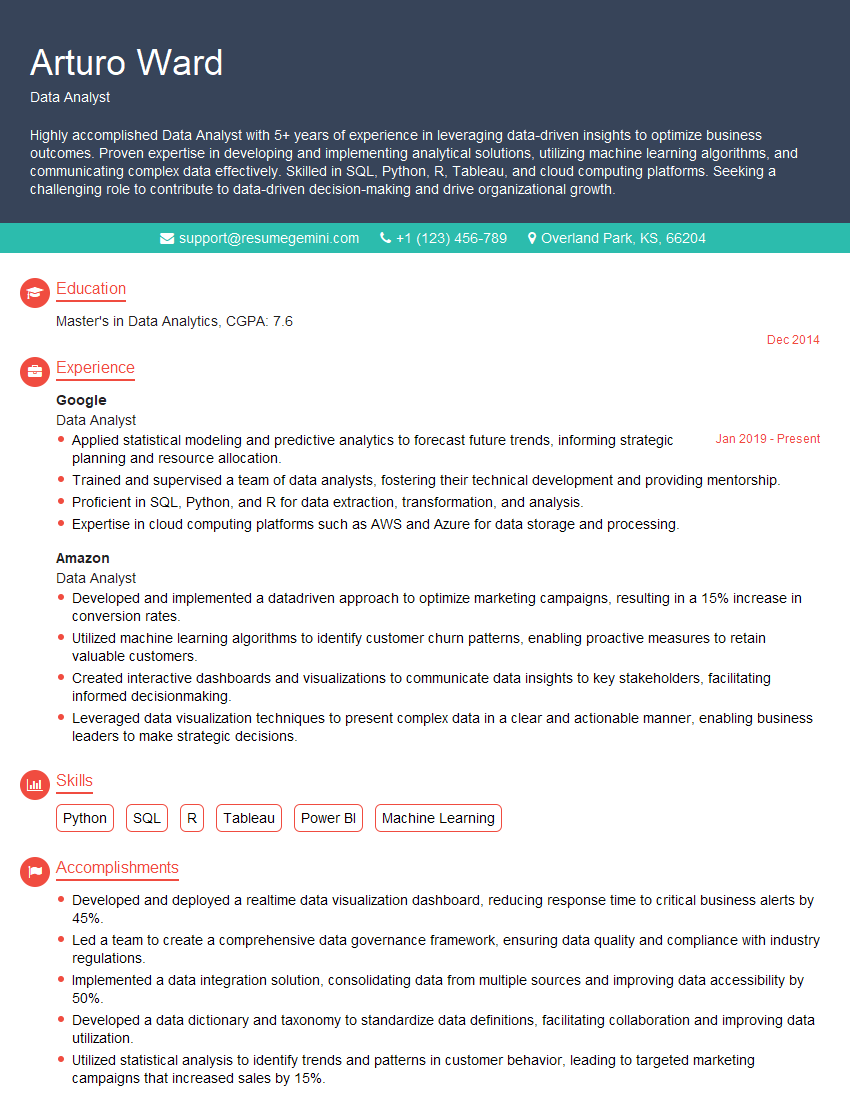
Data Analyst Resume Sample
Process Engineer Resume Sample
Quality Engineer Resume Sample

Operations Research Analyst Resume Sample
Industrial Engineer Resume Sample
Manufacturing Engineer Resume Sample
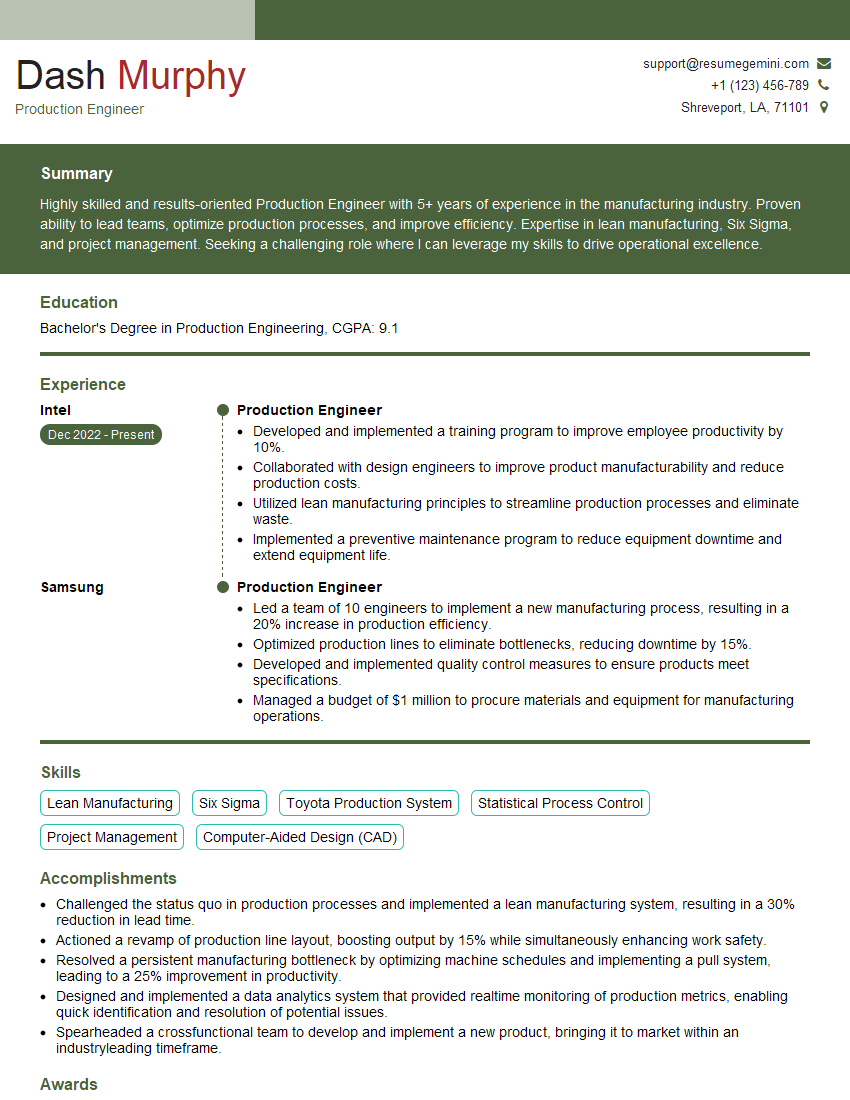
Production Engineer Resume Sample
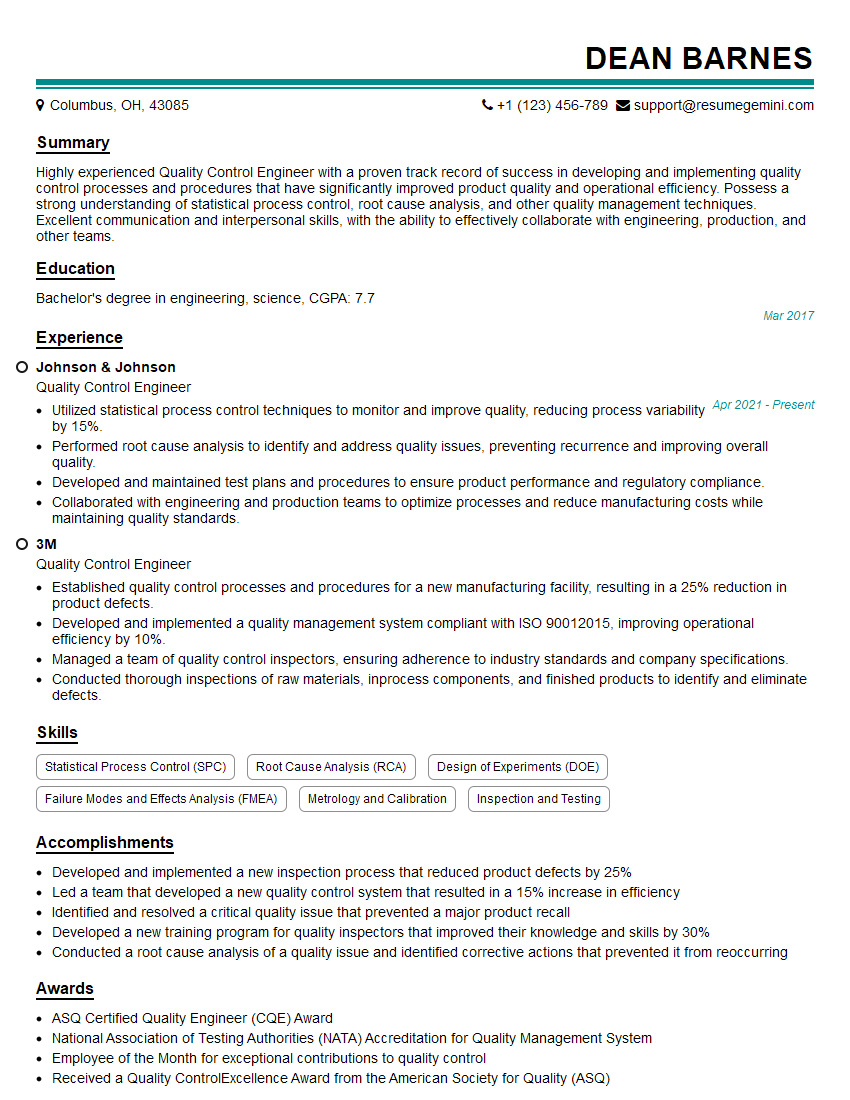
Quality Control Engineer Resume Sample
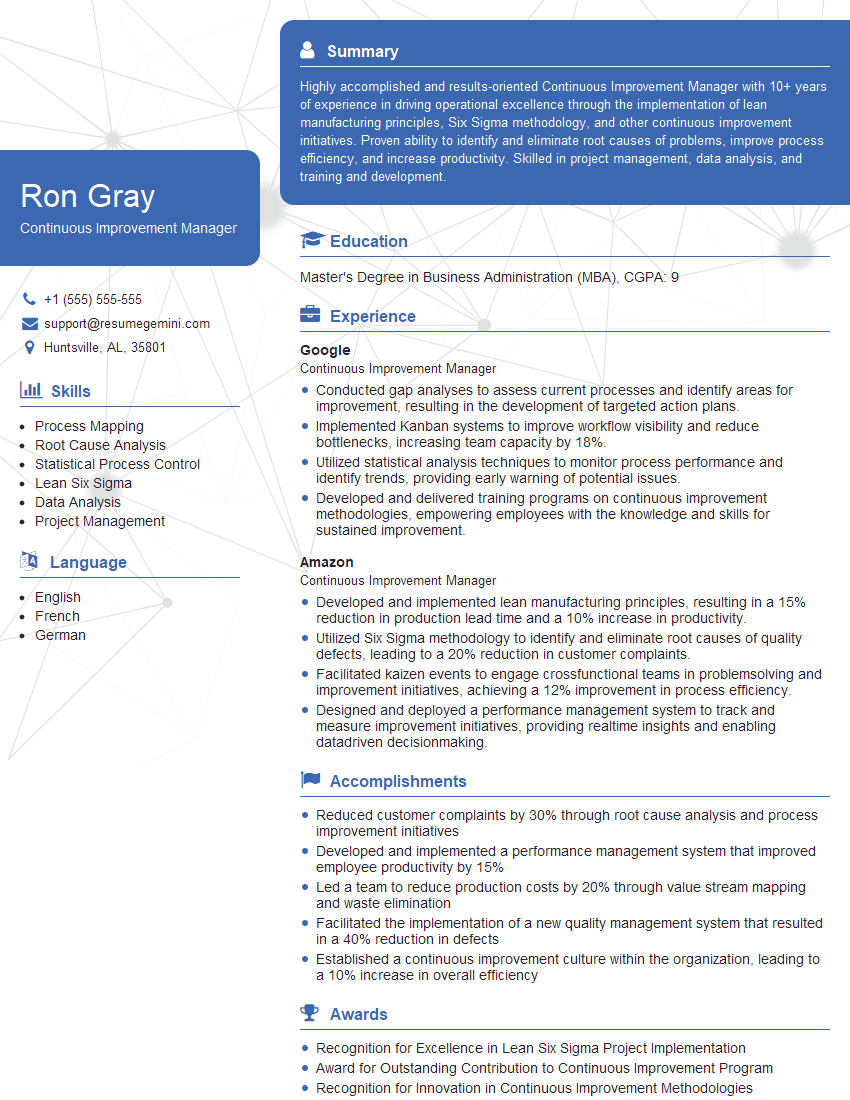
Continuous Improvement Manager Resume Sample
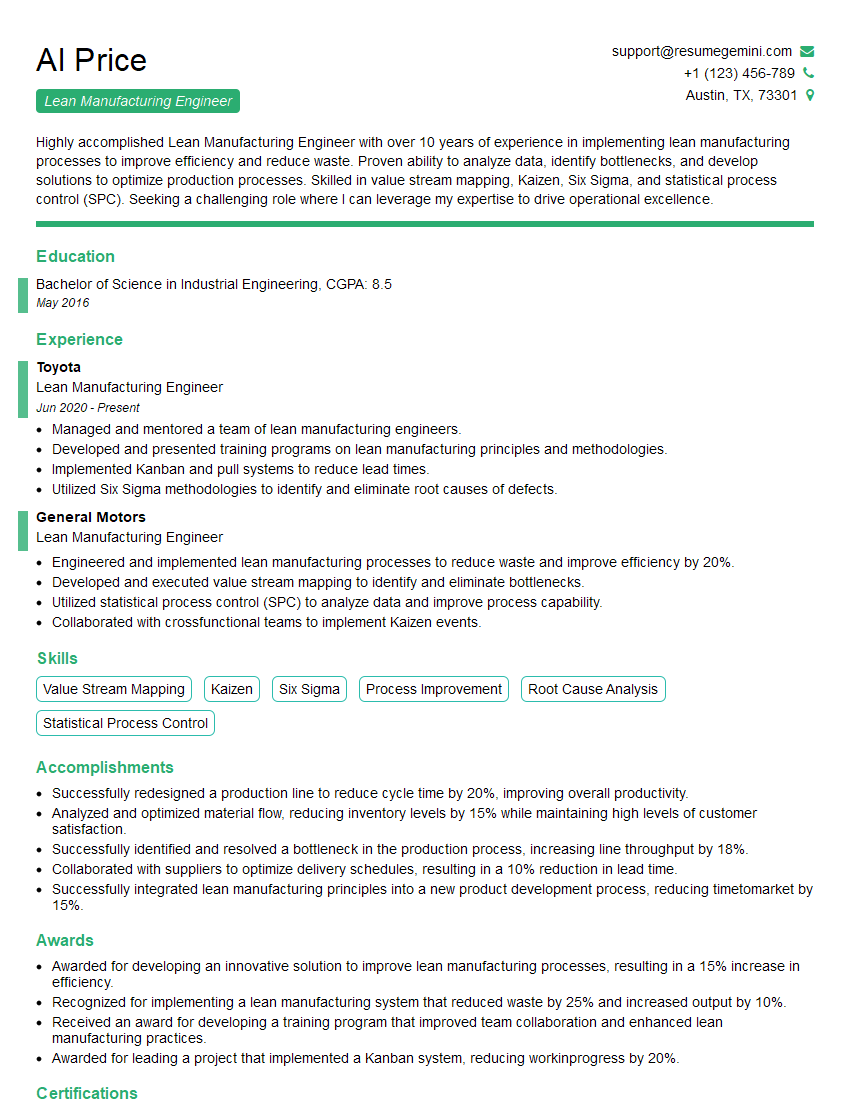
Lean Manufacturing Engineer Resume Sample
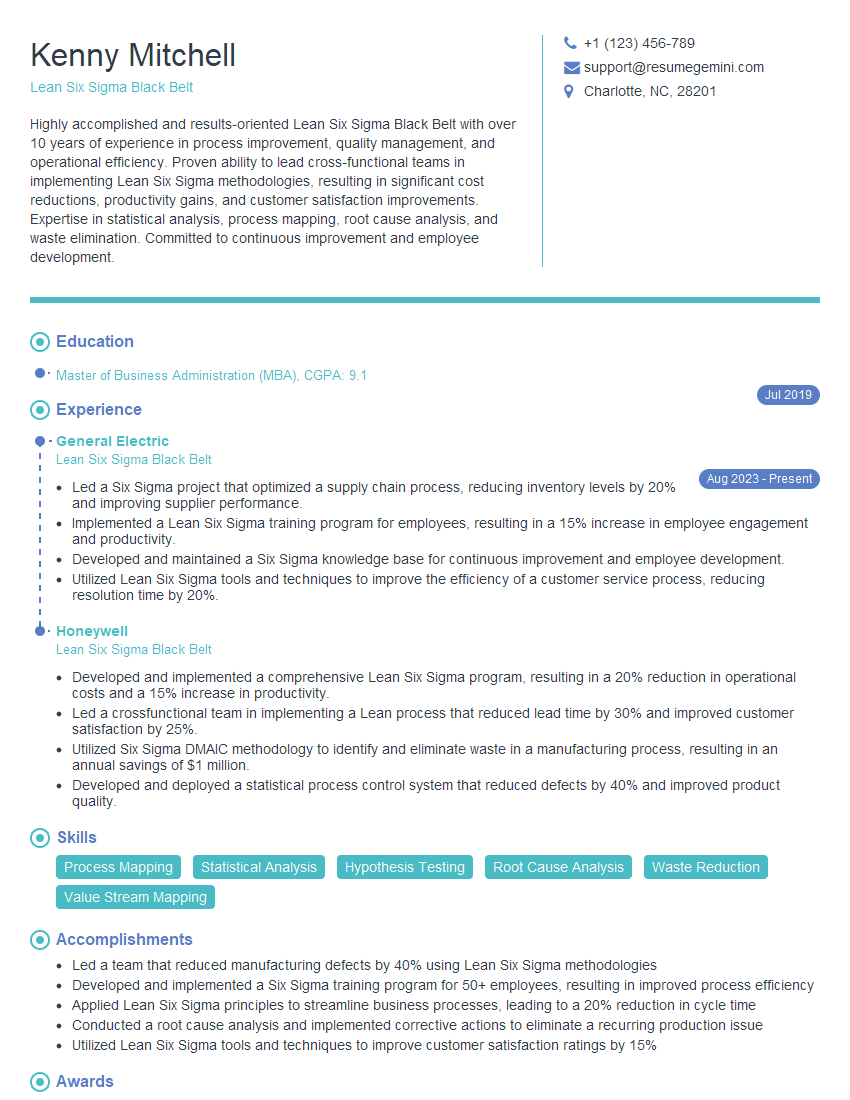
Lean Six Sigma Black Belt Resume Sample
- Program Manager
- Operations Manager
- Supply Chain Manager
- Project Manager
- Supply Chain Analyst
- Business Process Analyst
- Management Consultant
- Data Analyst
- Process Engineer
- Quality Engineer
- Operations Research Analyst
- Industrial Engineer
- Manufacturing Engineer
- Production Engineer
- Quality Control Engineer
- Continuous Improvement Manager
- Lean Manufacturing Engineer
- Lean Six Sigma Black Belt
Explore more articles
Users Rating of Our Blogs
Share Your Experience
We value your feedback! Please rate our content and share your thoughts (optional).
What Readers Say About Our Blog
Very informative content, great job.
good